
Abstract
While a large body of studies has captured macro financial inclusion on the supply side, this research paper contributes significantly to the literature on determining financial inclusion in Vietnam from the demand side. The primary target of this paper is to measure an overall financial inclusion index by employing micro data of 1,002 respondents in Vietnam from the World Bank. Additionally, based on the calculation of financial inclusion index, we investigate the determinants of financial inclusion and examine the barriers to financial inclusion in Vietnam. The ordinary least squares regression analysis and logit regression are employed to estimate the effect of demographic characteristics and the barriers to financial inclusion. The main findings reveal that people who are female, wealthier, more educated, or in the workforce exhibit a higher financial inclusion index. Besides, the financial inclusion level of high-income people is not affected by working status, while this level of middle and low-income people does. Women are also less likely to be financially included because they complain that financial institutions are too far away or because another family member has an account. Older people are more concerned about lack of documentation, lack of trust, and demand reasons. To achieve the purposes of robustness, the measurement of financial inclusion was changed following previous studies to confirm robust and stable baseline results. Accordingly, these findings contribute to issuing adequate policies that break the barriers to financial inclusion and enhance financial inclusion, especially for less educated, poor, out of the workforce, and old people.
Introduction
Increasing financial inclusion is one of the key drivers of economic growth and income inequality reduction (World Bank, 2018a). Households and individuals who are financially included could capture economic and financial services and products in order to increase saving and investment, and have resources for education, businesses, and health outcomes (Aterido et al., 2013; Bruhn & Love, 2014; Dupas & Robinson, 2013).
Financial inclusion is mainly observed on the suppliers’ side while the demand side which presents the actual usage of financial products or services more accurately reflects the level of financial inclusion of end-consumers. On the supply side, access to financial institutions is usually reported as the data of the numbers of bank branches and automatic teller machines (ATM). These indicators considered banking penetration two common measurements of financial inclusion (Beck et al., 2005, Beck et al., 2008). Sarma (2008) also employs the proportion of loans and deposits to GDP as the result of financial inclusion. However, the research conducted by Honohan and King (2009) supposes that using general data from suppliers such as banking systems (ATMs, bank branches, and the number of credits to GDP) could not reflect the actual use of individuals, while the data usage from the demand side should be more sufficient to measure financial inclusion. From the end-consumer’s perspective, the determinants of financial inclusion are affected by individuals’ characteristics. In the research of Allen et al. (2012), income level and resident area affect individuals’ decisions on participating in financial markets. Additionally, financial inclusion is also driven by some characteristics such as gender, age, and education attainment (Zins & Weill, 2016). A huge number of researchers mentioned the impact of demographic characteristics on financial inclusion in Ghana (Akudugu, 2013), Peru (Cámara & Tuesta, 2014), and China (Fungáčová & Weill, 2015). Accordingly, though determining financial inclusion from the demand side is important work, very few papers conducted this research, especially in Vietnam.
Vietnam has been in the transitional process from a centrally planned economy controlled by the government to a market-oriented system. After applying this policy in 1986, Vietnam has gained a lot of social and economic achievements. From a poor country, Vietnam is now categorized as a lower-middle-income country with a stable and prospective economic growth rate. To reach this achievement, the financial industry plays an essential role. Vietnam has been focusing on improving the financial sector as a key driver of economic growth. However, based on the assessment of the World Bank (2017), only 31% of Vietnamese people above 15 years old have an account at formal financial institutions, while the average number in lower-middle-income countries is 56%. This figure demonstrates the low level of financial inclusion in Vietnam in micro insights. Thus, instead of approaching financial inclusion from a supply-side as available studies, financial inclusion in Vietnam should be investigated in micro insights to explore how individuals’ characteristics affect their financial inclusion.
To bridge the gaps in both measuring financial inclusion on the demand side and the lack of research on financial inclusion in Vietnam, this paper is conducted to determine financial inclusion in Vietnam from the demand side. By employing the micro data from the World Bank for Vietnam in 2017 and collecting data from basic financial products such as accounts, savings, and payments to more upgraded products (internet banking, mobile banking), this paper constructs a comprehensive index score to measure individuals’ financial inclusion level. This index captures two perspectives including holding financial products and using financial products. In this paper, financial inclusion would be determined by individuals’ characteristics such as gender, age, education attainment, income level, and working status. We classify 1,002 observations into seven age groups to identify the turning point of the nonlinear relation between age and financial inclusion score. Likewise, people in high-income and low-income groups are also analyzed. Finally, this paper determines the barriers to financial inclusion in Vietnam and presents significant findings to policymakers.
This research paper includes five sections. The literature review is summarized in the next section. Section 3 introduces the empirical research model and data. Empirical findings and discussion are exhibited in section 4. Section 5 summarizes highlight points and conclusions.
Literature Review
Overview of Financial Inclusion
Over the last decade, financial inclusion has been recognized as a core strategy in the finance industry and has also attracted attention of researchers and policy makers. Recently, along with the industrial revolution 4.0, the financial inclusion term has become widely known. The World Bank (2017) officially defined financial inclusion as “individuals and businesses have access to useful and affordable financial products and services that meet their needs – transactions, payments, savings, credit and insurance – delivered in a responsible and sustainable way.” By capturing a narrower view, the Asian Development Bank (2015) mainly focuses on the price of financial services and illustrates the financial inclusion term that households and companies could readily access financial services with reasonable prices. The contrary term of financial inclusion is financial exclusion which is early defined as the prevention of the poor and other social groups from accessing products and services of the financial industry (Leyshon & Thrift, 1995). In addition, Carbó et al. (2005) introduced financial exclusion as the process in which special groups in society could not access the mainstream of financial services.
Financial inclusion is a critical facilitator of poverty reduction and economic growth. Recently, financial inclusion has gained significant headway that promotes both households’ and businesses’ access to formal financial products and services. Researchers and policymakers have paid more attention to financial inclusion and considered it one of the most potential contributions to a nation’s sustainable development. Individuals and enterprises gain access to financial services transactions, including payments, savings, insurance, and investment offered in a responsible and sustainable manner. Access to a transaction account is the first step toward greater financial inclusion since it allows people to keep money or send and receive payments. Accordingly, a transaction account serves as a doorway to other financial services.
The public goods theory proposed by Samuelson (1954) which is considered to apply in the financial inclusion context claims that financial inclusion provides formal financial services for the whole population and ensures that there are no barriers preventing anybody from gaining access to financial resources. In addition, financial inclusion should be considered a community resource offering benefits to all citizens. Individuals cannot be barred from utilizing formal financial services or from having access to financial services because they are a public good. Everyone will have access to fundamental financial services without having to pay for them. Also, access to financial services by one person does not limit its availability to others, implying that all members of the population may be brought into the formal financial sector and benefit equally.
According to this theory, all members of the public benefit from financial inclusion, and no one is excluded. Based on the public goods principle, all people in the society can carry out financial dealings without being charged a fee or without additional costs. However, financial institutions which provide financial services will endure the expense of offering financial services as operation and other costs. The government may grant financial institutions subsidies to assist them in dealing with any cost issues that may occur as a result of providing free financial services. Accordingly, there is hope that the financially excluded population may be brought into the formal financial sector and given access to formal financial goods and services thanks to financial inclusion, which has been a prominent policy priority in many countries, particularly in developing and emerging economies (Allen et al., 2016). Many governments are exerting great effort to ensure their citizens have access to a wide range of financial services and they have achieved financial inclusion, including India, Rwanda, and Kenya (Hove & Dubus, 2019; Nimbrayan et al., 2018; Otioma et al., 2019).
Additionally, financial inclusion has the potential for improving income and consumption of the poor, resulting in poverty reduction. According to the International Monetary Fund (2018), greater financial inclusion is associated with a significant reduction in income inequality. Financial inclusion makes it convenient for people with low income to save and access the insurance products that assist the poor to manage risks from unexpected occurrences such as health problems and pandemics. The poor can also use credit services at a low transaction cost to enhance their production. As a result, individuals will have more opportunities to save money and access better health care facilities (Copestake, 2010). Furthermore, Burgess and Pande (2005) discovered that an increase in the number of bank accounts leads to the expansion of saving and lending activities in rural areas, which pushes the increase in overall production in non-agricultural sectors. Hence, it increases employment rate and reduces poverty in these communities.
The Determinants and Barriers to Financial Inclusion
Determining financial inclusion is facing the argument about capturing two aspects: access to and usage of financial services. In developed countries such as the United States and the United Kingdom, the difference between access to finance and usage of finance is trivial. Hence, access to finance could be considered to be equivalent to usage (Stone, 2005). However, Beck et al. (2008) pointed out the dissimilarity between access to and usage of financial services in determining financial inclusion. They argue that access only belongs to the supply side, while the usage comprises both the demand and supply sides. Regarding the usage, there are two kinds of finance users defined as voluntary and involuntary exclusion. Voluntary exclusion describes individuals as those who access the financial system but actively decide not to use its services. The explanation for that decision stems from unattractive financial products and ethical or religious reasons. Besides, some individuals use financial services indirectly through their relatives’ accounts for transactions. In this case, from the supply side, the financial institution cannot recognize them as the clients’ accessing data. Both mentioned cases are considered “self-exclusion” because they do not have the demands for inclusion, not due to a lack of suppliers. From the supply perspective, these individuals exclude the unbanked group that includes households and individuals who do not meet the requirements for income or possess a high risk of loan products. In addition, inadequate transaction costs, lack of information, and lack of professional systems for risk management are some disadvantages of suppliers, constraining the access to products and services of financial institutions (Beck et al., 2008). Due to the complicated and unclear distinction between access and usage, Honohan and King (2009) also argued that applying the usage of data could reflect the number of accesses.
In the light of the above-mentioned section, determining financial inclusion in recent works is usually presented from two perspectives: the provider’s viewpoint and the user’s perspective. From the supplier side, Beck et al. (2005) considers banking system penetration the level of financial inclusion. A set of traditional elements are used to proxy banking system penetration related to physical access, affordability, and the legality of deposit and loan products. The authors tend to use the number of bank branches and ATMs for penetration. Besides, they also employ the number of loan and deposit accounts per capita, the share of loan and deposit to GDP. In the research of Sarma (2008), the author argues that separately observing these indicators could not explain the level of financial inclusion. Therefore, an index of financial inclusion is constructed based on three dimensions: banking penetration, availability, and usage of banking services with higher value of index represented for higher level of financial inclusion. Similarly, Amidžić et al. (2014) also employs these indicators. However, the authors measure financial inclusion through a new composite index by weighting elements instead of calculating equal weight. Against this background, researchers who support demand side argue that financial inclusion should be driven by consumer’s socioeconomic characteristics and their behavior features, while the level of access to financial market could not reflex for high inclusiveness in finance industry (Abel et al., 2018; Cámara & Tuesta, 2014).
From the user’s characteristics, a huge number of studies empirically assess the potential key driver. As a pioneer, Demirgüç-Kunt and Klapper (2012) combine the Global Financial Inclusion database with their qualitative research in order to explore the vital role of personal features in determining their financial inclusion. Their research covers 148 countries and is considered the core research on this topic. Accordingly, Allen et al. (2012) documented that both characteristics related to income and resident area are two main concerns for financial inclusion. In particular, the poor people who live in rural areas tend to be excluded from financial products and services. Additionally, transaction costs and distance to financial service counters are also crucial barriers to accessing financial services of respondents from 123 countries. Zins and Weill (2016) also applied the World Bank’s Global Findex database to 37 countries in Africa. They measured financial inclusion by employing the formal account, saving, and credit data determined by gender, age, education, and income of respondents. The results demonstrated that individuals who have higher education and income would exert a higher level of financial inclusion, while males and older individuals contribute on a minor scale. Allen et al. (2012) investigates a much wider sample of over 150,000 interviewees in 140 countries and give evidence that those who are richer, have higher education, are older, are citizens in urban, and join the workforce have a higher probability of owning an account and saving at formal financial institutions.
Besides, borrowing is more dependent on age, education, income, and gender. However, due to the shortage in the strand of studies, little evidence is found at the national level. Akudugu (2013) employs data from 1,000 adults in Ghana and finds that 40% of respondents have been included in the formal financial sector. Demographic characteristics such as age, literacy, and income prove their significant role in determining financial inclusion. In addition, the author also explains that the distance from financial institutions, lack of information, lack of trust, and peer effects are the main reasons for financial exclusion in Ghana. Based on a micro-data survey conducted in Peru, Cámara and Tuesta (2014) believed that women, rural residents, and people at a young age have a lower likelihood to use products and services in financial markets. Hence, they are called more vulnerable groups of financial inclusion. In particular, the results pointed out that compared to saving products, loans and mortgages contribute substantially to the inclusiveness of the financial industry, and education plays a key role in this process. Furthermore, while households’ decisions on using financial services are also affected by regional differences, it is not a problem for firms. In China, Fungáčová and Weill (2015) used the 2012 Global Findex to investigate financial inclusion. Consistent with previous studies, the results support that richer, more educated, and older men have a higher level of financial inclusion. Besides, the difference in income and education also influences the decisions on taking part in formal or informal credit finance, while the discrimination prevents women from formal credit. Hence, they tend to use informal credit. For the poor and older individuals, lack of money and distance are common barriers to financial inclusion while cost and trust in the banking system are worries of more educated people. Religious reasons are also obstacles the old have to face.
Though mentioned research has significant contributions to determining the determinants of financial inclusion by exploring socioeconomic characteristics from the user side, the authors tend to use solely indicators instead of constructing a comprehensive indicator. In this paper, this gap would be fulfilled. To the best of our knowledge, this would be the first research on financial inclusion in Vietnam.
The Context of Financial Inclusion in Vietnam
Recently, Vietnam has gained remarkable socio-economic achievements and reached lower-middle income from a poor country. Together with this development, the financial industry in Vietnam also documented significant innovation. However, compared with other countries in ASEAN or lower-middle income, the financial inclusion rate is quite low. From data of The Global Findex Database and World Development Indicators, the authors create Figure 1 which shows the percentage of accounts in financial institutions of some countries in 2017.

Financial institution account of some countries in 2017.
In lower-middle income countries, the average percentage reaches about 60%, while this number in Vietnam is 30%. Compared to upper-middle income, more than 70% of people have accounts in financial institutions. Thailand has the highest proportion, at 81%, followed by Indonesia with 48%, while the account number in Cambodia is nearly 20%. In particular, the authors also analyze in more detail by comparing the proportion of financial institution accounts by indicators between Vietnam and lower-middle income countries in Figure 2. This graph exhibits a low percentage of having financial institution accounts in people who are less educated, the poorest, living in rural, or out of the workforce. Of all these groups, the numbers in lower-middle income countries are double and more than double compared to those in Vietnam. That demonstrates the gap of accessing the financial industry between Vietnam and other countries in the same group income is significant. Therefore, it is essential to increase financial inclusion level in Vietnam, especially for poor people, females and rural regions. This paper contributes to certain studies in determining financial inclusion in Vietnam to have a profound insight into this topic.
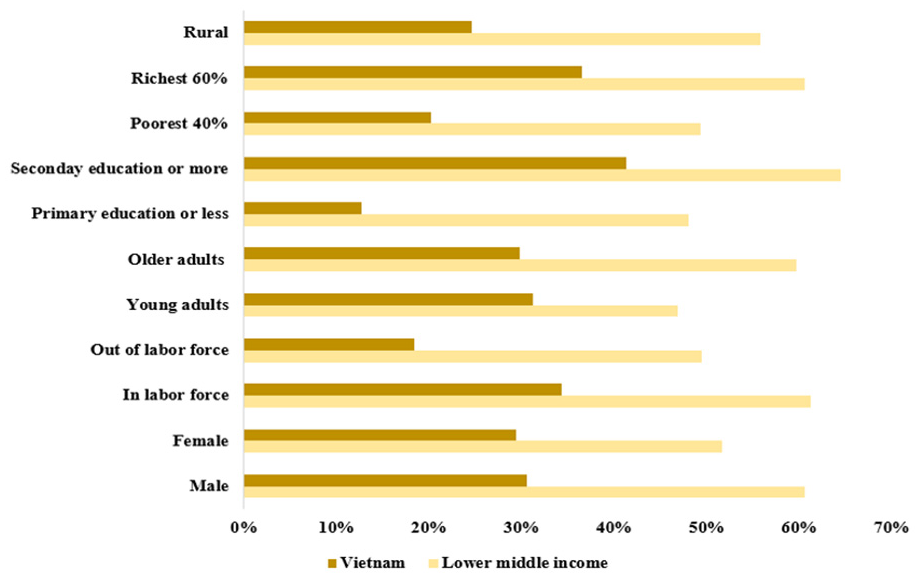
Differences in financial institution account between Vietnam and lower-middle income countries by individuals’ characteristics in 2017.
Methodology
Data Source
This paper employs cross-sectional data from the World Bank Global Findex Database with a selection of Vietnam’s data in 2017. Data were collected from face-to-face interviews with the respondents above 15 years old and randomly selected. The sample size includes 1,002 individuals from 52 provinces of Vietnam (World Bank, 2018b). Therein, the dataset records demographic characteristics of respondents, such as gender (Male/Female), age, and education attainment (Completion of primary or less/Secondary/Completion of tertiary or more). Income of individuals is divided into five income quintiles (Poorest/Second/Middle/Forth/Richest), while labor status is classified as out of the workforce and in the workforce.
Measurement of Financial Inclusion Index
As mentioned in the literature review, because a large body of research has investigated financial inclusion, its measurement is entirely different in several ways. Based on the determinants of financial inclusion in OECD/INFE (2016), financial inclusion in this paper is captured in the demand side of end consumers instead of the supply-side of the traditional perspective. In particular, a financial inclusion index for each individual is constructed based on two aspects: the financial products people hold and their active consumption of financial products. For the first one, holdings of financial products capture some branches: products related to saving or retirement; some forms of payment products such as debit cards and current accounts (this indicator does not include credit cards because it focuses on prepaid products); and credit products, for example, credit cards or mortgages. The second component of financial inclusion encompasses three indicators: the awareness of available financial products of consumers; whether individuals are making rational choices among financial products; and whether they have turned to their family or friends to help them in saving money or making ends meet. Each indicator is coded 1 if respondents have participated in or used these products and services. Otherwise, it is coded 0. Generally, the financial inclusion index is calculated by the sum of the six indicators mentioned above, resulting in a range of values from 0 (lowest financial inclusion) to 6 (highest financial inclusion). To perform econometric analysis, the financial inclusion index would be measured by a z-score value and by calculating the mean difference and the standard deviation as equation (1).

Empirical Research Model
The determinants of the financial inclusion of individual

The dependent variable in this model is the financial inclusion of individuals measured by
Besides, this model would be extended to observe different income groups intensively. Thus, the existing gap between gender and income in financial inclusion is also highlighted. Finally, this paper figures out barriers that prevent individuals from joining the financial inclusion process.
Results and Discussion
Descriptive Statistics
Table 1 exhibits the summary statistics for financial inclusion scores by different categories. Regarding demographic characteristics, the sample size of this paper is 1,002 respondents from 15 to 91 years old. The number of females joining this survey is 575, accounting for 57.4%. Hence, the difference in the size of gender is trivial. Half of the respondents have the education attainment of secondary level (50.5%), while the number of individuals who complete tertiary or higher is the smallest and stands for 14.4%. A total of 352 individuals complete the primary level or lower, about 35%. Regarding income quintiles, the richest group is dominant with 249 individuals, followed by the fourth quintile with 208 respondents, while the first three income quintile groups have approximately the same number of respondents. The number of respondents in the workforce comprises the vast majority of the survey, with 744 individuals compared with only 258 individuals out of the workforce. In terms of financial inclusion scores, the average value of 1,002 individuals reach 1.33 out of 6. This number reflects a low level of financial inclusion in Vietnam—a low-middle income country.
Financial Inclusion Scores by Different Categories.

Source. Authors’ calculation.
Determinants of Financial Inclusion
Table 2 clarifies the effect of individuals’ characteristics on the level of financial inclusion in Vietnam presented by the financial inclusion index. Generally, all of the characteristics in this model have a significant statistic and effect on the financial inclusion at a certain level. In particular, the coefficient of females is .105 and is significant at 10%. The figures illustrate that females tend to have higher financial inclusion index compared to males. In recent decades, the role of women in family and society has been documented. Their contribution to household income and economic activities has supported the reducing gender gap in Vietnam. Hence, accessing and using financial products and services are increasingly popular for women. Besides, women have higher scores probably because they have a chance to become the receivers of money transfer or remittance, and make transactions at financial institutions due to the domestic mobility or migration overseas of men (United Nations Capital Development Fund, 2006). The level of financial inclusion of women is also emphasized in a range of research of Allen et al. (2012), Akudugu (2013).
Determinants of Financial Inclusion Scores.

Source. Authors’ calculation
Note. All models refer to OLS regressions with robust standard errors.
p < .1. **p < .05. ***p < .01.
Obviously, education attainment is found to have a strong association with a higher likelihood of financial inclusion. Both dummy variables of secondary level and tertiary or higher are statistically significant at 1% and have a positive coefficient. Besides, the dimension of the tertiary or higher variable is .874, greater than the secondary level (.339), demonstrating that those who have higher education levels tend to use many products of financial markets and obtain higher scores in financial inclusion index. More generally, education and financial literacy are the key roles in determining financial inclusion. Adetunji and David-West (2019) and Lusardi and Tufano (2015) pointed out that higher literacy levels result in better use of services and products in the financial industry. Furthermore, financial knowledge could help to prevent the likelihood of being indebted. Thus, understanding how an individual’s educational attainment affects the level of financial inclusion could contribute to the construction of more sufficient macro policies.
Similarly, income is also an essential driver of inclusiveness in finance. Compared to the poorest quintile, the variables of other income quintiles exert a positive and significant effect on financial inclusion scores. The rising trend in the coefficient magnitude is also found along with the increase in income quintiles in descending order. This means the richest group has the highest likelihood of being financially included. That makes sense because their money could facilitate the usage of several products and services of financial markets, such as savings, payment accounts, credit products, and mobile banking. This finding is in line with the studies of Allen et al. (2016) and Fungáčová and Weill (2015). Employment status contributes to the determination of individual financial inclusion as an advantage factor. With a positive effect of 10% statistically significant, individuals in the workforce have a higher likelihood (coefficient .123) of being included in the financial industry compared to those who are not. This could be explained that paying salaries through a transfer system would spur employees to access and use banking transactions, thus increasing their financial inclusion scores. This statement is also supported by Allen et al. (2016) and Akudugu (2013). The age variable is found to have no significant effect on financial inclusion. However, the square of age has a negative effect. This nonlinear relationship points out that people tend to have higher inclusion as they reach a certain age. Because elderly people face some constraints such as physical health, retirement, and lack of demand, these restrictions prevent them from using financial products and services.
In order to capture the nonlinear relationship between age and financial inclusion level in detail, the authors classify the age of respondents into seven groups. Column 2 of Table 2 exhibits the extended estimation. In this step, the effect of gender, education level, income quintile, and labor force participation on financial inclusion remain unchanged. Regarding age group, the negative linkage is found in the group above 45 years old, while people who are 70 years old and over have the largest coefficient (.243) that is negative and statistically significant. As mentioned, this group is in the last station of human life, and they are affected by a range of reasons for excluding financial activities.
Income Difference and Financial Inclusion
The baseline result in the 4.2 part demonstrated the effect of income on determining financial inclusion. In order to clarify this distinction, the authors classify 1,002 respondents into two groups. The first one includes 457 observations in the fourth quintile and the richest called the high-income group. The second one is the middle- and low-income group including 545 observations who are in the poorest, second, and middle income. Then, the empirical model as equation 2 is examined separately for each group, generating results displayed in Table 3. The effect of gender is positive in both groups with a higher value for middle and low income. However, this linkage is not statistically significant. Education level also exhibits the difference between the two groups. Individuals who complete tertiary or higher have a stronger likelihood to use financial services and products, whereas the high-income group reaches a higher magnitude compared to lower-income. These connections are highly significant at 1% level. The most highlighted point in this part is presented when we compare the labor status of the two groups. While working is not the key driver of individuals in the high-income group, the financial inclusion of middle- and low-income people strongly depends on whether they are in the workforce or not. This finding should be interpreted that high-income people have an initial endowment which could facilitate them to be included in the financial industry, while inclusiveness of middle- and low-income groups is likely maintained together with their jobs. This difference contributes significantly to the design of sufficient policies for workers, aiming to increase the financial inclusion level of a country.
Financial Inclusion and Income.

Source. Authors’ calculation
Note. All models refer to OLS regressions with robust standard errors.
p < .1. **p < .05. ***p < .01.
Determinants of Barriers to Financial Inclusion
In this section, the authors aim to investigate individuals’ characteristics to explain their financial exclusion. Respondents have seven suggestions to answer why they do not have an account at a bank or other types of formal financial institutions. In terms of objective reasons, two aspects of the financial system are (1) financial institutions are too far away and (2) financial services are too expensive. From the passive factors, respondents do not have the necessary documentation (identity card and wage slip) or do not have enough money to use financial institutions. In the subjective explanation, individuals do not trust financial institutions, do not have demands for financial services at a formal institution, or someone else in the family already has an account. Besides, religious reasons are also captured. All questions are considered barriers to financial inclusion and coded as binary variables with a value of 1 for yes answer and 0 otherwise. Table 4 below indicates whether individuals’ characteristics constitute barriers to financial inclusion.
Determinants of Barriers to Financial Inclusion.

Source. Authors’ calculation.
Note. All models refer to OLS regressions with robust standard errors.
p < .1. **p < .05. ***p < .01.
Firstly, column 1 interprets the distance that leads to financial exclusion for females. This paper finds out the positive and statistical significance that too far financial institutions would not attract women to use financial services or products. Hence, spreading out bank branches or financial institutions could facilitate the participation in the financial industry of a growing number of people, especially females. Besides, when accessing financial markets, highly educated and high-income people are not affected by the distance. Regarding those in the workforce that belong to the second income quintile and complete secondary education, the negative relationship is also documented. However, it is not significant.
In terms of financial services fees, column 2 exhibits the positive coefficient of labor status and age square. Individuals who participate in the labor force and are older tend to avoid using financial products due to high service fees. Negative and statistical significance is found in education and all income levels, demonstrating that financial services fees do not affect the financial inclusion of middle- and high-income groups and highly educated people. In other words, they accept the service fees to receive other benefits from financial transactions. Lack of necessary documentation prevents the participation in the financial market of individuals in the workforce, while high-income people do not face this problem.
Interestingly, in column 4, believing in the financial system is a concern of middle-income and the wealthiest people due to the positive coefficient. Risk in the financial system prevents them from participating in the financial industry to protect their assets and information, while people completing tertiary or higher education do not consider risk a barrier to financial inclusion. Also, religious reasons in most demographic characteristics are not barriers to financial inclusion because there are no significant statistics for all variables. Whether people have enough money or not to participate in the financial industry results in a negative and significant coefficient for all education and income levels in column 5. That presents a great willingness of respondents to have an account and use financial products.
Column 6 describes the substitute effects of self-financial inclusion. That means when a family member has one account, people tend to share this account. The positive nexus is found for females. Hence, this cause is truly a barrier to financial inclusion for women. This result is in line with the richest people, while individuals in the labor force are willing to be included in the financial industry, though their family has another account already. Education attainment and age level do not influence the financial exclusion due to this reason.
Regarding the last barrier of lack of demand in column 7, gender, income, and age level do not determine their relationship with financial inclusion. Besides, people with higher education are less likely to be impacted by the demand factor, while working individuals lack demand for financial inclusion.
In general, this paper explored some highlights of the barriers to financial inclusion for specific objects. Women are less likely to be financially included because they complain that financial institutions are too far away or because another family member has an account. Besides, older people are more concerned about lack of documentation, lack of trust, and demand reasons. Individuals who are highly educated or in a high-income group have a high likelihood of joining the financial industry. Barriers such as distance, financial services fees, lack of trust, and religious reasons are not their concerns.
Robustness Check
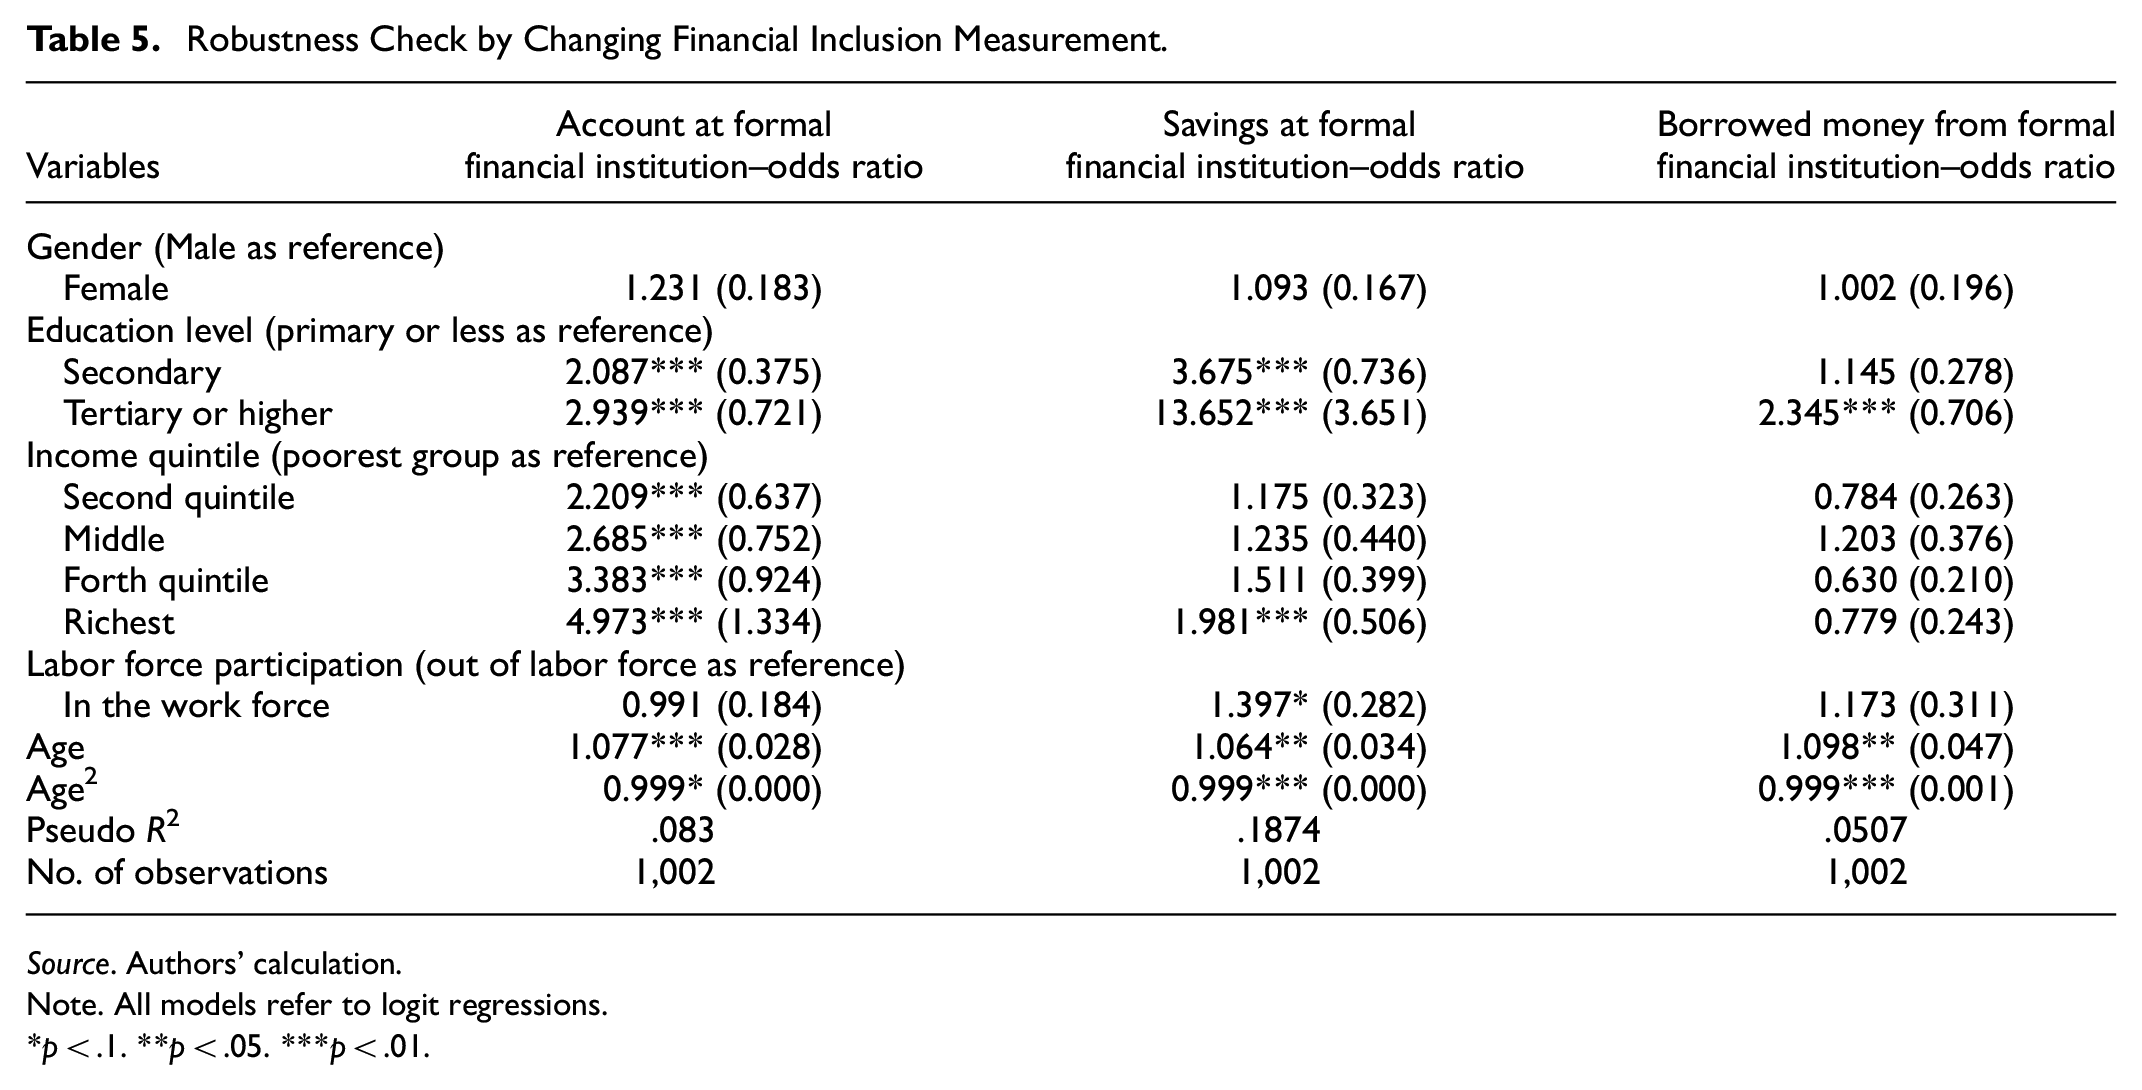
In this part, we conduct robustness checks to examine whether our main results are robust and stable by changing the measurement of financial inclusion. In line with Fungáčová and Weill (2015) and Demirgüc-Kunt and Klapper (2013), financial inclusion now would be gauged by three main indicators. The first indicator is possessing an account in a formal financial institution. The second indicator captures individuals’ savings in formal financial institutions, while the last one captures the usage of credit from formal financial institutions. Respondents are asked yes/no questions to collect information on whether they have an account, savings, and loans from formal financial institutions. Hence, we apply the logit regression method for three indicators as separate dependent variables and present the results in Table 5.
Robustness Check by Changing Financial Inclusion Measurement.
Source. Authors’ calculation.
Note. All models refer to logit regressions.
p < .1. **p < .05. ***p < .01.
Generally, compared to the baseline result in Table 2, we recognize similar findings that individuals’ age, education attainment, income level, and employment status significantly affect their financial inclusion. Meanwhile, females also exhibit their domination in financial inclusion more than males though there is no statistical significance. In particular, respondents who have higher education tend to be included in the financial system covering three aspects: having an account, depositing their savings, and leveraging loans at formal financial institutions. Besides, differentiation in income would decide individuals’ opening accounts and savings. There is an increasing trend in income level and financial inclusion where the richest people express the highest odd ratio. Individuals who participate in the workforce are associated with greater financial inclusion in savings at formal financial institutions. Age characteristics documented a slight difference in financial inclusion with older groups who tend to have accounts, more savings, and borrowing at formal financial institutions. However, the coefficient of Age2 exploits of the inverted U-sharp in this relation interpreted that when individuals get too old, they would be less included in the financial system than adults.
By checking the robustness, this research completely confirms the baseline results presented in section 4.2 above are statistically robust and stable. Instead of using the measurement of financial inclusion based on OECD/INFE (2016), we follow previous studies to have a reference in evaluating baseline findings. Though the results show minor changes in the coefficient, demographic characteristics relatively remain unchanged in their dimension and significant correlation with financial inclusion.
Conclusion
This research examines the determinants of financial inclusion in Vietnam. Different from previous studies which mainly focus on accessing financial institutions from suppliers’ side, this paper captures the financial inclusion in using financial services and products from the demand side. We employ a dataset from World Bank 2017 with 1,002 respondents in order to investigate how individuals’ characteristics impact their financial inclusion level. This paper measures financial inclusion based on OECD/INFE (2016) which summarizes comprehensively aspects of financial inclusion instead of using separate indicators by proxy. In particular, individuals’ financial inclusion score covers not only holding financial products such as saving, retirement, payment, and credit products but also awareness and choice of recent products of the financial industry. Additionally, the dependence on friends and family in financial transactions is captured in the measurement of financial inclusion. The main explanatory factors in regression estimation are gender, age, education attainment, income level, and workforce status. Ordinary least squares and logit regression is conducted to estimate the effect of individuals’ characteristics on their financial inclusion.
The results show that those who have higher education attain a high level of financial inclusion. Because the adoption and the usage of financial products and services in Vietnam are still low compared to other developing countries, it is necessary to establish policies on popularizing financial literacy through education. Besides, low-income people in this research are disadvantaged in capturing financial inclusion. Vietnam is classified as a lower-middle-income country, and the proportion of low-income and poor people is still high. Therefore, this finding gives policymakers the implication that poor and low-income people should have a chance to access and use financial services. The extension regression provides evidence that the financial inclusion of middle and low-income individuals depends on whether they participate in the labor force, while high-income and rich people do not. Hence, this finding exerts meaningful implication that the labor market is a vital channel. Thus, it could enhance financial inclusion levels for vulnerable people. In addition, revealing the fact that a low level of financial inclusion in the group of individuals with poor education, unemployment, low income, or old age in this research implies the importance of financial knowledge. These individuals should recognize their low level of financial inclusion by themselves or attend financial literacy courses to understand the crucial role of the financial sector in their life that could support their loans or safe savings, retirement, or transactions. Thus, this group could avoid self-exclusion in the financial system.
Additionally, this paper also analyses barriers to financial inclusion in order to have profound insight into active and passive reasons for financial exclusion. In general, the distance of financial institutions, insufficient financial services fees, and lack of trust are systematic problems that need long-term policies and improvement on the macro scale. In terms of lack of demand and substitute effects when a family member has an account, people should be enlightened about their perception and the benefits they will get in order to encourage individuals’ self-inclusiveness in the financial industry. Accordingly, the findings of this paper exhibit substantial implications for both policymakers and individuals in society as well. However, our study faces limitations on data. Available information in this dataset is just enough for the determinant financial inclusion in demographic characteristics. Analyzing at depth level requires more detailed questions that should be conducted in a general survey on a national scale. Besides, based on the findings of this paper, future works could develop analysis focusing on frequency and behavior aspects in financial inclusion.
Footnotes
Declaration of Conflicting Interests
The author(s) declared no potential conflicts of interest with respect to the research, authorship, and/or publication of this article.
Funding
The author(s) received no financial support for the research, authorship, and/or publication of this article.