
Abstract
This study examines the relationship between the intelligence and creativity scores of gifted and bright students according to the Threshold Theory.1155 students participated in the study. Students are at the secondary school level. There are seven different regions in Turkey. The sample consists of participants from the largest provinces of the regions. The Wisc-R intelligence test and Torrance Creative Thinking Test (TTCT) were used. Data were collected over a decade between 2012 and 2022. The obtained data were tested according to the Threshold Theory. The relationship between intelligence and creativity was studied based on different intelligence score ranges. A significant relationship was found between the intelligence and creativity scores of the bright students. It was determined that there is a positive and significant (r = .725, p < .001) correlation between intelligence and creativity scores of children (n = 432) with bright intelligence (120–129). In the findings obtained, no significant correlation was found between giftedness and creativity scores of the gifted and profoundly gifted students. No significant correlation was found between intelligence and creativity scores (r = .051, p > .05) of gifted children (n = 581). No significant correlation was found between intelligence and creativity scores (r = .062, p > .05) of children (n = 142) with profoundly gifted intelligence (146–160). The result of this study confirmed the Threshold Theory.
Introduction
Gifted and bright individuals have shape the society they belong to. Both are individuals who are rare and difficult to understand in a society. Studies on them is of great interest due to these features (Rindermann & Neubauer, 2001). First concept is mostly based on the cognitive intelligence score. In the process, skill areas started to be more important than the intelligence score (Clark, 2002). In new approaches, it is expressed as high-level performance that emerges in more than one area, such as creativity (Gagne, 2000, 2004, 2005; Heller et al., 2005; Karolyi et al., 2003; J. R. Renzulli, 2004; R. J. Sternberg, 2005). Many researchers think that giftedness consists of three rings of interacting traits. These are general and special ability levels, creativity, motivation and etc. clusters. Koshy (2001) expresses giftedness with features such as leadership, high intelligence, artistic ability, physical ability, mechanical ability, and creativity. Winner (1996) defines giftedness as having a talent in a certain field, having high creative features, and being responsible for certain tasks. In the Maryland Report (1972), multiple fields were defined in general mental, specific academic, creativity, leadership, art, and psychomotor fields. It is observed in many definitions that creativity is considered a component of the concept of giftedness. Creativity and giftedness are concepts that are always mentioned together.
Creativity is included in the definitions of gifted and brilliant. There are many definitions for both. J. S. Renzulli (1986) thinks that giftedness consists of three rings of interacting traits. These are general and special ability levels, creativity, and motivation clusters. Educators consider different types of intelligence as giftedness (Davis & Rimm, 1998). According to Feldhusen and Kolloff (1986), among many definitions, giftedness is the combination of special talent, general skill, self-concept, and motivation. Maker (2003) states that the basic components of giftedness are interests, desires, and complex problem-solving abilities. Clark (2002) defines gifted people as those who are able to do things that are difficult to achieve due to their extraordinary potential. Tannenbaum (2003) expresses gifted as those who produce exemplary works in different fields and apply them very well. However, bright children are those who show exceptional intellectual abilities (R. J. Sternberg, 2022). Although bright children are partly similar to gifted children, they differ from gifted children in many ways (Kaya, 2020). This could mean that a child is able to think, reason and remember information at an advanced level for their age, or that they can solve difficult problems quickly and efficiently (Louis & Lewis, 1992). Bright children may also have excellent reading comprehension skills, quick mental math capabilities and a broad knowledge base across many topics. They may be highly curious about the world around them, ask complex questions and develop deep interests in particular areas of study (Roedell, 1989).
The subject of giftedness and creativity has been studied by many researchers over the years. Intelligence and creativity have always been two important concepts for humanity. Although studies have examined the relationship between the two concepts, this relationship has not been clearly demonstrated. In general, there are many definitions. Creativity is a different skill that cannot be measured with intelligence tests (Kim et al., 2010). Creativity is the flexibility to change views on problems, originality, and the capacity to redefine reality (Rouquette, 2007). Different perspectives have increased with Guilford’s (1967) definition of creativity. He introduced concepts such as fluency, flexibility, divergent thinking, and convergent thinking to produce original thoughts. Creative individuals are those who express unusual thoughts in unconventional ways (Starko, 2005). The individual’s extraordinary thinking is important in the emergence of creativity. According to Torrance (1998), who makes the broadest definition, creativity is detecting problems and missing elements, making predictions about them, and forming hypotheses. Testing these hypotheses is comparing results and changing and retesting hypotheses. When all definitions are examined, it is possible to see that there are connections with intelligence. In this sense, examining the relationship between intelligence and creativity is beneficial.
Intelligence and Creativity Relationship & Threshold Theory
The relationship between intelligence and creativity has been a subject of study for researchers (Batey & Furnham, 2006). When the relationship between intelligence and creativity is examined, it is seen that there are either positive or negative relationships. In general, there are four different situations: (1) Both are the same thing (2) Both are different things (3) One is a sub-dimension of the other (4) They are independent of each other, with overlapping areas (R. J. Sternberg & O’Hara, 1999). There are different relationships between intelligence and creativity (Batey & Furnham, 2006; Kim et al., 2010; Sak & Oz, 2010). It was observed that there is a high correlation between creativity and intelligence (Batey et al., 2010; Jauk et al., 2014). Many models and theories support this relationship. Creativity is one of the predictive variables in the Munich Model of Giftedness (Heller et al., 2005). R. J. Sternberg and Lubart (1991) regard intelligence as an effective variable in the emergence of creativity in their theory. Creativity is necessary for the definition of a giftedness (Simonton, 2000) and creativity is a subcomponent of it (R. J. Sternberg, 1985). In Successful Intelligence Theory, an independent intelligence dimension is mentioned as an area of creative intelligence (R. J. Sternberg, 1984, 2003a, 2005). Sternberg and Lubart (1991) consider intelligence as a sub-dimension of creativity. Creativity consists of six different sub-dimensions: intelligence, knowledge, thinking style, personality, motivation, and environment.
Creativity is the process of generating novel and useful ideas (R. J. Sternberg, 2012). It is a cognitive process that requires individuals to transcend existing knowledge and develop new ideas in order to solve problems and identify opportunities (R. J. Sternberg, 2012). As such, creativity is an essential component of innovation and economic growth. Threshold theory proposes that creativity is the result of a threshold-crossing process in which an individual must overcome certain barriers in order to generate new ideas (Hennessey & Amabile, 2010).
The first thought that comes to mind is that there is a strong relationship between these two concepts (Christensen et al., 2017; Karwowski & Gralewski, 2013). Contrary to popular belief, the relationship between creativity and intelligence disappears, especially at high intelligence levels. This situation can be explained by the threshold theory. Threshold Theory: The basic idea of the threshold hypothesis means that high creativity requires high intelligence or above-average intelligence. Above-average intelligence is considered to form a necessary but insufficient condition for high creativity (Guilford, 1967). Threshold Theory provides a framework for understanding the relationship between creativity and intelligence (Jauk et al., 2013). This theory posits that creativity is a function of intelligence and that the two can be related to one another. Furthermore, this theory suggests that creativity is related to a certain threshold of intelligence that must be met in order to be considered creative (Karwowski & Gralewski, 2013). The threshold theory of creativity suggests that a certain level of intelligence must be reached in order to be considered creative. This threshold is determined by the complexity of the task at hand and the amount of creativity needed to solve it (Sligh et al., 2005). Furthermore, when this threshold is met, the individual is considered creative and is able to make creative contributions to the task at hand (Shi et al., 2017). In addition to intelligence, the threshold theory of creativity also suggests that other factors such as motivation, personality, and experience can play a role in determining the level of creativity achieved.
Threshold is developed to explain the relationship between creativity and intelligence. In theory, an individual should have at least a moderate threshold value to be able to show creativity (Runco & Albert, 1986). According to the Threshold Theory, a certain level of intelligence is needed for creativity. As the intelligence level of individuals increases, their creativity does not increase. While there is a high correlation between creativity and intelligence 120 IQ score, there is a low correlation above it (Child & Croucher, 1977; Getzels & Jackson, 1962; Shaw & DeMers, 1986; Torrance, 1962). People with very high IQs may have low creativity tests, while people with slightly above average intelligence can do very well on creativity tests. The result is that creativity is independent of high intelligence (Kim et al., 2010).
In Turkey, there is a limited number of studies examining the relationship between intelligence and creativity. Bıçakcı and Baloğlu (2018) have conducted a research. This study work led to more research. Yılmaz et al. (2020) examined intelligence and creativity according to the threshold theory. They conducted the study with 492 students aged 5 to 7 years. They used segmented regression analysis to test the threshold theory. As a result of the research, a low level relationship was found between intelligence and creativity. Şahin (2014) examined Threshold Theory in his study, in which intelligence and creativity tests were administered to 330 students in Istanbul. The students were at primary school level. At the end of the research, a high level of significant correlation was found with IQ 120. There is no significant correlation at the level of gifted and profoundlygifted. Research results prove the threshold theory. Kahveci and Akgul (2019) investigated the relationship between intelligence and mathematical creativity. It was conducted with 176 students from 11 gifted schools. All of the children were at the middle school level. Mathematical creativity skills differ significantly in gifted students. As remarked earlier, there are not many studies in Turkey. The existing studies were conducted in a single province with a small sample. In general, primary school level samples were selected. Data were collected in a short time. With this study, all these limitations were eliminated.
Different results are reached when the Threshold Theory studies are examined. There is no comprehensive study obtained from all regions in Turkey. This study is important in terms of examining the relationship between creativity and intelligence of gifted students in a large sample in Turkey over a long period of time. There are not many studies supporting the Threshold theory in Turkey. The results of this study are of great importance. It is important in terms of the age range of the research group. There is almost no study with a large sample at the secondary school level. The sample was selected from Turkish Statistical Institute (TUIK) data. This generalizes the population in the best way. This general framework aims to determine the relationship between the creativity and intelligence levels of gifted and bright students. For this purpose, answers to the following questions were sought:
(1) Is there a significant correlation between gifted and bright students’ intelligence and creativity scores?
(2) Do the data obtained coincide with the Threshold Theory?
(3) Do creativity scores predict depending on different intelligence scores?
Method
The research is in relational research design, which is one of the quantitative research methods. The relational research design aims at the degree of variation between two or more variables. Relational research tries to determine to what extent some relationship types or types exist (Fraenkel & Wallen, 2009).
Study Group
The study was carried out with1155 students between 2012 and 2022. Students were between the ages of 11 and 13. Gifted and bright students at the secondary school level in seven regions of Turkey participated in the study. Students were selected from Istanbul, Ankara, Izmir, Antalya, Gaziantep, Erzurum, and Ordu, the largest provinces of the seven regions. The distribution by provinces (TUIK, 2022) is 48%, 17%, 13%, 10%, 8%, 2%, and 2%, respectively. The largest provinces of the regions are representative of the population. Students were selected by purposive sampling. Method, research design, type of analysis, homogeneity, time and cost strategies in determining sample size. Students are those who participate in the UX program. Program accepts only bright and gifted students from institutions such as gifted centers (Bilsem etc). WISC-R test were accepted for admission of children to programs. Experts certified for the Torrance Test of Creative Thinking (TTCT) performed the applications and scoring of the test. 682 (59%) of the students are male, and 473 (41%) are female students.
Data Collection Tools
Wechsler Intelligence Scale for Children Enhanced Form (WISC-R)
The WISC-R, which is the 1974 revised version of the Wechsler Intelligence Scale for Children (WISC), consists of two parts, verbal and performance. Each section includes a total of 6 sub-tests. The standardization of WISC-R was carried out by Savaşır and Şahin (1995) on a sample of 1639 people in the 6-16 age group. In the WISC-R test, 100 points represent the average intelligence level. The standard deviation is 15. The split-half reliability of the test was found to be .97 for the verbal section, .93 for the performance section, and .97 for the total score. Correlation values between sub-tests ranged from .51 to .86. The Cronbach-α internal consistency coefficient was calculated as .80. According to this result, it was concluded that the test would give reliable results.
Torrance Test of Creative Thinking (TTCT)
Torrance Test of Creative Thinking (TTCT) is one of the most popular tools used to measure creative thinking (Kim et al., 2006; Runco & Acar, 2012). The test consists of formal and verbal forms. Each has A and B forms. These forms can be used interchangeably. Test items are about an individual listing possible answers for unusual use of a product. The first studies were at the University of Minnesota between 1958 and 1966. Two test batteries, verbal and formal, were developed in 1966 (Torrance, 1967). In this form, there are seven sub-tests in the verbal part and three sub-tests in the formal part, with total of 10 sub-tests. In 1984, the standard score and norm table was added, and it became the last updated version (Torrance & Ball, 1984). The norm-based criteria introduced for formal form in 1984 were: fluency, originality, the abstractness of titles, resistance to closure, and criteria-based criteria. The criteria-based measures are emotional expression, storytelling, movement, expressiveness of titles, synthesis of undefined shapes, synthesis of lines, unconventional visualization, internal visualization, stretching boundaries, humor, the enrichment of imagination, color of imagination, and fantasy. The formal form has three sub-tests: picture creation, picture completion, and circles. There are seven verbal sub-tests: asking, estimating causes, estimating results, product development, unusual use, unusual questions, and assumptions (Cramond et al., 2005).
Data Analysis
In the analysis of the data, arithmetic mean, and standard deviation were calculated. Pearson product-moment correlation coefficient (r) was used in relational founded. Standardized regression coefficient (β) was used in the predictive analyses.
Findings
The first studies that accepted a criterion such as 120 IQ points as the threshold value lack empirical evidence (Jauk et al., 2013). In studies conducted since then, a 120 IQ score has been followed as a threshold value. The correlation between WISC-R and TTCT was examined, and then the correlation between intelligence and creativity scores of children who were above and below 120 IQ points according to the Threshold Theory was examined. Pearson Product Moment Correlation analysis was performed to determine the correlation between WISC-R and TTCT scores, and the results are shown in Table 1. Students were classified according to their intelligence level. They are classified as 120 to 129, 130 to 145, and 146-over. Since the standard deviation of intelligence distribution is 15, WISC-R scores were divided into 15-point slices, and analyses were made according to these slices.
Students’ Intelligence and Creativity Scores Table.

For the mean of the scores of the students, the intelligence and the arithmetic mean and standard deviation of the TTCT total scores, the average intelligence score of the students in the range of bright intelligence (including students over 120 in the range of 120–129) was found as X = 124.22 ± 2.46 creativity score averages X = 86.85 ± 8.34. The average intelligence score of students in the giftedness range (130–145) was found as X = 139.05 ± 4.07, creativity score average of X = 44.66 ± 24.60. The aforementioned intelligence score averages of the students in the profoundly gifted (146–160) range were found as X = 152.46 ± 4.13, and the creativity score averages were X = 45.00 ± 22.92.
The observed ranges of TTCT are given. Bright is in the range of 55 to 99, gifted 9 to 97 and profoundly gifted 9 to 92. The range is small for bright. The ranges for gifted and profoundly gifted are very large. This is seen in the scatter plots in Figures 1 to 3. This scattering allows us to perform predictive analysis.
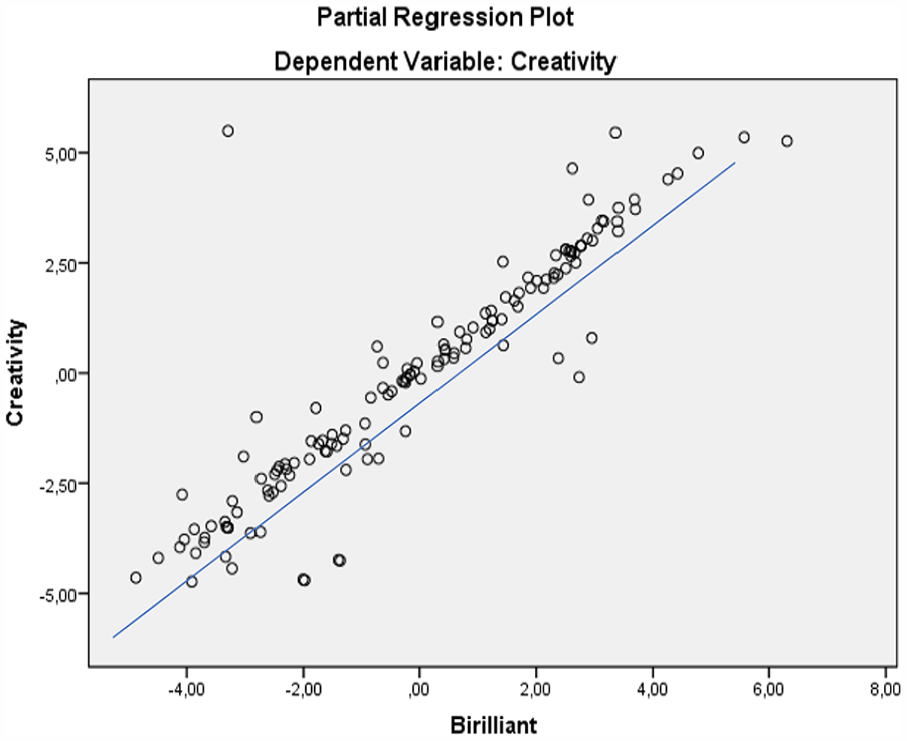
Creativity and bright regression analysis chart.

Creativity and gifted regression analysis chart.

Creativity and profoundly gifted regression analysis chart.
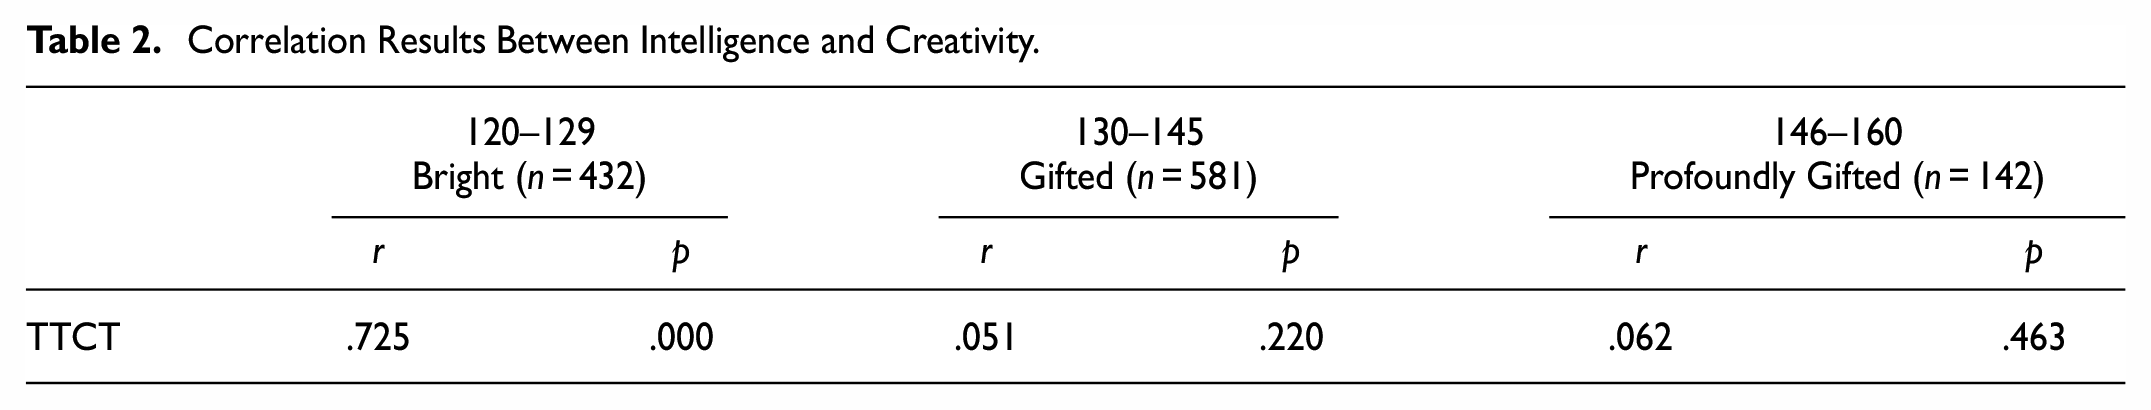
In Table 2, Pearson Product Moment Correlation analysis was applied to determine the relationship between the WISC-R test and TTCT test scores. It was determined that there is a positive and significant (r = .725, p < .001) relationship between intelligence and creativity scores of children (n = 432) with bright intelligence (120–129). No significant correlation was found between intelligence and creativity scores (r = .051, p > .05) of gifted children (n = 581). No significant correlation was found between intelligence and creativity scores (r = .062, p > .05) of children (n = 142) with profoundly gifted intelligence (146–160).
Correlation Results Between Intelligence and Creativity.
The research problem was supported by predictive analysis. The first thought that comes to mind is that there is a strong relationship between these two concepts. Contrary to popular belief, the relationship between creativity and intelligence disappears, especially at high intelligence levels. Prediction analysis was conducted to test the idea that creativity increases as intelligence increases. Predictive analysis is a type of data analysis that uses existing data to make predictions about future outcomes. In research, predictive analysis can be used to identify patterns in data that can be used to inform decisions and make predictions about future outcomes. Predictive analysis can be used to identify trends in a dataset that can be used to predict future creativity trends or to identify potential customers. The assumptions of the threshold theory were tested with regression analysis. 120 IQ predicts a high relationship as seen in graph 1. This is not seen in graphs 2 and 3. As a matter of fact, there is no significant correlation between high IQ and intelligence in the results. Graph 1 is a linear graph while 2 and 3 are not.
The results of the regression analysis regarding the prediction of creativity according to the bright, gifted, and profoundly gifted variables are given in Table 3. There is a moderate level of correlation (r = .379 p < .001) for bright intelligence between the predictor variables and the dependent variable. No significant correlation (r = .025 p > .05) was found between giftedness and creativity. No significant correlation (r = .038 p > .05) was found between profound giftedness and creativity. According to the standardized regression coefficient (β), the order of importance of the predictor variables on creativity is listed as bright, gifted, and profoundly gifted. According to the regression analysis, it is seen that only the level of bright intelligence is an important predictor. The variables of giftedness and profound giftedness do not have an effect.
Regression Analysis on the Prediction of Creativity.

The scatter diagrams of the standardized predicted values for the analyses were examined. Diagrams are given in Figures 1 to 3. Relationship levels are explained according to the scattering of the points.
As seen in the figures, the scattering is linear in Figure 1. However, in Figures 2 and 3, it is not linear but horizontal. Figure 1 shows a linear and positive relationship between bright intelligence and creativity. A non-linear graph is shown in Figures 2 and 3, which shows that there is no relationship. Figures 2 and 3 show that the point scattering goes to more extremes and moves away linearly. By looking at all the predictive analyses and graphical results, it is seen that the data supported by the Threshold Theory have been reached. While intelligence and creativity show a high correlation, around 120 IQ, it is seen that the relationship disappears as the intelligence score increases.
Discussion
The study examined the relationship between general intelligence scores and creativity scores. While examining the relationship, the levels of bright intelligence, giftedness, and profound giftedness were handled separately. While there was a relationship between intelligence and creativity at the bright intelligence level, this relationship was not found at other levels. The obtained data support the Threshold Theory. Similar results were also found in Turkey. There are studies showing significant correlation. Şahin (2014) study, threshold theory was examined. intelligence and creativity tests were administered to 330 students in Istanbul. the students were at primary school level. at the end of the research, a high level of significant correlation was found with IQ 120. There is no significant correlation at the level of superior intelligence. research results prove the threshold theory. Kahveci and Akgul (2019) investigated the relationship between intelligence and methematical creativity. It was conducted with 176 students from 11 gifted schools. All of the children were at the middle school level. mathematical creativity skills differ significantly in gifted students. Ferrando et al. (2016), conducted research on threshold theory. the relationship between intelligence and creativity was investigated in the research. Three hundred eighty-five primary and secondary school students were sampled. In the research, intelligence scores were divided into three classes as low, medium and high. High level significant differences were found in the research results. When the creativity of individuals with different intelligence levels is examined, it is seen that each individual has a more or less common ability (Batey & Furnham, 2006; Feldhusen & Goh, 1995; Furnham & Bachtiar, 2008). Also, Torrance (1975) found a moderate relationship between creativity and intelligence. Intelligence is required to show creativity (R. Sternberg, 2000). Arslan (2001) studied the relationship between creativity and intelligence and found a relationship in the dimensions of general knowledge and number repetition. Cho et al.’s (2010) study reached conclusions that support the theory. In the study, a moderately (r = .40) significant relationship was found between the intelligence and creativity scores of individuals with average intelligence. In another study, the results supporting the Threshold Theory were obtained from the data of the bright and gifted (Barron & Harrington, 1981). Hayes (1989) stated that creativity and intelligence are not fundamentally related, but intelligence may be required to show creativity.
There are also results that do not support the Threshold Theory; Yılmaz et al. (2020) examined intelligence and creativity according to the threshold theory. They conducted the study with 492 students aged 5 to 7 years. They used segmented regression analysis to test the threshold theory. As a result of the research, a low level relationship was found between intelligence and creativity. Weiss et al. (2020), investigated the threshold theory. They examined it with scatter plots, segmented regression analysis and structural equation models. As a result of the research, they found no evidence of the threshold theory. Runco and Albert (1986) revealed that there is no significant correlation between intelligence and divergent thinking, which is the basis of creative thinking, according to four different intelligence levels (98–120, 121–130, 131–145, 146–165). In another study, students with an IQ above 120 and students with lower scores were compared, and no significant correlation was found between the intelligence levels and creativity scores of all participants (Kim, 2005; Preckel et al., 2006; Runco & Albert, 1986). Herr et al. (1965), Cropley (1968), and Simonton (1994) found that the correlation between creativity and intelligence is weak. Haensly and Reynolds (1989) state that there is a limited relationship between intelligence and creativity. Wallach and Kogan (1965) examined the relationship between intelligence and creativity. They found the mean of correlation as r = .10. Hamivand (2012), in his study, found a low level (r = .26) significant relationship between the intelligence and creativity scores of gifted students. Virgolim (2005), in his study, found a low level of (r = .21) significant relationship between the intelligence and creativity scores of gifted students. In his study, Kim (2005) found the relationship between creativity and intelligence almost non-existent. Fox (1981) reviewed 14 studies examining the relationship between intelligence and creativity with children aged 6 to 13 and concluded that the relationship between creativity and intelligence was minimal. Tannenbaum (1983) emphasized that the relationship between intelligence and creativity is close to zero and positive. Intelligence and creativity have been studied by many researchers, and similar results have been reached. Many studies have shown that there is a weak and moderate relationship between these two structures (Getzels & Jackson, 1962; Guilford, 1967; Runco & Albert, 1986; Torrance, 1962; Yamamoto, 1964). Intelligence and creativity are independent (Guilford, 1950; R. J. Sternberg, 2003b; Torrance, 1975; Wallach & Kogan, 1965). They argue that it is not correct to make inferences about the relationship between intelligence and creativity (Daniel, 1997; Hocevar & Bachelor, 1989; Starko, 1995). The results of the study by Cropley (1968) revealed that intelligence and creativity are basically independent concepts. They seem to agree that creativity and intelligence are basically unrelated abilities (Batey & Furnham, 2006; Runco, 2007; Sawyer, 2006; Weisberg, 2006). In the study of Yamamoto (1964), no difference was found between high intelligence and high creativity. Kim (2005) examined students with an IQ score of 120 and above in his study. In the study in which the bright and gifted students were grouped among themselves, no results were obtained that support the threshold theory between intelligence scores and creativity scores. Furnham and Bachtiar’s (2008) study found a non-significant relationship (r = −.02) between creativity and intelligence scores. Silvia (2008) determined in a study that general intelligence (abstraction ability) explains 18.40% of creativity. In the study of Cramond et al. (2005), it was determined that intelligence could explain 8.50% of creative success.
Conclusion
The research conclusions confirm the threshold theory. While there was a relationship between intelligence and creativity at the bright intelligence level, this relationship was not found at other levels. There is a belief that the creativity of gifted individuals will be high and individuals with normal intelligence will be low. Pearson Product Moment Correlation analysis was applied to determine the relationship between intelligence and creativity test scores. It was determined that there is a positive and significant (r = .935, p < .001, R = .87) correlation between intelligence and creativity scores of children (n = 382) with brilliant intelligence (116–129). No significant correlation was found between intelligence and creativity scores (r = .051, p > .05, R = .26) of gifted children (n = 581). No significant correlation was found between intelligence and creativity scores (r = .062, p > .05, R = .38) of children (n = 142) with profoundly gifted intelligence (146–160). The conclusions are generalizable for the country. The research was conducted over a long period of time with a large sample. It shows that work was spent in terms of time and cost. The conclusions obtained are evidence for future research.
However, this study has several limitations. The research can also be conducted in different age groups. It is especially necessary to conduct a research at the primary school age level. Samples were selected from different provinces to be generalized to the population. This sample selection should be increased by selecting more samples from different provinces. Policies should be developed across the country to identify students who are gifted and creative. Financial opportunities should be provided to increase the number and quality of research.
Footnotes
Declaration of Conflicting Interests
The author declared no potential conflicts of interest with respect to the research, authorship, and/or publication of this article.
Funding
The author received no financial support for the research, authorship, and/or publication of this article.