
Abstract
Many dimensional models of organizational cultures were developed decades ago, thus, in very different contexts. The world has become more complex, and such complexity can be identified in many aspects of everyday life, including working spheres. The objective of the study is to identify the changes in the perception of the complexity of characteristics of organizational cultures. Research is based on the Nine Factors Methodology aimed at the analysis of the motivational potential of organizational cultures and, based on the results, the analysis of the differences between/among selected subcultures. In the study, bivariant correlation analysis and factorial analysis with PCA extraction are used. The results show that the number of factors (dimensions) has lowered through the decades. While in 1999, nine factors of organizational culture were used to characterize it, in 2007, there were seven factors, and in 2017, only four factors which assumably led to the increase in their complexity. Even though the importance of existing dimensional models cannot be underestimated at present, the study indicates that the complexity of organizations and their organizational cultures results in more complex and interconnected individual dimensions than suggested initially. According to the study, when analyzing organizational cultures, a wider context must be considered, including relations between and among their dimensions because atomizing culture into individual dimensions provides an incomplete picture of the culture in question. At the same time, it is necessary to look at the organizations as heterogeneous units, which include several possible subcultures.
Keywords
Introduction and Theoretical Background
The world has undergone enormous changes in the last two decades. The advent of the internet, smart devices, social networks, or artificial intelligence can be perceived at the level of development of advanced information technologies (Celik, 2023; Roe et al., 2022; Sanasi et al., 2022). Terrorist attacks, war conflicts, global crises, natural disasters, or pandemics can be perceived at the level of human society (Almansour, 2022; Bossman & Gubareva, 2023; Madzík et al., 2023). Global trade, multinational corporations, virtual teams, diversity, or working from home can be perceived at the level of organizations (Gibson et al., 2023; Greimel et al., 2023; Poláková et al., 2023). All these events influenced the whole world, which has become unbelievably interconnected by several mutually dependent systems. We also include organizations and their cultures among such systems because they act as open systems linked to their environment. At the same time, employees create other subsystems inside the organization, namely subcultures. In the context of these enormous changes, many questions about culture and organizations arise that beg for answers. For example, is it possible to characterize such a complex phenomenon as culture only by selecting specific cultural dimensions (RQ1)? Can the organization be perceived as a homogeneous whole that can be characterized by a limited number of cultural dimensions (RQ2)? Using the Nine Factors Methodology, we will answer the mentioned research questions by characterizing the selected organizational culture. We will analyze the factors characterizing organizational culture in different periods (RQ1) and identify potential organizational subcultures through them (RQ2).
The researchers have been focusing on organizations as complex systems for several decades (Arévaloa & Espinosa, 2015), which requires studies of such an abstract phenomenon as cultures (Brown, 1998). Theorists and practitioners have been motivated to study organizational cultures for various reasons. Initially, it was the success of some economies and their organizations (e.g., Ouchi, 1981; Pascale & Athos, 1981). The initial endeavor stemmed from the naive assumption that if an organizational culture backing the organization’s success can be identified, it will be possible to implement it in any other organization with the same result—success.
The research endeavors result in numerous approaches applied in characterizing cultures, including the models representing combinations of various cultural dimensions. Cultural dimensions were identified and defined for various problem areas faced by the communities in their everyday struggles (Hofstede et al., 2010). Every cultural dimension can be placed on the continuum between minimum and maximum importance. This culturally biased way of perceiving the world by understanding the comprehensive phenomena is based on dividing it into smaller units (Hampden Turner & Trompennars, 1994). Such an approach constitutes the basis for the endeavor to characterize an organizational culture by decomposing it into individual specific areas, traditionally called cultural dimensions as mentioned (Kluckholn & Strodtbeck, 1961; Maznevski et al., 2002), but also cultural patterns (Stewart, 1971), cultural differentiation (Argyle, 1986), and patterns of variables (Parsons, 1951).
For instance, Schein (2016) claims six cultural dimensions. Robbins and Coulter (2021) introduce the example of seven such dimensions claiming that they are sufficient for depicting the complete picture of the culture of a particular organization (Chatman & Jehn, 1994; O’Reilly et al., 1991). Cartwright (1999) also designed a methodology based on cultural dimensions. However, he called them factors and interlinked them with motivation as an essential determinant of organizations’ overall efficiency and efficacy (Sokro, 2012). Cartwright’s nine factors (dimensions) account for psychological characteristics of organizational culture that function as motivational factors and are essential to be fulfilled to have motivated employees. Namely identification (identification with the organization and its goal), equity (balance between expectations and reality), equality (the respect of individuality of all members), consensus (mutual understanding), instrumentality (expectations that particular behavior will lead to specific outcomes), rationality (systematic approach to solving problems), development (growth of employees), group dynamics (synergic effect of cooperation), and internalization (identification with norms and ideas).
Even though the above-mentioned cultural dimensions can also be found in the current publications of the authors (e.g., Schein, 2016) and are used in numerous today’s studies (e.g., Schöbel et al., 2017), they were first published many years ago (e.g., Schein, 1985). Most dimensional models were developed decades ago and thus under vastly different market, social, and societal conditions. At present, we are not on the threshold of the Industry 4.0 scene. We have already stepped in. It has the potential for progress unseen within the preceding three ones (Xu et al., 2018). The environment in its nature has become endlessly interconnected, and its complexity influences many spheres of people’s daily lives. This also finds its expression in research activities, for instance, in the context of innovations (Demircioglu & Audretsch, 2020) or product ranges (Nguyen et al., 2020). If such essential changes exist on a global scale as well as materialize in everyday lives and research, it is time to return to the original question and try to answer it: can culture be characterized and understood based on a limited number of cultural dimensions considered as sufficient grounds of the perception of such a complex phenomenon as culture is, and, can a culture be dealt with as a homogeneous whole?
Manifestations of differences among and between various social groups have been identified for a long time. On the one hand, these groups hold common values. On the other hand, the smaller groups differ from one another in specific characteristics. Such an analogy can be used in many contexts as well, one of them can include organizations. They are not necessarily homogeneous, and various groups of employees can constitute subcultures as well (Mumford et al., 2008). Most organizations are not homogeneous; their cultures are not monocultures, but they are heterogeneous, comprising one or more subcultures. At the same time, an individual (employee) in an organization is part of the overall organizational culture and one or more subcultures.
Trice and Beyer (1993) argue that subcultures are holders of the identical elements as the umbrelling culture, that is, they identify with the systems of artefacts, values, and assumptions (Keyton, 2011). The impact of subcultures on organizations has been the focus of numerous surveys. For instance, in their paper Abane and Phinaitrup (2020) describe the impact of subcultures on employee performance. Barker et al. (2014) widely deal with the general influence of subcultures and confirm their impact. Identically with the umbrelling organizational culture, subcultures have an essential impact on the functioning of the whole organization, but also on the behavior of its members. Black (2003) argues that subcultures can be categorized into, for instance, occupational subcultures and departmental subcultures. Daft (2015) presented an example of an organization with the subculture of the production department and one of the research department. Copuš et al. (2019) aim their research at the subcultures of production and non-production (support) employees. If subcultures are to be identified through the prism of Hofstede’s (2010) levels of culture, subcultures emerge around gender, social stratification, national, regional, ethnic, religious, language, generational, and organizational groupings. If it is possible to identify subcultures in large social groups where organizations belong as well, using so many various characteristics, it is time to return to the original question if it is possible to characterize organizational cultures as homogeneous wholes using a limited number of cultural dimensions. The answers offer an advantageous opportunity to enrich theoretical models of organizational cultures, including subcultures and contribute to the practical initiatives in organizations.
This study aims to identify the changes in the perception of the complexity of the organizational culture of a particular organization applying the Nine Factor Methodology and, based on the findings, to analyze differences between/among its identified subcultures.
Methodology
Data from a survey were processed to achieve the aim of this study. The survey is based on Cartwright’s (1999) Nine Factors Methodology. The methodology covers nine motivational factors used to identify an organizational culture in terms of its motivational potential: Identification, Equity, Equality, Consensus, Instrumentality, Rationality, Development, Group dynamics, and Internalization (Table 1). Cartwright’s methodology is unique because it provides one research tool for measuring two phenomena—motivation and culture. This can be seen as its advantage over other models, in which one research tool measures culture and another measures motivation. Then, it is necessary to interlink them. In the case of Cartwright’s methodology, an organization’s culture is measured indirectly by its effect on motivation and motivation is subsequently measured by its effect on the activation of human behavior. However, this can be considered a limitation and disadvantage of this methodology since culture and motivation cannot be analyzed separately. The results obtained by this methodology thus, on the one hand, bring a comprehensive view of organizational culture, but on the other hand, only from the limited point of view of motivation and not from the point of view of other important aspects of people’s behavior in organizations, which can not be separately linked to the characteristics of culture identified by this methodology. At the same, similar to other cultural models, nine factors probably cannot cover all aspects of the organizational culture, only selected.
Nine Motivational Factors and Their Aspects.

The individual factors exercise their impact in two directions, that is, positive (motivational) and negative (demotivational). These can be denoted via psychological values. For instance, the positive impact of Factor 1 Identification is represented by loyalty, while the negative one by alienation (Cartwright, 1999). To identify positive or negative impacts, the methodology of a motivometer is used (Figure 1). It includes 10 boxes, with 5 indicating negative preference and 5 of them positive. Zero is in the center and represents zero motivational effect. The respondent ticks five boxes in a row based on the preference evoked by the question or to what degree the respondent agrees with the given proposition. The respondent cannot decide for the division of the boxes 50:50, covering both directions (positive as well as negative), which restrains the respondent from introducing a mean response without much thinking.
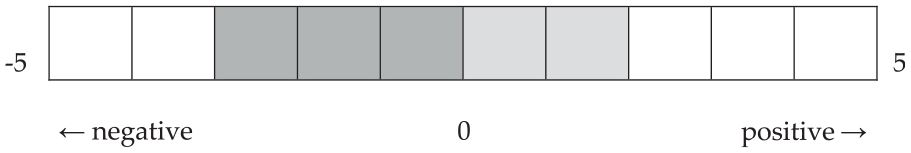
An example of filling in the motivometer for one aspect of a factor.
Motivational factors and motivometer form the basic methodological apparatus of our survey. To identify the changes in the perception of organizational culture complexity and characterization of differences between subcultures, we surveyed the employees in an organization with long-term history. The objective lay in the record of the changes in the organizational culture that might have been caused by the changes in the internal and external environments of the organization in question in 10 years span. We used the time interval of 10 years because the culture is historically based (Kummerow & Neil, 2013). Therefore, it takes longer to identify the changes in culture if there are no significant changes in other areas of an organization. The questionnaire used in the survey comprised questions allowing for the analysis of the motivational potential of the organization’s organizational culture.
The data based on the questionnaire were collected in 2017. The questionnaire comprised 36 questions and 3 demographic questions about age, job title, and tenure. We did not create the questions (variables) ourselves, but they were extracted from Cartwright’s previous research publications (Cartwright, 1999; Cartwright et al., 1999), covering the crucial areas of the selected motivational factor. The complete questionnaire is in Annex A. Cartwright (1999) recommends adjusting questions concerning the specifics of the surveyed organizations. In our case, the adjustments were just minor ones. The original pattern questions of Cartwright’s methodology (Cartwright et al., 1999) were modified regarding the nature of the surveyed organization, an industrial multinational corporation (primarily concerning the organization’s organizational structure).
Three groups of employees were aimed at—managers, back-office/support employees, and production employees. These three groups (variables) are considered subcultures based on the nature of their work. At the same time, subcultures are also constituted regarding age and tenure (the other two variables). The analysis of these subcultures (variables) is vital to answering RQ2 regarding the homogeneity of the organization. The type of variable and the measures used are introduced in Table 1.
The employees with company email accounts were approached via email, and they filled in the questionnaire online. Those without company accounts (because their work does not require access to a computer) were provided with a paper version of the questionnaire. Mostly, they were production employees working in shifts. This fact complicated the data collecting because the respondents needed to be approached in person while working.
The survey was based on nine motivational factors, each comprising four variables (aspects). Thus, they resulted in 36 variables. To quantify the variables based on the motivometer, a scale of −5 to +5 was applied. From the methodological point of view, bivariant correlation analysis was used to analyze relations. With the help of correlation analysis, it was possible to determine the intensity of relationships between individual questions and thus explore the potential for more advanced statistical procedures. With a large number of significant relationships between individual questions (variables), there is an assumption that the complex correlation structure can be explained by the existence of latent (not directly measured) factors. In the later steps of our research, the factor analysis procedure using the PCA extraction method—principal component analysis—was applied. The purpose of the factor analysis was to confirm or refute the assumption about the existence of latent factors. If they are confirmed, the factors are identified, named, and quantified.
To answer the RQ1, we needed to identify latent factors that would capture the correlation structure between the observed variables more generally using factor analysis. The data were recorded in a structured way, with all 36 variables identified for two periods. The values of the first period referred to the situation of approximately 10 ago (the year 2007), and the data of the second period referred to the situation when the data were collected (the year 2017). Using the identical variables with the identical scales in both surveyed periods allowed for comparison of the results of factor analyses for the period in question. The identification of the motivational potential in the given period was based on the capacity of the employees with their tenure excessing 10 years to comment on the motivational potential of the organizational culture (based on the 36 variables) in the past (around the year 2007) as well as the situation in 2017 when data were collected.
In both factor analyses (covering 2007 and 2017 data), the suitability of correlation structure concerning sufficient reliability of the results was first analyzed. KMO (Kaiser-Meyer-Olkin Measure of Sampling Adequacy), Bartlett’s Test of Sphericity and communalities analysis were used to measure data reliability. After confirming the suitability of the data, PCA as a method of factor extraction was used, while we did not determine a specific number of factors. Our decision was based on the eigenvalue level—the threshold for Eigen value was 1.000 based on Kaiser rule. A statistically based approach to determining the number of latent factors is both more flexible than determining a specific number of factors and is also more relevant to identify time shifts in factors affecting motivation. Then, the resulting number of factors statistically defining the intensity of the relationships between factors and the observed variables was used. We applied the factor rotation method while the number of iterations was not limited. The factor analysis resulted in the factors being named according to their predominant composition. At the same time, a factor Z-score was recorded, which was used in more detailed analyses. The factor Z-score made it possible to quantify the size of the given factor for each observation (in our case, for one respondent). Thus it was possible to further analyze these factors’ intensity for different subcultures (e.g., age).
After factor analysis, subcultures based on a given variable were analyzed to answer the RQ2. The Z-score written in the data matrix for subsequent testing of differences using one-way ANOVA was applied. The variance of the Z-score values (the variance of the intensity of the latent factor) for individual subcultures (e.g., age) was analyzed in the ANOVA. This made it possible to identify statistically significant differences in factors in individual subcultures and to evaluate their role in different groups of employees and a possible shift over time.
Results
The survey included 310 respondents, the employees of a selected multinational corporation operating globally in various industrial production segments. At the time of the survey, the corporation employed 1,402 employees, that is, the respondent sample accounts for 22%. Figure 2 presents the survey of the main identification characteristics of the respondents in graphical form.

Survey of the respondent structure.
To the best of our ability, the composition of the respondents involved was adequate, and it should be ensured that, in the survey, each substantial part of the staff was sufficiently represented. The following are the results of using exploratory factor analysis for the past (2007) and the data collection situation (2017). The original Cartwright’s methodology lists nine factors representing the motivational potential of organizational culture expressed in 36 variables. In our analysis, we examine the composition of factors not concerning logical relationships but with respect to statistically significant relationships between the observed variables.
Motivational Factors of the Organizational Culture in 2007 (Past)
Determining the motivational potential of organizational culture through individual factors in that period was based on providing those respondents who worked in the organization for more than 10 years the opportunity to comment on the motivational potential of organizational culture in the past through the 36 variables (aspects). There were 195 such respondents in our sample. We checked the interrelationships between the 36 variables through bivariate correlation analysis, using Pearson’s linear correlation coefficient as the primary metric. Figure 3 shows the correlation heatmap, with stronger correlations highlighted by more vigorous color intensity.

Correlation map of the surveyed variables in the year 2007.
Figure 3 shows the values of Pearson’s linear correlation coefficient and indicates relatively complex relationships between the observed variables as well. This complexity is also confirmed by assessing the statistical significance of the relationships, where it is shown that almost all relationships are significant at the significance level of p < .05. We identified only a positive correlation coefficient—this means that increasing one variable is related to an increase in another variable. Interpreting every relationship would be inefficient, given the number of variables. Thus, these results suggest that a complex correlation structure between variables may be a reliable basis for factor reduction in the form of factor analysis.
To provide information to answer the RQ1, the exploratory factor analysis was performed in statistical software IBM SPSS Statistics, where all its steps were performed. The KMO value reaches the level of 0.926, which is significantly above the recommended limit of .700. Bartlett’s Test of Sphericity reaches a significance level of .000, lower than the recommended maximum of .05. Analysis of communalities shows that the extraction value falls below the recommended level of .200 in no variable—most of the values are around .650 (Table 2). Thus, all three tests show that the data and their structure are suitable for continuing the factor analysis.
Results of Factor Analysis and the Measure of the Explained Variability in 2007.

Note. Total = eigenvalue of extracted factor; % of Var = percentage of explained variability; Cum % = cumulative percentage of explained variability.
The PCA method identifies seven factors that explain a total of 63.65% of the data variability. The choice of factors is based on the eigenvalue value, that is, only those factors with a value higher than 1,000 are considered. The number of factors was selected based on the Kaiser rule, often used in exploratory factor analysis to determine the number of components (Golino & Epskamp, 2017; Ruscio & Roche, 2012). After identifying the number of factors, correlation coefficients are calculated for individual variables concerning specific factors. Table 3 provides an overview of the links between the 36 variables surveyed and the 7 factors identified in Table 2. Table 2 shows the rotated component matrix, with values below 0.300 not shown for better readability. The rotation is performed by the Varimax method, and the final solution is achieved in the 12th iteration. Table 3, the values of the correlation coefficients in bold are key for naming the factors.
Overview of Links Between the Surveyed 36 Variables and 7 Identified Factors.

In principle, the seven factors were extracted from all 36 variables. However, some variables are more related to a particular factor than others. In practice, this means that if we were to measure only these seven factors (instead of all 36 variables), we would, with some probability, obtain similar results. However, the seven factors are a smaller number than the original nine factors proposed by Cartwright’s methodology. It is, therefore, a new division of variables (questions) into new separate groups (factors). Based on the strongest correlations between variables and factors, these seven factors are named due to their “composition”:
-
-
-
-
-
-
-
Since the seven motivational factors represent a relatively new way of defining the essential motivating elements of organizational culture, it is interesting to learn whether the intensity of these factors differs within subcultures. To make this happen and get the information for answering the RQ2, we recorded a factor Z-score for each factor and each respondent. To calculate the Z-score standard linear regression is used. The Z-score is written into a data matrix and then used to test for differences using one-way ANOVA. Such a review is carried out via several identifying features based on possible subcultures grounded in theoretical knowledge (age, tenure, and job title). Given that the past was observed, some subcultures of respondents were logically excluded in assessing the differences in the intensity of factors. These were, for example, subcultures defined by age (young employees) and subcultures defined by tenure (employees working in the organization for less than 10 years). This means we could not use the age and tenure variables to evaluate the differences. We, therefore, examined the differences in the intensity of all seven factors concerning subcultures based on job titles, that is, the position variable. The respondents represent three groups of employees—managerial, production, and support. We consider these three groups to be subcultures. Figure 4 shows the results of one-way ANOVA, which graphically and statistically point to differences in all factors. A statistically significant difference (marked by red interval lines) is demonstrated for the above subcultures in two new factors: development initiative (Factor 4) and recognition (Factor 5).

Results of variety testing in individual factors.
Factor 4 testing initiative results show that different subcultures of employees perceive motivation through job opportunities and initiative at unequal levels. After a more thorough analysis, the most significant difference appears between the two subcultures—production and managerial. This is also confirmed by statistical results accounting for average managerial values at the level of .206 and production values at the level of −.322. The p-value reaches the level of .019, declaring a statistically significant difference. It means that the managerial subculture in the surveyed organization considers the support of individual effort in personal growth via training and developing one’s career to be appropriate and motivational. In contrast, the production subculture perceives it as insufficient and thus demotivational. This result can be understood in the context of different types of skills on which the training of the subcultures’ members focuses. The same refers to the opportunities for career development which differ due to the nature of the work done. While the training delivered to managers primarily aims at soft skills (even though hard skills are covered as well) and based on their personal initiatives, managers enjoy more opportunities for developing and controlling their own careers, the training of production employees is almost exclusively focused on manual skills (hard skills) consumed directly in their work and, at the same time, with fewer opportunities for career development. These differences lead to different values recognized by both the subcultures as well as their different attitudes, and, thus, they perceive the support of individual employees’ efforts in their personal development via training and career development in the surveyed organization differently. The finding is supported by other studies documenting considerable diversity in work values, attitudes, and behaviors between managers and other groups of employees (e.g., Lam, 1996).
The second factor in which a statistically significant difference is demonstrated is recognition (Factor 5). Also, we used the job title as a sorting variable in this case. It turns out that there is a statistically significant difference in two of the three subcultures (managerial, production, and support). These subcultures’ results and average values show that the highest difference lies between the managerial subculture (average value of .239) and the support subculture (average value of −0.124). This is also confirmed by the statistical test, where the p-value reaches the level of .031. It means that the managerial subculture considers recognition, including appreciation and respect of all employees working in the surveyed organization, as adequate and motivational. In contrast, the support subculture sees it as insufficient and thus demotivational. These findings can be understood in the context of the nature of the work of both subcultures. It is evident that managers are those who can publicly express respect to their subordinates. They can thus perceive the measure of such recognition as appropriate. The findings show that the measure of the recognition perceived as appropriate or inappropriate varies only between managerial and support subcultures. However, the difference is missing between managerial and production subcultures. Production employees are considered an essential part of the organization without which it could not perform (produce). Differently is the measure of recognition perceived just by those members of support subculture whose work can be recognized as less essential and thus less appraised compared to the work of managerial or production subcultures. Similar findings show the differences between managerial and support subcultures in production, even though they focus on other aspects (e.g., Hunt et al., 2015).
Motivational Factors of the Organizational Culture in 2017 (When Data Were Collected)
Regardless of their tenure, all employees took part in the survey of the motivational potential of their organizational culture in that period, again commenting on the 36 variables (aspects). The sample consisted of 310 employees. Again, bivariate correlation analysis was used to verify the relationships between the surveyed 36 variables, with the primary metric being the Pearson correlation coefficient. Figure 5 shows the heatmap of correlation coefficients. Stronger correlations are highlighted by more vigorous color intensity.

Correlation map of the surveyed variables in 2017.
Figure 5 shows the values of Pearson’s linear correlation coefficient and indicates relatively complex relationships between the observed variables and investigation shown in section 3.1. It reveals that almost all relationships are significant at the significance level of p < .05. Thus, the results suggest that the complex correlation structure between the variables (we have identified only positive correlation) can be a reliable basis for information reduction through factor analysis in this case as well. It is, therefore, a similar case as we noted during the data analysis in section 3.1. Even in this case, the interpretation of individual links between variables would be ineffective (due to their high number), and there is an assumption that this complex correlation structure indicates the existence of latent factors.
To obtain information for answering the RQ1, again, the actor analysis was performed in the statistical software IBM SPSS Statistics, like in the previous case. The KMO value reaches the level of 0.957, which again exceeds the recommended limit of 0.700. Bartlett’s Test of Sphericity reaches a significance level of .000 which is also lower than the recommended maximum of .05. The analysis of communities shows a relatively high rate of extraction of variables—the smallest value of extraction reaches the level of .602, significantly higher than the recommended minimum limit of .200. Thus, the initial tests of the factor analysis show that the data representing the year 2017 also have a sufficient correlation structure for reducing dimensions through factor analysis (Table 4).
Results of Factor Analysis and the Measure of Explained Variability in 2017.
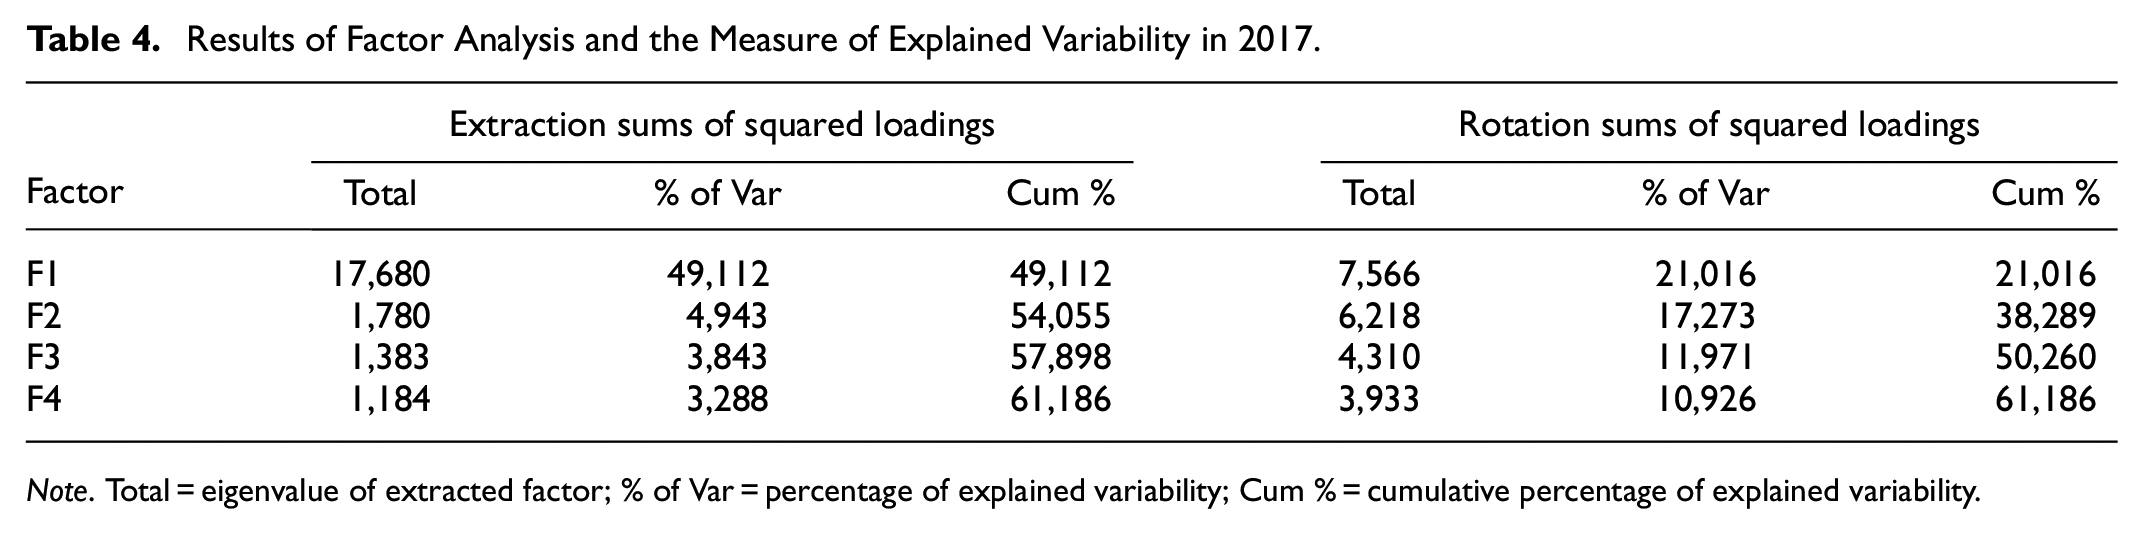
Note. Total = eigenvalue of extracted factor; % of Var = percentage of explained variability; Cum % = cumulative percentage of explained variability.
The PCA method identifies four factors that explain a total of 61.19% data variability. As in the previous factor analysis, the choice of factors is based on the eigenvalue value and the Kaiser rule so that only those factors are considered for which the value of the eigenvalue is higher than 1,000. After identifying the number of factors, correlation coefficients are calculated for individual variables concerning specific factors. Table 5 shows an overview of the links between the surveyed 36 variables and the four identified factors. Table 5 is in a rotated component matrix format with values lower than 0.300 not displayed for better clarity. The Varimax method performs the rotation, and the final solution is achieved in 11 iterations. Table 5 shows the values of the correlation coefficients (in bold) that are key for naming the factors.
Overview of Links Between the Surveyed 36 Variables and 4 Identified Factors.

In principle, the four factors are extracted from all 36 variables. However, some show a higher correlation level with a particular factor than others. Since four factors were identified in this case (compared to seven factors in section 3.1), this is an interesting finding because we analyzed the same 36 variables, but with a 10-year time shift. Based on the strongest relations between variables and factors, these four factors are named due to their “composition”:
-
-
-
-
Since the number of identified factors has decreased even in this case, and it is again a new way of defining the essential motivational elements of organizational culture, the differences between their intensities were analyzed to answer RQ2. Like in the previous analysis, we recorded the factor Z-score for each factor and each respondent, using a standard linear regression to calculate it. The Z-score written in the data matrix for subsequent testing of differences using one-way ANOVA was applied. The review was performed using several identifiers defining subcultures: position, age, and tenure (Figure 6).
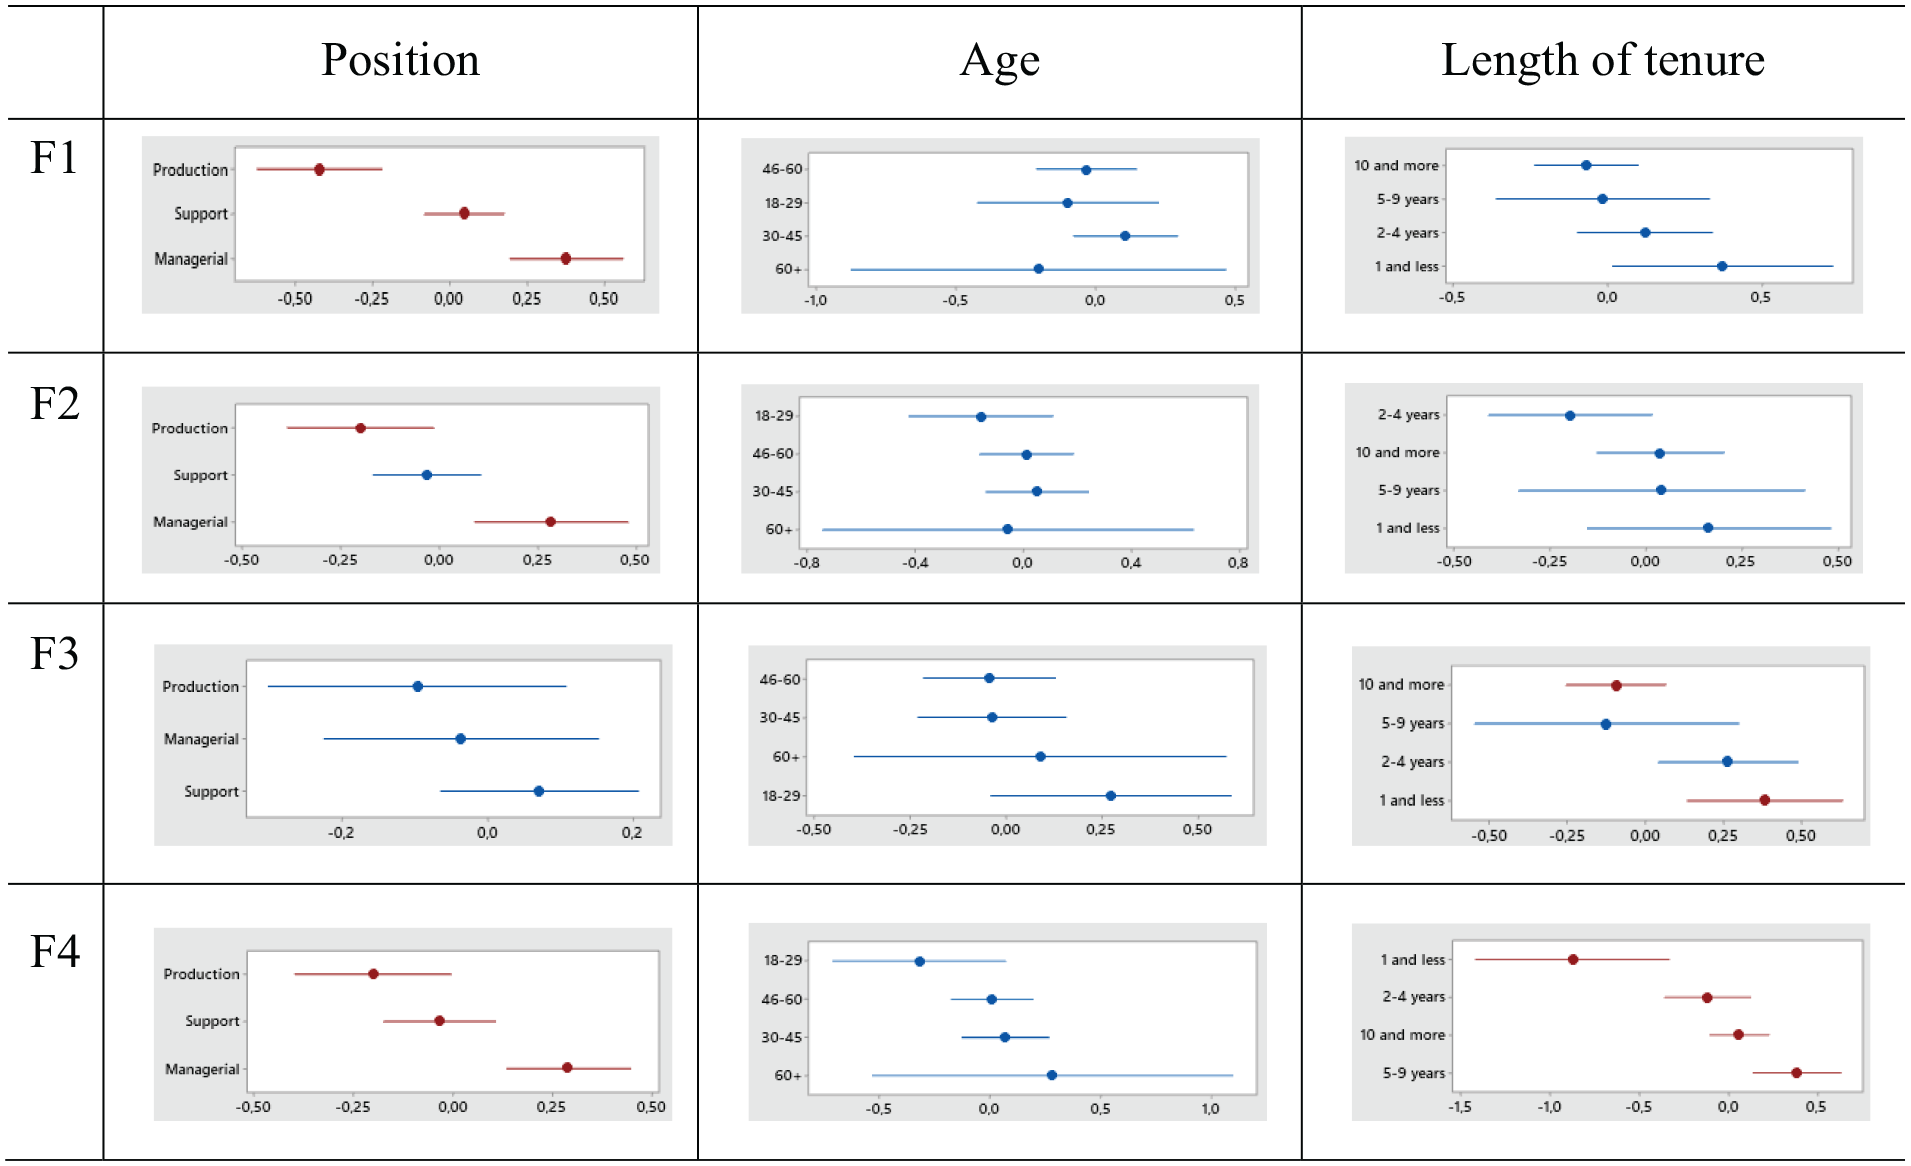
Results of variety testing in individual factors.
The difference in intensity of all four factors concerning the position variable refers to three subcultures—managerial, production, and support. A statistically significant difference is found for the following three factors: Identification of employees with the organization and its management (Factor 1), Rationality and development (Factor 2), and Internalization (Factor 4).
The results of the one-way ANOVA point to differences in individual factors, and a more thorough analysis of Factor 1 Identification of employees with the organization and its management shows a significant difference between all three subcultures. This is also manifested by the statistical results showing average managerial values at .375, support values at .046, and production values at −.423. The p-value reaches the level of .001, manifesting a statistically significant difference.
It means that the members of the managerial subculture consider their employees’ identification with the organization and its management as appropriate and motivational. In contrast, the members of the production subculture regard it as inadequate and demotivational and the members of the support subculture as neutral, that is, without any positive or negative motivational effect. The interpretation assumes that managers perceive their activities and behaviors toward employees as adequate (this is confirmed by the individual element of this Factor, such as Fair treatment by company and management, Recognition and rewards of company and management for efforts made, Consistency between managerial decisions, actions, and promises) as they are the ones who can significantly influence this Factor. At the same time, the production employees’ nature of work does not allow for assessing all circumstances impacting the management activities. Thus, some members might likely have problems identifying themselves with some decisions and activities of their management. The members of the support subculture stand somewhere in the middle—it is likely that they are aware of a wider range of circumstances because they are closer to management and, within the context of their work, they acquire more information. However, neither they are those who can exercise a more significant impact on the Factor. The differences between and among subcultures regarding their jobs are also identified in other studies, for example, Badia et al. (2020), describe headquarters and facility subcultures. However, they interpret the differences primarily in the context of the level of proximity to technological issues.
After a more thorough analysis of Factor 2 Rationality and development, the most significant difference can be identified between two subcultures—production and managerial ones. This is also confirmed by statistical results presenting average managerial values at the level of .284 and production values at the level of −.199. The p-value reaches the level of .011, manifesting thus a statistically significant difference. It means that the members of the managerial subculture regard the level of the constructive, open, and rational approach to decision-making, problem-solving and communication all around the organization as well as the support for initiatives and individual efforts of employees in their personal growths via training and career development as being adequate and motivational. In contrast, the members of the production subculture consider them inadequate and demotivational. The result can be interpreted similarly to the previous factor analysis through the context of typical opportunities for both subcultures to get training and develop their careers. While on the one hand, managers likely have various data and analyses available when deciding. Therefore they perceive their decision-making as rational. On the other hand, the lack of information available to the members of the production subculture, or their lower capacity to put them into wider context, may influence their perception of decision-making and problem-solving as rational, and, in addition, they receive them via emotions. The differences between managers and other employees have also been identified in the above-mentioned studies showing significant variety in their work values, attitudes, and behaviors (e.g., Lam, 1996).
After a more thorough analysis of the internalization factor (Factor 4), a significant difference can be seen between the managerial and production subcultures and between the managerial and support subcultures. This is also confirmed by the statistical results showing average managerial values at the level of .290, support values at the level of −.034, and production values at the level of −.200. The p-value reaches the level of .003, manifesting a statistically significant difference. It means that the members of the managerial subculture perceive their employees’ internalization of the organization’s values through performance as adequate and motivational. In contrast, the members of the production and support subcultures regard it as being inadequate and demotivational. This result represents a problem for the organization, as identified in other studies (e.g., Lee et al., 2015). Since employees’ values do not coincide (or they are in contrast) with the organization’s values, they are likely demotivated. The interpretation of this finding stems from the assumption that the decision-making authority lies with managers. It is easier for them to internalize what the organization does and what it is. While the members of support and production subcultures are unlikely to have the opportunities to make decisions, they might struggle with the organization’s decisions and, thus, with the organization itself and its values. This fact may correspond with the previous result in which they do not sufficiently appreciate the opportunities for their personal initiative and development. Therefore, they do not consider the decisions as being made rationally.
The variety of all four factors’ intensity regarding the age variable refers to the members of four subcultures aged 18 to 29, 30 to 45, 46 to 60, and 60+ years. Statistically, no significant difference has been identified in either of the four factors. In this context, while no significant differences are evidenced among these groups, it is questionable to perceive them as separate subcultures in the organization in question.
The variety of all four factors intensity regarding the variable tenure refers to the members of four subcultures with their tenure ranges of 1 year and less, 2 to 4 years, 5 to 9 years, 10 years, and more. Statistically, the significant difference is demonstrated in two factors: Group dynamics (Factor 3) and Internalization (Factor 4).
After a more thorough analysis of Factor 3 Group dynamics, the most significant difference is between the two subcultures of employees: 1 year and less and 10 years and more. This is also confirmed by the statistical results showing average values of 1 year and less at .381 and 10 years and more at −.096. The p-value reaches the level of .005, manifesting a statistically significant difference. It means that the subculture of employees working for the organization for less than 1 year considers its work relations and group dynamics adequate and motivational. In contrast, the group of those working for the organization more than 10 years regards them as inadequate and demotivational. The interpretation of this result assumes that new employees start understanding actual relations at the workplace, their intensity and efficacy only after some time they become the organization’s full members. Those employees who work for the organization longer are likely able also to detect its negative manifestations. Adjustment to one’s group is one of the aspects associated with newcomers in organizations (Bauer et al., 2007).
After a more thorough analysis of Factor 4 Internalization, several significant differences can be identified between several subcultures, namely among the following groups: 1 year and less, 5 to 9 years, and 10 years and more, between groups 2 to 4 years, and 10 years and more, and between groups 5 to 9 and 10 years and more. This is also confirmed by the statistical results manifesting average values of subculture 1 year and less at the level of −.879, values of subculture 2 to 4 years at the level of −.121, values of subculture 5 to 9 years at the level of .380, and values of subculture 10 years and more at the level of .057. The p-value reaches the level of .001, manifesting a statistically significant difference. It means that the subculture of the employees working for the organization for a short time (1 year or less) does not perceive internalization of the organization’s values and identification with the organization via the performance as adequate and thus demotivational. Internalization is, however, considered more intensively by other subcultures of the employees working for the organization longer. It results from organizational socialization as identified by Cooper-Thomas and Anderson (2006), and it is this context in which the finding can be interpreted. Understanding and internalizing an organization’s values require being an organization’s member and its culture’s insider for a longer time.
Discussion
The results provide a variety of findings related to the changes in perception of the complexity of organizational culture’s dimensions and answer the RQ1: Is it possible to characterize such a complex phenomenon as culture only by selecting specific cultural dimensions? In the past, nine factors of Cartwright’s (1999) methodology were used for characterizing a culture. They were intended to provide a complete picture of an organizational culture’s motivational potential. Based on the survey of the structure of organizational culture elements in the past (2007), we have found out that the original 36 variables can be interpreted using only seven factors when identifying the organizational culture’s motivational potential. It means that the factors must exercise higher complexity. In the same way, the correlation structure of 2017 data is assessed. We found that only four factors can interpret all 36 variables to identify the organizational culture’s motivational potential. Because the input variables (aspects of the organizational culture) have not changed, it implies that seven or four factors are more complex than the original nine factors. The findings suggest lowering the number of factors needed to characterize an organizational culture’s motivational potential from 9 (in 1999) to 7 (in 2007) and 4 (in 2017) and thus account for the natural rise of their complexity (Figure 7). We assume this as evidence of the increase in complexity of various features of organizational culture (dimensions) and the mutual interrelationship among them.

Decrease in the number of factors and increase in their complexity.
Regarding the RQ1, we may claim, based on our results, that analyzing organizational cultures by cultural dimensions is a valuable tool, and organizational culture can be characterized by the limited number of dimensions, but culture is too complex to reduce it only to some not connected limited number of dimensions. Wider context must be considered including relations between and among its dimensions and other aspects which are not included in the dimensions itself. The atomizing culture into single dimensions provides an incomplete picture of the culture itself because the complexity of interconnections is enormous, which is supported by the results of our research.
The results also provide a host of findings referring to subcultures, providing valuable knowledge to answer the RQ2: Can the organization be perceived as a homogeneous whole that can be characterized by a limited number of cultural dimensions? Most differences are identified among those based on job title (positions; nine differences among individual subcultures in total, with two of them related to the 2007 analysis and seven to the 2017 analysis). Based on the analyses, the organizational culture is generally perceived as motivational through three out of four factors by the members of the managerial subculture (2017 analysis). Simultaneously, these factors represent the highest value of perception of organizational culture’s motivational potential in this subculture. Production subculture considers the organizational culture being demotivational in all four factors. The findings show namely the difference between the production and managerial subcultures with much lower motivational potential identified by the first one. The findings uncover numerous questions that organizations should deal with trying to find the answers, such as if there is any natural way how to influence production subcultures and increase the motivational potential of the organizational subculture in question to reach the level of non-production subculture or if this is an inherent specificity of the subculture stemming from the nature of their work, for example, demanding physically intensive work and the like. A similar result is presented in the context of happiness, where Helliwell et al. (2017) claim that labor-intensive work is linked to a lower level of happiness perception. In the subcultures based on tenure seven differences are detected (2017 analysis) related to the subculture of employees working for the organization for a short period of time (1 year and less) and the subculture of those working for the organization long time (10+ years). In the surveyed organization, no differences in the age groups are identified, and thus they cannot be considered subcultures based on this characteristic, even though theory recognizes such subcultures.
Regarding RQ2, our findings suggest that even though an organizational culture can be characterized by a limited number of increasingly complex dimensions, any organization must be recognized as a heterogeneous whole. Therefore, the attention must be focused on its various subcultures.
Conclusion
The majority of dimensional models used for culture characterization were developed decades ago, that is, under different market, social, and societal conditions. Even though the importance of existing dimensional models and their application cannot be underestimated at present, the complexity of organizations nowadays finds its expression in organizational cultures and in more complex and interconnected individual dimensions (factors). Based on our research, the number of factors needed to characterize an organizational culture’s motivational potential has decreased from nine to seven and four recently. We assume that the complexity of factors used to characterize organizational culture’s motivational potential also increased. Based on our research, we claim that characterizing organizational culture by cultural dimension is possible. But organizational culture may be too complex to reduce to simplistic cultural dimensions. Wider context must be considered, including relations between and among its dimensions and another aspect outside the focus of dimensions, because putting culture into single dimensions provides an incomplete picture of the culture itself. Managers should be able to understand the wider context of organizations and their cultures to make such decisions that would be acceptable among the employees, which creates culture.
Based on our findings, the organization is not homogeneous, but individual groups of employees exercise their own cultural characteristics, namely the subcultures based on positions (job titles) and tenure. We claim that when characterizing an organizational culture, it is crucial to assess it in the whole organization and focus on individual subcultures. If the survey is aimed at the whole organization, the differences among subcultures could not be detected, and thus, the organization would miss the opportunity to increase its motivational potential. This knowledge is essential for managers to understand that there are different groups of employees with specific values, and they possibly would not accept the decisions made similarly. It opens possibilities to adjust several HRM functions, for example, remuneration systems, career prospects, or training to specific subcultures.
Our survey has been limited by conducting it only in one organization, and memory optimism could influence the perception of the organizational culture by the employees referring to the past. However, several scientific studies and publications confirm that asking about individuals’ past behavior is possible and widely used. (e.g., Motowidlo, 1999; Taylor & Small, 2010). In addition, the findings open numerous topics for future surveys, for example, considering the diversity of the sample in terms of cultures like in other studies (Hofstede, 2002; Zeqiri & Alija, 2016) or the impact of corona pandemics (Kniffin et al., 2021). While the data were last collected in the surveyed organization in 2017, there is an opportunity to collect new data in the future and compare them with the past periods and already publicized results. However, since culture is historically based and results from group problem-solving (Kummerow & Neil, 2013; Williams et al., 1993), culture change should be analyzed only after a more extended period, when employee behavior has changed, and values stabilized. Therefore, we would probably only measure group opinion now, but it cannot be considered as culture itself (Trice & Beyer, 1993). From another point of view, culture change can be a conscious process on the one hand and an unconscious process on the other, and one source of culture is its environment (Trice & Beyer, 1993). Our research focused on a manufacturing company whose primary operation was minimally influenced by the covid pandemic, and production was unaffected. From a methodological point of view, the limitations can be seen in the sample size since 22% of the employees of the investigated company took part in the survey. Although the sample achieves relatively good values from the point of view of quantity (with a 95% confidence level, a confidence interval of 4.91% would be reached), the existence of non-response bias during data collection cannot be ruled out. Such a bias could also have a partial impact on the results of testing statistically significant differences through ANOVA. The use of Kaiser’s rule in determining the number of factors can also be a limitation. Although this is a fairly frequently used rule in exploratory factor analysis, a smaller number of factors usually results in a smaller amount of explained variability. This limitation could be removed by subsequent research in this area, which would examine the validity of our results.
Footnotes
Annex A: Questionnaire
F1 Identification
F2 Equity
F3 Equality
F4 Consensus
F5 Instrumentality
F6 Rationality
F7 Development
F8 Group dynamics
F9 Internalization
Declaration of Conflicting Interests
The author(s) declared no potential conflicts of interest with respect to the research, authorship, and/or publication of this article.
Funding
The author(s) disclosed receipt of the following financial support for the research, authorship, and/or publication of this article: This research was supported by the project APVV-17-0656 Transformation of Paradigm in Management of Organizations in the Context of Industry 4.0. This work was funded by the Faculty of Management, Comenius University Bratislava, Slovakia.
Data Availability Statement
The data that support the findings of this study are available from the corresponding author upon request.