
Abstract
This paper explores whether happiness-led growth policies implemented in some countries are viable for achieving better economic well-being proxied by GDP per capita using a panel dataset covering 104 countries from 2006 to 2018. While past studies showed that economic growth promotes happiness, this paper applied the panel Granger causality test to show that GDP per capita is also determined by happiness. Accordingly, the pooled ordinary least squares, random-effects model, fixed-effects model, and two-step generalized method of moments were employed to estimate the effect of changes in happiness on economic growth. The empirical results suggest that economic growth of 1% to 3% can be obtained by increasing happiness. The positive effect of happiness is about four times greater in developed countries than in developing countries. This paper reveals that happiness should be included in conventional economic growth models to achieve a holistic approach in designing development policies.
Keywords
Introduction
The global financial crisis in 2007 to 2008 has led to reconsider the adequacy of adopting gross domestic product (GDP) as an all-encompassing yardstick of economic performance and societal progress (Pillay, 2020). This resulted in the establishment the “Commission on the Measurement of Economic Performance and Social Progress” led by the Nobel laureates Joseph Stiglitz and Amartya Sen and facilitated by Jean-Paul Fitoussi. They have prompted efforts to develop metrics that reflect the essence of the good life (E. Stiglitz et al., 2009). Stiglitz-Sen-Fitoussi report is a significant “Beyond GDP” stimulus (J. Stiglitz et al., 2018). It encourages complementing growth-oriented policies with happiness (Noll, 2011). Happiness is a societal progress indicator that ensures economic growth does not exceed the limit of social sustainability and planetary boundaries (Masaki, 2022; Rogers et al., 2012).
Apart from that, the “Beyond GDP” agenda has been integrated into the global policy agenda, as demonstrated by the agenda of the United Nations on “Transforming Our World: The 2030 Agenda for Sustainable Development.” It consists of the 17 Sustainable Development Goals (SDGs) associated with 169 targets and 232 indicators (United Nations, 2015). To date, 193 countries worldwide have agreed and adopted the SDGs framework that captures economic, social, and environmental sustainability. Therefore, the equilibrium between economic, social, and environmental sustainability is focal to sustainable development (Aksoy & Bayram Arlı, 2020). Following this, the notion of “Economy of Well-Being” that underscores the mutually reinforcing relationship between well-being and economic growth is proposed by Llena-Nozal et al. (2019). Nevertheless, the “Economy of Well-Being” does not deny the importance of GDP as one of the relevant measures of economic performance and societal progress. Instead, the “Economy of Well-Being” policy needs to be guided by a broader metric that can capture the complexity of the relationship between economic growth and societal progress and the channels through which they are connected.
The “Economy of Well-Being” proponents pointed out that growth-oriented policies that solely rely on GDP are associated with three major constraints. First, “the welfare of a nation can be scarcely inferred from a measurement of a national income (Kuznets, 1934, p. 7).” An economy-centrism GDP captures the tangible material living standards but does not capture social sustainability, such as happiness and social inclusion (Kalimeris et al., 2020; Wang, 2015). Meanwhile, human-centrism happiness captures tangible and intangible dimensions that matter to people, including material living standards, education, environment, health, insecurity, institutional quality, jobs, and social connections.
Second, “If ever there was a controversial icon from the statistics world, GDP is it. It measures income, but not equality, it measures growth, but not destruction, and it ignores values like social cohesion and the environment. Yet, governments, businesses and probably most people swear by it (OECD Observer, 2004).” GDP sidesteps the social costs of income disparity and the benefits from informal economic activities. Besides, GDP provides false information by capturing the reconstruction activities but ignoring the corresponding economic destruction. Moreover, social cohesion involving cooperation, social capital, and trust between individuals is not factored into GDP. Also, the changes in climate, depletion of environmental assets or natural resources, and loss of biodiversity are overlooked in GDP.
Third, “distinctions must be kept in mind between quantity and quality of growth, between its costs and return, and between the short and long term. Goals for more growth should specify more growth of what and for what (Kuznets, 1934, p. 7).” Three commonly used approaches to quantify GDP (for instance, expenditures, income, and production approaches) and various measures of GDP (such as GDP growth, GDP per capita, and GDP rankings) downplay the vital role of happiness as social capital to achieve sustainable development. However, GDP are used not only as economic health indicators but also as societal development and welfare indicator (Boo et al., 2016).
Despite the foregoing omissions of GDP, minimal monetization is necessary for a high level of happiness (Miñarro et al., 2021). Therefore, Target 8.1 under the Sustainable Development Goal (SDG) 8 on “decent work and economic growth” is that, “Sustain per capita economic growth following national circumstances and, in particular, at least 7 per cent gross domestic product growth per annum in the least developed countries.” On the other hand, happiness is a foundation for sustainable economic growth (Llena-Nozal et al., 2019). Additionally, according to the Sustainable Development Report 2021, subjective well-being is one of the metrics of SDG 3 on “Good Health and Well-Being” (Sachs et al., 2021). Hence, implementing happiness-led growth policies contribute to sustainable economic growth and sustainable development. Moreover, happiness-led growth policies enable comprehensive evaluations of the impact of policies on people’s conditions and experiences.
Since “growth, prosperity, and inclusion are complementary, not contradictory, goals for meaningful economic development” (Liu, 2016, p. 8), economic growth should not come at the expense of social inclusion and well-being. In other words, economic growth alone is not sufficient for promoting overall well-being and happiness. On the other hand, Figure 1 shows a strong association between happiness (using life ladder obtained from World Happiness Report as a measure) and real GDP per capita (in natural logarithm) for 104 countries. Happiness explains 66.71% of the variation in real GDP per capita. Kenny (1999) suggested a bidirectional relationship between happiness and economic growth is plausible. Kenny (1999, p. 19) argued further that “if there is any causal relationship in rich countries, it appears to run from happiness to growth, not vice-versa.” While it may be disputed that higher income promotes happiness, happiness may be positively associated with increased income. However, this opinion remains to be tested.

Relationship between happiness and economic growth, 2018.
Several developments highlight the growing attention to happiness in development planning (Exton & Shinwell, 2018). In 2004, Australia developed a well-being framework incorporating five well-being elements. The Prime Minister of the United Kingdom decided to include subjective well-being as an input to development policies from 2010 onward (Diener et al., 2015). The United Nations Sustainable Development Solutions Network (UNSDSN) published the first World Happiness Report in 2012. In 2013, the OECD distributed guidelines on implementing global measures of subjective well-being (Diener et al., 2015). Effective April 2015, the Government of France submitted an annual report on economic, social, and environmental conditions to the Parliament (Exton & Shinwell, 2018). Since 2016, the Government of Italy has annually reported 12 indicators grounded on the “measures of equitable and sustainable well-being” to the Parliament. In 2017, the Swedish Ministry of Finance introduced new measures of well-being complement to GDP in the Budget Bill. The same year, the United Arab Emirates proposed incorporating happiness in policy-making by executing the National Program for Happiness and Positivity. Scotland launched the new National Performance Framework in 2018, focusing on national well-being, mainly economic, environmental, health, and social facets (Wallace, 2019). On 30th May 2019, New Zealand released the first well-being budget to promote happiness as the country’s national agenda (Anderson & Mossialos, 2019). Recently, Iceland has suggested well-being initiatives because GDP is prone to underestimate the quality of life and sidestep inequality, which results in social damage (Frijters & Krekel, 2021).
Nevertheless, implementing happiness-led growth policies is not without challenges. Hitherto, the vast literature on fundamental determinants of economic growth is restricted to tangible dimensions, such as capital formation, entrepreneurship, financial development, labor force, natural resources, technology, and innovation (Paun et al., 2019). Nonetheless, it is observed that these fundamental determinants are inadequate to explain differences in economic growth across countries. Additionally, the literature regarding the effect of happiness on economic growth and the economic consequences of happiness is under-explored (Kenny, 1999; Li & Lu, 2010; Llena-Nozal et al., 2019; Rasheed et al., 2011; Rasiah et al., 2019). The primary reason for this limited literature is that conventional economic growth models do not incorporate happiness as an explanatory variable of economic growth (Rasiah et al., 2019). Therefore, with more countries taking happiness into account when devising policies, it becomes critically essential to thoroughly examine the effect of happiness on economic growth, and not just from economic growth to happiness, as done by many past studies.
This paper contributes to the literature in four-fold. First, it sheds light on happiness’s role in advancing economic growth. If there is clear evidence that happiness spurs economic growth significantly, policymakers should propose measures that improve happiness. Second, the newly developed panel Granger Causality test by Dumitrescu and Hurlin (2012) is adopted to show that while economic growth leads to a higher level of happiness as commonly reported in the literature, the causal relationship is not one way, but a feedback relationship exists between the two variables. Third, considering the bidirectional relationship between happiness and economic growth, this paper applied the generalized method of moments (GMM) to deal with endogeneity and simultaneity biases. Fourth, this paper includes a comprehensive sample of countries worldwide to the extent of data available.
This paper comprises five sections. After this introductory section, a literature review is conducted in Section 2. Section 3 includes the empirical model, description of data and econometric methods. The discussions of the empirical results are provided in Section 4. Finally, Section 5 concludes the study by providing policy recommendations and suggestions for future research.
Literature Review
Concept of Happiness
Since 1794, public happiness (also known as the “pubblica felicita”) has been the ultimate goal in economics, as pointed out by the Italian philosopher, Ludovico Antonio Muratori (Rasheed et al., 2011). Generally, happiness is defined as the subjective enjoyment of one’s life as a whole or overall “life satisfaction” (Veenhoven, 2017). It is the sense of contentment and gratification in all facets of life (Rasheed et al., 2011). It is also a state of mental health associated with harmony, free from anxiety and other emotional disturbance (Rasheed et al., 2011). Thus, happiness is not merely a function of positive feelings but living a good life (Rasheed et al., 2011).
Happiness is often used interchangeably with other comparable terms, such as life satisfaction (Gonza & Burger, 2017), quality of life (Veenhoven, 2017), and well-being (Veenhoven, 2017). Nonetheless, the comparable terms can be clearly distinguished from one another. Broadly, well-being is an umbrella term covering: (1) objective well-being (Voukelatou et al., 2021), (2) subjective well-being (Chen et al., 2013), and (3) psychological well-being (Chen et al., 2013). Objective well-being is external well-being, which evolves from one’s evaluation of human society (Alatartseva & Barysheva, 2015). It reflects people’s material living conditions and the quality of their lives (Voukelatou et al., 2021).
On a separate note, subjective well-being and psychological well-being are internal well-being (Alatartseva & Barysheva, 2015). Internal well-being is interpreted as human spiritual well-being associated with one’s personal characters and features (Alatartseva & Barysheva, 2015). Subjective well-being is happiness’s scientific term or synonym (Yang & Srinivasan, 2016). Happiness refers closely to hedonism, so subjective well-being is also synonymous with “hedonic well-being” (Chen et al., 2013) or self-reported happiness.
Subjective well-being encompasses of an affective component and a cognitive component (Gataūlinas & Banceviča, 2014). The affective component is experiential in nature, whereby pleasure is a feeling. The cognitive component involves rational evaluative assessment of lives as a whole, by which pleasure is an attitude (van Hoorn et al., 2010). The cognitive component of subjective well-being is equivalent to life satisfaction (Lucas & Diener, 2008). On the other hand, psychological well-being consists of six dimensions: (1) autonomy, (2) environmental mastery, (3) personal growth, (4) positive relations with others, (5) purpose in life, and (6) self-acceptance (Ryff & Singer, 2008).
In tandem with more governments’ concern regarding happiness, various measures of happiness are made known, including Cantril’s Self-Anchoring Ladder (also known as the Cantril Ladder of Life), Gross National Happiness, Quality of Life Index, Satisfaction with Life Scale, Positive and Negative Affect Schedule, Personal Well-Being Index, Subjective Happiness Scale, Happy Planet Index, Legatum Prosperity Index, Environmentally Responsible Happy Nation Index, Social Progress Index, etc. The development of globally comparable data on happiness has contributed to the possibility of conducting in-depth research into the relationship between happiness and economic growth (Mikucka et al., 2017). Figure 2 illustrates the concept of happiness.

Concept of happiness.
Relationship Between Happiness and Economic Growth
Much of the literature has mainly focused on the impact of economic growth on happiness, and the empirical findings are controversial. For instance, some findings demonstrated that higher economic growth raises happiness (Veenhoven & Vergunst, 2014). However, the opponents disputed that economic growth is insignificant in improving happiness (Bartolini & Sarracino, 2015).
Instead of focusing on the compatibility between happiness and economic growth, Mikucka et al. (2017) pointed out the importance of specific conditions that influence their relationship. The development status is one of these conditions, where the impact of economic growth on happiness diminishes as a country becomes more affluent (Bartolini et al., 2017). The time span also matters. The positive effect of economic growth on happiness exists in the short run but vanishes over the long run due to the decline in the marginal utility of income on happiness (Easterlin, 2005).
On the other hand, the literature on the effect of happiness on economic growth is scarce and indicates a large gap in the “Economy of Well-Being” (Kenny, 1999; Li & Lu, 2010; Llena-Nozal et al., 2019; Rasheed et al., 2011; Rasiah et al., 2019). Kenny (1999) is among the pioneering researcher to raise the possibility of a bidirectional relationship between happiness and economic growth. He surveys the empirical evidence in 10 developed countries over the period 1952 to 1989. Kenny found that the relationship between happiness and economic growth is complex and not easily generalizable, with some countries exhibiting a positive relationship, some a negative relationship, and some no relationship. He explained that a minimum level of economic growth is a necessary condition for happiness but economic growth is not a sufficient condition for happiness. It was noted that in developed countries, the marginal utility of absolute income is less significant than that of relative income. He concluded that the economic growth model should take happiness into account. Nevertheless, Kenny’s (1999) study used panel data for a small number of developed countries, limiting the generalizability of the findings.
In the same vein, Li and Lu (2010) studied the impact of happiness on economic growth. They demonstrated a significant positive correlation between happiness (proxied by life satisfaction) and economic growth. On the other hand, they found a significant negative correlation between sex ratio imbalance and happiness. According to them, happiness is strongly associated with the partnership. Hence, an imbalanced sex ratio leads to difficulty finding a life partner and is anticipated to result in unhappiness. Accordingly, they used the sex imbalance ratio as an instrument of unhappiness in a Two-Stage Least Squares estimation. They found that happiness has a significantly positive causal effect on economic growth. They also employed Three-Stage Least Squares and concluded that happiness lengthens life expectancy and attracts investment, which in turn spurs economic growth. Li and Lu (2010) used sex ratio imbalance as a proxy for one aspect of happiness and life satisfaction as a broader measure of happiness. However, they did not consider the dynamic feature of economic growth. While the study provides evidence for the positive relationship between happiness and economic growth, it does not offer insights into the mechanisms through which this relationship operates.
Using the panel data of 10 countries over the period from 1961 to 2005, Rasheed et al. (2011) employed a Solow Growth Model incorporated with happiness to observe the effect of happiness on economic growth. They employed the Cobb-Douglas function-based total factor productivity (TFP) as a proxy for GDP growth and three happiness indices which are ecological footprint, life expectancy and life satisfaction. Ecological footprint has a significantly positive effect on TFP in four countries but a significantly negative effect in another four countries. In comparison, life expectancy has a significant positive effect on TFP in two countries but a significant adverse effect in another country. Life satisfaction is not significant in all 10 countries except the USA. They summarized that happiness is an intangible capital that explains TFP in the Solow Growth Model. However, Rasheed et al. (2011) have not systematically distinguished the impact of the different happiness indices on TFP. Besides, the empirical findings from the analysis of 10 developed countries cannot be generalized worldwide, especially in developing and transition economies.
Accordingly, Llena-Nozal et al. (2019) devoted attention to the fact that well-being has gradually overtaken GDP as a measurement agenda for budgetary and policy-making. They developed the notion of the “economy of well-being.” They defined the “economy of well-being” as the mutually reinforcing relationship between well-being and economic growth. In other words, none of the OECD countries can achieve moderate economic growth without doing well on well-being. As such, effectively leveraging happiness for economic growth is imperative to achieve a sustainable economy of well-being. They outlined the potential channels through which well-being reinforces economic growth. These include educational attainment, skills, longevity, absence of physical and mental health problems, gender equality, and social protection and redistribution. Nevertheless, the bidirectional relationship between well-being and economic growth is established based on opinion rather than extensive evidence.
Applying the dynamic panel estimation of Generalized Methods of Moments (GMM), Rasiah et al. (2019) evaluated the effect of happiness on economic growth on a panel dataset from 2000 to 2013. They found that happiness has a positive and statistically significant impact on economic growth after controlling for other factors such as human capital, capital formation, and population. Furthermore, they reported that a low level of happiness hampers economic growth by lowering labor productivity and fertility rate (below the replacement levels) but increasing suicides. However, they used panel data consisting of 50 countries with a limited set of four explanatory variables (i.e., capital formation, population, human capital and happiness).
Nevertheless, there is a dearth of studies regarding the effect of happiness on economic growth. Many studies assume that economic growth is necessary to achieve happiness but neglect the possible economic growth channel through happiness. To fill the lacuna, the paper examines the existence of a feedback relationship between happiness and economic growth and further analyses happiness’s effect on economic growth. Limitations in past studies are the inclusion of a small sample of countries or limited control variables. This paper fills in the gap by using a dataset that includes 104 countries to enable robust conclusions to be drawn on happiness as an engine of growth by controlling the effects of a larger group of variables that potentially affect economic growth.
Theoretical Framework
Based on a critical and extensive literature review, the primary aim of this study is to examine the effect of changes in happiness on economic growth. The relationship between happiness and economic growth can be explained through economic and psychological theories. The theoretical framework is grounded in the Endogenous Growth Theory. Endogenous Growth Theory posits that economic growth is not only driven by external forces (particularly capital formation and population growth), but also dependent on internal forces, such as human capital, innovation and knowledge creation.
Coinciding with the Broaden-and-Build Theory of Positive Emotions, happiness entails positive emotions that spark a broad and expansive thought-action repertoire. Positive emotions fuel novel, flexible, creative thinking and problem-solving approaches (Fredrickson, 2001). Besides, positive emotions promote advancement in personal growth by acquiring competence development (Newman et al., 2011) and catalyzes creativity and innovation (Mao & Weathers, 2019). In this sense, happiness can promote economic growth by increasing creativity and productivity.
Herzberg’s Two Factor Theory also offers insights into the relationship between happiness and economic growth. According to this theory, two factors contribute to job satisfaction: hygiene and motivators. Hygiene factors, such as salary and working conditions, are necessary but insufficient for job satisfaction. Motivators, such as recognition and opportunities for growth, genuinely contribute to job satisfaction and happiness. The “Happy-Productive Worker Thesis” also proposed that happy employees are believed to have higher productivity and better performance. Happiness is operationalized as job satisfaction (Wright, 2005). “Subjective well-being is associated with good success in the workplace. Happy workers are productive, satisfied workers, and their positive affect is associated with good organisational citizenship, good relations the well-known (Pavot & Diener, 2004, p. 685).” When these motivators are present, employees are more likely to be productive and innovative, leading to economic growth.
Finally, the PERMA Theory of Well-Being offers a comprehensive framework for understanding the components of well-being. PERMA stands for Positive Emotions, Engagement, Relationships, Meaning, and Accomplishment (Seligman, 2011). This theory suggests that when individuals experience positive emotions and are engaged in meaningful work, they are more likely to form positive relationships and achieve a sense of accomplishment. These components of well-being can contribute to increased creativity, productivity, and innovation, leading to economic growth. In agreement with the PERMA Theory of Well-Being, the engagement element of happiness reflects the sense of belonging to the organization. It induces intrinsic motivation/satisfaction, which raises productivity (Oswald et al., 2015). The generalizability of the happiness-productivity relationship at the aggregate level has been proven by DiMaria et al. (2020).
Overall, these theories suggest that happiness and well-being are desirable outcomes and have important economic growth implications. By fostering positive emotions, providing meaningful work and growth opportunities, and promoting positive relationships and accomplishments, individuals can contribute to economic growth and prosperity.
Methodology
This section explains the empirical model, data, and econometric methods used for subsequent analysis.
Empirical Model
The empirical model for examining the effect of happiness on economic growth is grounded on Mankiw et al.’s (1992) Augmented Solow Model. Following Mankiw et al. (1992), the model is derived from the Cobb-Douglas production function of the Augmented Solow Model that relates real output,

where,
i = country,
t = time,
α = elasticity of real output with respects to the physical capital, and
β = elasticity of real output with respects to the human capital.
Nonetheless,


where,
HAPit = happiness,
Following the argument presented by Law and Habibullah (2006), the steady-state of output per worker derived from Equations 1–3 can be represented by:

where,
Due to data limitations, we assume that the growth rate of technological progress and capital depreciation rate remain unchanged over time in each country. Rearranging terms, Equation 4 can be summarized as:

Equation 5 states that the steady-state of real output per capita is driven by physical capital, human capital, labor, happiness and other variables that affect output. This provides the basis for the empirical model as follows:

where,
HAPit = happiness in country i at time t,
εit = error term or disturbance term.
Other studies supported the inclusion of capital formation (Pasara & Garidzirai, 2020; Topcu et al., 2020), human capital (Matousek & Tzeremes, 2021; Sulaiman et al., 2021) and labor force growth (Raghutla, 2020; Yıldırım & Akinci, 2021) in the real output per capita function. These three variables together with
Meanwhile, to take into account the dynamic feature of economic growth, whereby the past economic growth is influenced by the current economic growth, Equation 6 is extended with a lagged real output per capita as presented in Equation 7.

This paper transforms the non-index variables and non-ratio variables into natural logarithms. This facilitates the interpretation of the regression coefficients as elasticities.
Data
This paper employed a panel dataset of 104 countries for the period 2006 through 2018. The sample countries were chosen worldwide to the extent of data available. A total of 1,352 observations were considered.
The data on happiness were collected from the World Happiness Report (WHR) published by the United Nations Sustainable Development Solutions Network (UNSDSN). Happiness at the micro-level (also known as self-reported happiness) was measured by Cantril’s Self-Anchoring Ladder (Cantril, 1965) through the Gallup World Poll. The poll reads, “Please imagine a ladder, with steps numbered from 0 at the bottom to 10 at the top. The top of the ladder represents the best possible life for you and the bottom of the ladder represents the worst possible life for you. On which step of the ladder would you say you personally feel you stand at this time?” Since the reliability of the self-reported happiness by the individual respondents is subject to contextual bias, happiness at the macro-level is calculated by using the mean happiness of the individuals in a country. Happiness at the macro-level is proven to be less vulnerable to measurement bias (Veenhoven, 2010). Previous works recognized the high congruent validity of the Cantril’s Self-Anchoring Ladder as demonstrated in the consistency in responses to the question, irrespective of how the question is admitted (Oswald & Wu, 2010).
The data on real GDP per capita (constant 2010 USD) were obtained from the World Development Indicators (WDI) made available by the World Bank. It was computed from the real GDP divided by the midyear population. Similarly, capital formation, financial development, government expenditure, household expenditure, inflation, labor force growth, labor productivity, life expectancy and trade openness were gathered from the WDI. Capital formation, financial development, government expenditure, household expenditure and trade openness were expressed as ratios to GDP. Inflation was represented by the annual growth in Consumer Price Index (CPI).
The labor force covered individuals aged 15 years old and more who are currently: (1) employed, (2) first-time jobseekers, and (3) unemployed but pursuing a job. In this paper, the labor force growth rate in year t was calculated as the percentage change in the labor force from year t−1 to year t. Labor productivity was measured by real GDP (constant 2017 PPP $) divided by total employment in a country. The life expectancy at birth was based on the number of years a newborn would have lived if the prevailing mortality rate at the time of birth remained the same throughout his or her life. The human capital index was gathered from the Penn World Table (PWT) maintained by the University of California and the University of Groningen. According to PWT, the human capital index was constructed from both average years of schooling and Mincer’s assumed rate of return to education.
Econometric Methods
Equation 6 was first estimated and the Cook’s Distance Outlier Test was applied to identify the outliers. Consequently, 71 observations identified as outliers were excluded from the subsequent estimations in the analysis.
This paper used the Fisher-type test based on Augmented Dickey-Fuller (ADF) test for panel data to ascertain the stationarity properties of the variables. The p-values of the test were obtained using four methods, namely inverse chi-squared, inverse normal, inverse logit, and modified inverse chi-squared (Choi, 2001). The null hypothesis conjectures that the variable under consideration contains unit-roots.
Upon establishing the stationarity properties of the variables, this paper employed an improved Granger Causality Test in panel data proposed by Dumitrescu and Hurlin (2012). The test involves testing for causality between two stationary variables under consideration across all the cross-section units (countries in this case) in Equations 8 and 9.

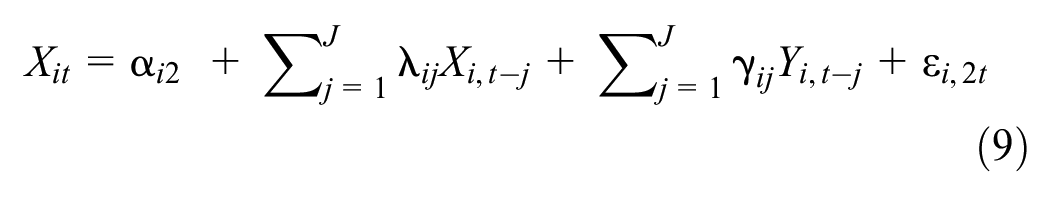
with i = 1, ……, N and t = 1, ……, T. The regression coefficients differ across countries but are constant over time.
The null and alternative hypothesis of the panel Granger causality, the Wald Test for non-causality and approximated standardized statistic,
Accordingly, the static and dynamic panel data models were considered to examine the effect of happiness on economic growth. Three static panel data models, namely the Pooled Ordinary Least Squares (OLS) Model, Random Effects Model (REM), and Fixed Effects Model (FEM) were fitted for Equation 6.
The Breusch-Pagan Lagrangian Multiplier (LM) test was used to distinguish between the Pooled OLS Model and REM (Breusch & Pagan, 1980). Rejection of the null hypothesis suggests that the country-specific effects are heterogeneous, and the REM model is preferred. The Hausman test was conducted to determine the appropriateness between REM and FEM (Hausman, 1978). The null hypothesis stipulates no correlation between the country-specific effects and the regressors, suggesting that REM is more suitable than FEM.
Additionally, a dynamic panel data model was also considered, whereby the dynamic relationship is characterized by including a lagged dependent variable, as stated in Equation 7. GMM is widely acknowledged for its robustness in alleviating endogeneity (Lahouel et al., 2019). The lagged dependent variable can be used an internal instrument in the GMM estimator (Roodman, 2009) to address endogeneity. Endogeneity is eliminated through an internal transformation, whereby the past value of the variable is deducted from its current value (Roodman, 2009). Internal transformation also enhances the efficiency of the GMM estimator (Wooldridge, 2012). This paper used the Two-Step Difference GMM with robust standard errors proposed by Arellano and Bond (1991) and further improved by Windmeijer (2005). The forward orthogonal deviations were applied whereby the mean of all future available observations of the variable is subtracted from its current value (Roodman, 2009; Ullah et al., 2018). This approach transforms the equation into first difference to eradicate the country-specific effect. To remove simultaneity bias, lagged levels of the regressor were used as instrument. Two-Step Difference GMM with robust standard errors has the advantage of avoiding downward biased standard errors and instrument proliferation (Law, 2018). The Arellano-Bond Test was conducted as a diagnostic check for first- and second-order serial correlation.
In addition, Two-Stage Least Squares (2SLS) estimations were performed as a robustness check that the empirical models were not affected by endogeneity, whereby lagged happiness was used as an instrumental variable for happiness.
Empirical Results and Discussions
Table 1 displays the empirical results of the Fisher-based Augmented Dickey-Fuller (ADF) test to assess the stationarity of real GDP per capita and happiness. The null hypothesis of all the four tests is consistently rejected (at .1% significance level) for both real GDP per capita and happiness. These two variables are stationary without further differencing.
The Results on the Stationarity Tests.

Note. The test statistics of the Fisher-based Augmented Dickey-Fuller (ADF) test are reported.
p < .001.
The results of the Dumitrescu and Hurlin (2012) Granger causality test on the relationship between happiness and real GDP per capita are reported in Table 2. The null hypothesis of real GDP per capita does not Granger-cause happiness is consistently rejected in all the tests. This finding is consistent with the well-documented evidence in the literature that the real GDP per capita affects happiness. The results also provided evidence that happiness Granger-causes real GDP per capita. This empirical finding is under reported in the literature. The test was repeated with a bootstrapping of 1,000 replications to obtain the empirical distribution of the test statistic. The test based on lag length selected using the Hannan-Quinn Information Criterion continues to indicate a bidirectional relationship between real GDP per capita and happiness. These empirical findings indicate that the determinants of economic growth must not only focus on macroeconomic factors but also recognized the neglected impact of happiness on economic growth. Hence, the inclusion of happiness in the conventional economic growth model is crucial to achieve a holistic understanding of economic growth for policy designs.
The Results on the Causality Relationship Between Happiness and Real GDP per Capita.
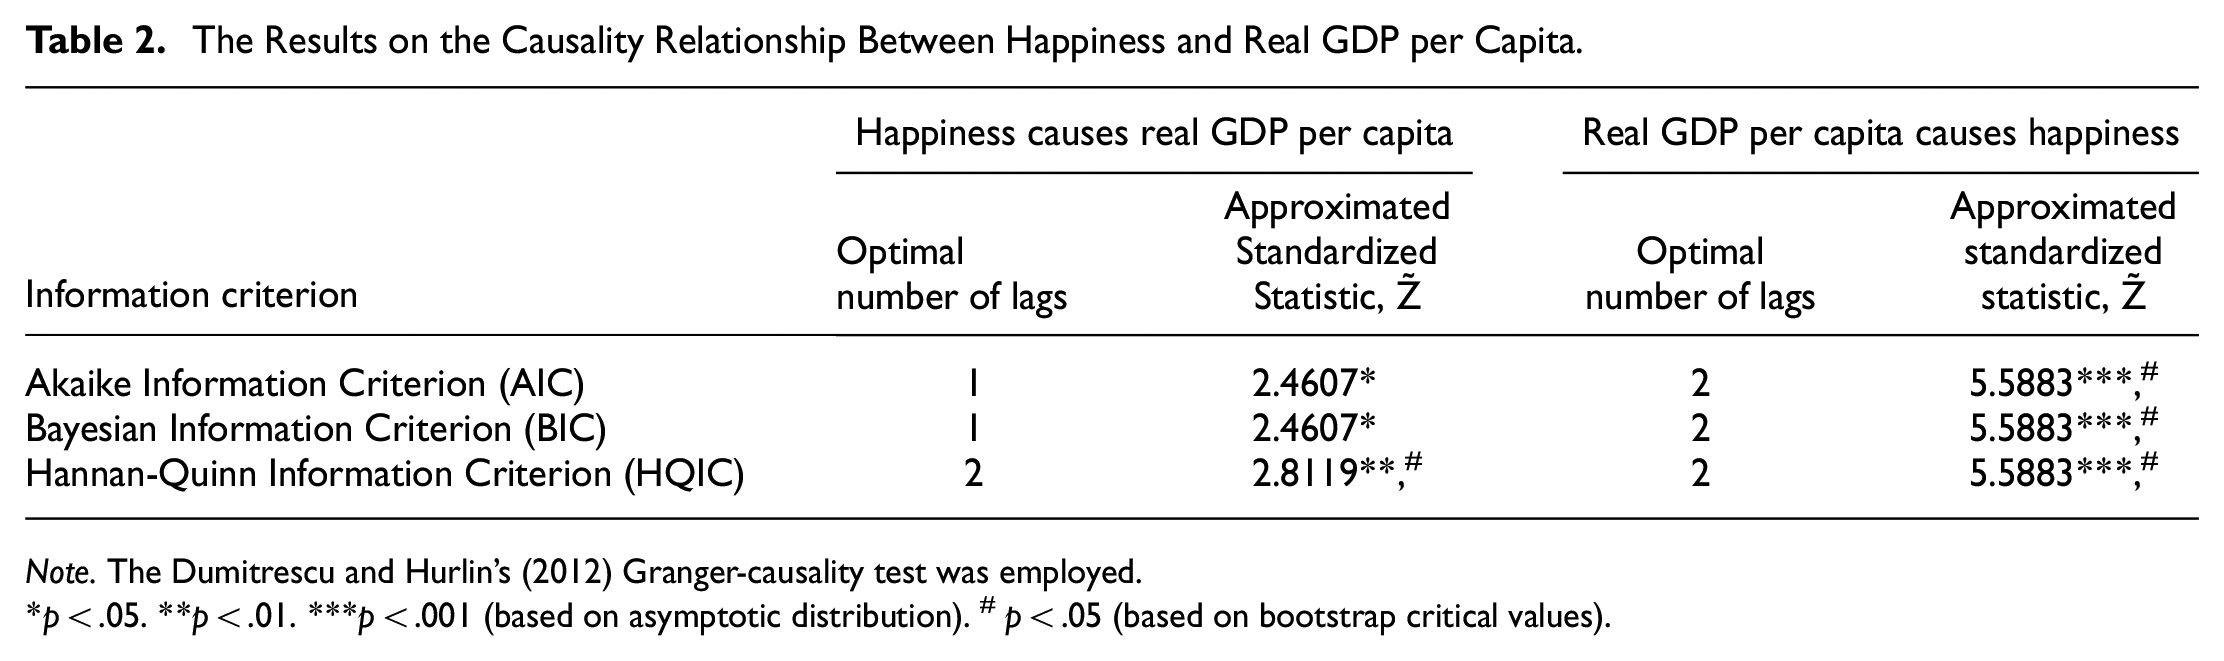
Note. The Dumitrescu and Hurlin’s (2012) Granger-causality test was employed.
p < .05. **p < .01. ***p < .001 (based on asymptotic distribution). #p < .05 (based on bootstrap critical values).
Table 3 presents the empirical results to examine the effect of happiness on real GDP per capita in 104 countries. Equation 6 was estimated using Pooled Ordinary Least Squares (OLS), Random Effects Model (REM), Fixed Effects Model (FEM), and FEM with clustered standard errors. The results are given in Model 1, Model 2, Model 3, and Model 4, respectively. Meanwhile, Equation 7 was estimated using the Two-Step Difference Generalized Method of Moments (GMM) with robust standard errors and the empirical results are reported in Model 5. Model 6 is an extension to Model 5 by incorporating lagged happiness as an additional explanatory variable.
The Results on the Effect of Happiness on Real GDP per Capita.

Note. The VIF, modified Wald test, and Wooldridge test are for checking the presence of multicollinearity, heteroskedasticity, and serial correlation, respectively. The values in parentheses are standard errors.
p < .05. **p < .01. ***p < .001.
The Breusch-Pagan Lagrangian Multiplier (LM) Test was conducted to detect the presence of the country-specific effect. The null hypothesis of homogeneity is rejected at the .1% significance level. Since the heterogeneity problem attributable to the country-specific effect is present, REM (Model 2) is more appropriate than Pooled OLS (Model 1). The Hausman Test was performed to detect the presence of endogenous regressors. The test statistic is significant at the .1% level, suggesting that FEM (Model 3) is more favorable than REM (Model 2).
Upon ascertaining the most appropriate static panel model, diagnostic checks were conducted. VIF was computed to detect multicollinearity. The mean of VIF is 2.79, suggesting that the dataset does not have a severe multicollinearity problem. The modified Wald and Wooldridge tests were performed to detect heteroscedasticity and serial correlation, respectively. The null hypothesis of the modified Wald test is homogeneity. In contrast, the null hypothesis of the Wooldridge test is no first-order autocorrelation. Therefore, both the null hypotheses are rejected at the 0.1% significance level. Since the problem of heteroscedasticity and first-order autocorrelation are present, FEM with clustered standard errors is estimated to provide country-clustered standard errors.
To deal with any endogeneity problem, Two-Step Difference GMM with robust standard errors was employed to estimate Equation 7 and reported as Model 5. In addition, Model 6 includes lagged happiness as one of the regressors. In both Model 5 and Model 6, the null hypothesis of no first-order serial correlation in first differences is rejected using the Arellano-Bond test. Meanwhile, the null hypothesis of no second-order serial correlation is not rejected.
The estimated results for all the models consistently indicate that happiness is a statistically significant determinant of real GDP per capita at the 0.1% significance level. Based on the appropriateness of the empirical models above, this paper focuses on interpreting the results of the FEM with clustered standard errors (Model 4) and the Two-Step Difference Generalized Method of Moments with robust standard errors (Model 5 and Model 6). Consistent with Kenny (1999), Li and Lu (2010), Rasheed et al. (2011), Llena-Nozal et al. (2019), and Rasiah et al. (2019), the three models consistently indicate that happiness is a statistically significant determinant of real GDP per capita. One unit increase in happiness leads to economic growth of between 1% (Models 5 and 6) to 3% (Model 4). A unit increase in happiness in the previous year adds to an additional growth of 0.5% (Model 6). The total positive effect of happiness on growth estimated in Model 6 is 1.5%. The other explanatory variables that are consistently significant in the three models are lagged real GDP per capita, capital formation, human capital, labor force growth, and labor productivity. Financial development, government expenditure, household expenditure, inflation, life expectancy, and trade openness are insignificant. Equation 6 is repeated with the 2SLS using lagged happiness as the instrument to show further that the results are not affected by the endogeneity of happiness. Happiness has a significant positive effect on economic growth.
The models were also estimated for two sub-samples consisting of 35 developed countries and 63 developing countries. The country classification is according to the United Nations Conference on Trade and Development (UNCTD) definition. Table 4 reports the results for the FEM with clustered standard errors (Model 1a and 1b for the developed and developing countries, respectively), the Two-Step Difference Generalized Method of Moments with robust standard errors (Model 2a and Model 2b), and the same method repeated with the inclusion of lagged happiness in the model (Model 3a and Model 3b). The empirical results in all the models consistently illustrate that happiness is a statistically significant determinant (at a 0.1% significance level, except for Model 1b at a 5% significance level) of real GDP per capita for both developed and developing countries.
The Results on The Effect of Happiness on Real GDP per Capita in the Developed and Developing Countries.

p < .05. **p < .01. ***p < .001.
The Arellano-Bond tests are for checking the presence of autocorrelation of order one and two. The values in parentheses are standard errors. Comparing the two sub-samples shows that the effect of happiness is larger for the developed countries. A unit increase in happiness brings about a growth of between 3% to 7.5% for developed countries and 0.6% to 1.3% for developing countries. Considering the lagged effects of happiness, the impact is 4.4% for developed countries and 1.0% for developing countries (Model 3a and 3b, respectively). The empirical results for the control variables suggest that real GDP per capita is also contributed by lagged real GDP per capita, capital formation, human capital, labor force growth, labor productivity, and trade openness. Meanwhile, household expenditure is a significant determinant for developed countries only, and financial development is a significant determinant for developing countries only. The positive effect of happiness on real GDP per capita in developed countries is about four times greater than in developing countries. When viewed from the perspective of Maslow’s hierarchy of needs (Maslow, 1943), the basic needs of individuals in developed countries were fulfilled, and they achieved the consumption threshold (Victor, 2010). They are more concerned about psychological needs and self-fulfilment than individuals in developing countries. Consistent with the Broaden-and-Build Theory, happiness sparks an expansive thought-action repertoire, which builds long-term psychological, physical, and social resources (Conway et al., 2013). As such, happiness catalyzes creativity and innovation (Mao & Weathers, 2019) and fosters the absorption capacity of technological progress (Teixeira & Queirós, 2016). Consequently, it promotes advancement in personal growth by acquiring competence development (Newman et al., 2011) and improves labor productivity (DiMaria et al., 2020), a crucial stimulant of economic growth (Rozkošová & Megyesiová, 2018). These arguments support the findings of a larger impact of changes in happiness on economic growth in developed countries.
Conclusions and Policy Recommendations
The literature documents rich evidence that higher economic growth often leads to higher happiness. This paper highlights a bi-directional relationship between happiness and economic growth. In other words, happiness can be an engine for economic growth, and its impact on economic growth is under-researched. The Granger Causality test found that happiness spurs economic growth. Accordingly, various panel models were employed to determine the effect of happiness on economic growth. Generally, economic growth of between 1% to 3% can be obtained by increasing happiness. However, the marginal return to increased happiness is higher in developed than in developing countries. Further estimation suggests that the positive effect of happiness is about four times greater in developed countries than in developing countries.
The theoretical implication of the findings in this study is that the economic growth model should not overlook the inclusion of happiness. It is crucial to include some measures of well-being in the model to avoid under-specification and variable omission bias. In terms of policy implication, policymakers should consider placing happiness with economic growth as the central tenet of government policy. The findings support the rationale for countries such as Scotland, New Zealand, and Iceland to consider the citizens’ well-being in their national development agenda. Policymakers should focus on policies that are geared toward fostering happiness. This can include improving the quality of life, providing social support, promoting work-life balance, and investing in education and healthcare. According to the “Economy of Well-Being,” policymakers should not use growth-led policies as a single compass. Moving beyond GDP by considering happiness is imperative to ensure long-term sustainable economic growth. This is owing to the significant positive spill-over effect of happiness that encourages human capital development, innovation, and labor productivity. Additionally, policymakers should further explore the conditions that enhance the impact of happiness on economic growth and the mechanisms through which happiness fosters economic growth. This will enable policymakers to devise policies tailored to specific contexts and promote sustainable economic growth. Furthermore, policymakers should recognize that the positive effect of happiness on economic growth is greater in developed countries than in developing countries. Therefore, policies that promote happiness and well-being in developing countries should be tailored to meet the specific needs and challenges of these countries.
While the positive direct effect of happiness on economic growth is confirmed, the limitation of this study is that we have not examined the conditions that boost the effect of happiness on economic growth and the channels that facilitate the mechanism. In addition, this study relies on the subjective measure of happiness, which may be subject to social desirability bias and may not reflect actual happiness. Furthermore, this study focuses on subjective well-being without considering psychological and objective well-being. Moreover, this study did not examine the potential adverse effects of over-focusing on happiness as a policy goal and neglecting important economic objectives. Therefore, studying the potential moderator of the relationship between happiness and economic growth and the mediator through which happiness stimulates economic growth would be beneficial. Future research should use objective measures of happiness from big data to supplement self-reported happiness and mitigate social desirability bias. Additionally, future research should explore the effect of subjective well-being and psychological well-being on economic growth and examine how they could be fostered through policy interventions. Future research also should investigate the potential trade-offs and synergies between happiness and economic growth to enable policymakers to identify win-win policy solutions that maximize multiple objectives. This way, policymakers could devise a policy focusing on happiness and economic growth to achieve sustainable economic growth.
Footnotes
Appendix A
The null hypothesis that X does not Granger cause Y given by Equation A.1 indicates no causality across all the countries.
However, causality may exist in some isolated countries, but not in other countries. Say causality does not exist in a sub-group of
Similarly, the null and alternative hypotheses to test if Y Granger causes X are expressed in Equation A.2.
The Wald Test for non-causality was computed for all the countries, and the average Wald statistic was obtained as Equation A.3.
Dumitrescu and Hurlin (2012) proposed the approximated standardised statistic,
where,
K = lag order.
Acknowledgements
Not applicable.
Declaration of Conflicting Interests
The author(s) declared no potential conflicts of interest with respect to the research, authorship, and/or publication of this article.
Funding
The author(s) disclosed receipt of the following financial support for the research, authorship, and/or publication of this article: This publication is partially funded by the Faculty of Business and Economics, Universiti Malaya Special Publication Fund.