
Abstract
The objective of this study was to develop and validate an instrument measuring the perception and interpretation of several distinct musical features (pitch, tonality, timing, loudness, and timbre). Therefore, we developed the Implicit Tonal Ability Test (ITAT), a listening test containing 49 multiple-choice items. A total of 233 children aged 6 to 12 participated in this study. Rasch model-based analysis of dimensionality and differential item functioning was chosen as the principal analysis strategy. Results revealed that the ITAT discriminated between high and low performers. Responses to distinct musical features behaved as one Rasch dimension in the test and reliability measures were sufficient for persons and items. The ITAT was variable across age and gender, with a positive relation between age and ITAT-score. The ITAT can be reliably used in elementary education to measure children’s musical ability for perception and interpretation of distinct musical features in just one test.
Introduction
Nowadays, listening to music might be as common as listening to language. Music is everywhere due to media such as radio, TV and online music services. Multimedia devices and music played in public spaces make it possible to instantly listen to music wherever we are. Whereas innovations in services for listening to music develop rapidly, music education curricula at elementary schools do not seem to transcend from infancy. The lack of available music ability tests for (non-English) elementary school children is likely to have a stagnant effect. After all, without proper tools to measure the quality of music education both teachers and policy makers struggle to report learning outcomes.
Assessing Tonal Abilities
Although perception of music has been extensively investigated around the world (Jones et al., 2010), development of construct validated tests for measuring individual musical abilities received little attention. Some musical aptitude tests for elementary school children were developed in the middle of the last century and are nowadays very difficult to access (Murphy, 1999). Some other tests lack a description of validation procedures and/or target only few musical features (see for an overview Law & Zentner, 2012). Barros et al. (2017) highlight that “robust psychometric studies validating available MP [music perception] scales, batteries and tools (…) remain sparse” (p. 3). Furthermore, when measuring tonal abilities, the very limited music theory knowledge of the target group must be taken into account. The objective of this study is to develop a valid measurement instrument for elementary school children to measure the level of implicit tonal abilities with regard to five distinct musical features (pitch, tonality, timing, loudness, and timbre). No theoretical musical knowledge is required to take the test. A validated musical ability test supports the development of an advanced and adaptive musical method focusing on perception and interpretation of musical features.
Listening Tests
Listening tests are widely used in elementary school education in order to assess comprehension of spoken language. In European countries these tests are usually targeting the assessment of progress in (foreign) language skills (Nikolov, 2016). Listening tests require test takers to apply skills other than listening, such as reading and writing. Furthermore, unfamiliar topics are likely to lead to additional strain in terms of the cognitive processing needed and may well lead to reliability issues in terms of the resulting test scores (Banerjee & Papageorgiou, 2016). Bostrom (2011) defines listening in a context of testing as “the acquisition, processing, and retention of information in the interpersonal context,” (p. 23). Visual support can be distracting when test takers have to listen, read, and complete questions at the same time (Ockey, 2007). An important shift in listening tasks can be observed in elementary education from an emphasis on “fun and ease” to standard-based measurement of outcomes (Rixon, 2016). This shift is not limited to foreign language programs; it is an international trend in educational assessment for accountability in public educational policies in all subjects and competencies.
Implicit Tonal Ability Test
With these considerations in mind, we developed a music listening test to assess tonal abilities for elementary school children for the domain of music. The Implicit Tonal Ability Test (ITAT) contains items that are focused on sensitivity toward five key features of the Western tonal system: pitch and intonation, tonality (tonal function, scales, and intervals), timing (tempo and rhythm), loudness, and timbre (Pearce & Rohrmeier, 2012). No music reading skills or music theoretical knowledge were required to take the test.
Development and Validation Strategy
Several statistical methods are available for assessing the quality and reliability of the multiple-choice tests: Classical Test Theory (CTT), One-Parameter Logistic Item Response Theory (1PL IRT), and Rasch Measurement Model (RMM) for dichotomous data (De Champlain, 2010). Although the underlying assumptions and techniques have much in common, RMM has a few unique assumptions that make it the preferred method for research into competency development in children of very different ages and abilities. One assumption of RMM is that the items and persons can be ordered on one unidimensional scale. Unlike CTT, this Rasch continuum makes it possible to examine each individual location of persons and items by a visual inspection, consequently indicating how well different items of the test describe the group of persons and how well individual persons fit the group (Prieto et al., 2003). The properties of RMM apply to the extent that the data fit the model. Differential Item Functioning (DIF) is used in RMM to identify items that systematically function differently per group of test takers who share the same latent ability. Only a limited number of studies have investigated DIF for listening tests in relation to the age range of the participants (Aryadoust, 2012; Banerjee & Papageorgiou, 2016; Barros et al., 2017; Geranpayeh & Kunnan, 2007; Liao & Yao, 2021; Oliveri et al., 2018) or gender (Aryadoust et al., 2011; Barros et al., 2017; Grover & Ercikan, 2017; von Zansen et al., 2022).
The research questions are:
Do the data of the Implicit Tonal Ability Test (ITAT) fit the Rasch Measurement Model?
Do distinct musical features behave as one Rasch dimension on the ITAT?
Can the ITAT reliably discriminate between high and low performers?
Is the Rasch Measurement Model of ITAT variable across age and gender?
Method
Participants and Sample Size
From a combined total of 236 enrolled students, data were collected from 233 children (122 females) between ages 6 and 12 from two elementary schools in the Netherlands. Six children turned 12 at the moment of participation and are therefore combined with the 11-years old in all analyses. Participants and their parents were informed that participation in the study was voluntary and that their individual data would be kept confidential. Parents of children aged 6 to 12 filled out consent forms prior to participating in the study. Three parents had opted to not give informed consent for this research. Thus, inclusion criteria entailed only enrollment in elementary school (being aged 6–12) and obtaining informed consent from parents. No other exclusion criteria were applied. No musical skills or knowledge were required as the ITAT is developed for implementation in an educational curriculum to determine musical abilities. As such no expectations exist on students’ current musical abilities. Our sample is non-random as it is only based on two elementary schools established in the Netherlands. The sample size in this study is sufficiently large to predict item calibrations or person measures stable within 1/2 logit with a confidence interval of 99%. J. M. Linacre (2022f) advises a minimum sample size range of 108 to 243 for this required degree of stability and reliability. Approval for the research was obtained on 30 May 2018 from the Research Ethics Committee (cETO) of the Open University of the Netherlands (approval registration code U2018/03755/HVM).
Measurement Instrument
Musical ability tests based on a psychometric approach of defining music and musicality date back to the early 20th century (e.g., Seashore, 1919, 1938, 1947), subsequently making musical abilities objectively measurable. Tests stemming from this approach usually focus on one or two musical features, such as pitch, timing, or tonality. The Swedish Musical Discrimination Test by Ullén et al. (2014) and The Montreal Battery of Evaluation of Musical Abilities by Peretz et al. (2013) were used as a starting point for developing our Implicit Tonal Ability Test (ITAT). Our approach differs from existing tests in that perception and interpretation of no fewer than five distinct musical features are measured with just one test. We measure pitch (seven items) and intonation (seven items), tonality (21 items, equally divided over categories tonal function, scales, and intervals), timing (two rhythm and two tempo items), loudness (three items), and timbre (seven items). The ITAT contained 49 multiple-choice test items with four possible answers, from which only one is correct. A correctly answered item was awarded one point, thus test results could range from 0 to 49. For each item a short audio clip was created with a length between 10 and 30 s. A Cohen’s κ of .970 (SE = 0.021, p < .0005) was calculated based on a second assessment of the multiple-choice answers of 25% of the sample (n = 58) by the first author. A mixed within-subject design (two levels of gender and six levels of age) was used to answer the third and fourth research question. In order to avoid possible order effects three versions of the ITAT were used that differed in item order by subscale. One ITAT version was used per test session of four to six students. A one-way ANOVA indicated no significant differences for the total ITAT score between the three test versions (F(2,230) = 1.168, p = .313).
Prior to conducting this research, an initial test of the ITAT was performed in 2018 on a group of 12 students, from which we found that some questions were incorrectly interpreted by students. Accordingly, the wording was simplified.
Procedures
All data were collected by the first author over a 6-month period, from October 2019 to March 2020. The test was administered in groups of up to six participants in an otherwise unused classroom, depending on the necessary age-related procedural help. Younger participants (aged 6–7) were placed in smaller groups of four to provide additional procedural guidance (such as repeating and clarifying procedures), whereas older students (aged 8–12) were tested groups of six due to their more independent comprehension abilities. Procedural guidance entailed reading out loud the question on the test, indicating which question number was being tested, and confirming that a sound sample corresponds to a question number. Otherwise no support was provided. The first author ensured that students were seated sufficiently apart so they could not read the answers of other students. Students could choose from four response options (including an “I don’t know” alternative). Only a correct answer contributed to the ability score. The “I don’t know option” was treated as a wrong answer. This true-false approach therefore led to dichotomous data. Completing the test took 45 min, including two 5-min breaks after item 21 and item 35. Visual stimuli (pictures of fruits, vegetables, and animals) on the test were used to help participants keep track of the right item order and were referred to during verbal procedural guidance. Pictures of three mascots (named Tim, Tom, and Tina) were included in the test, and sound samples were presented as being played by a mascot during the test. For example, “Tim, Tom and Tina each play a note. First, you’ll hear Tim, then Tom and lastly Tina. Who is playing the highest note?” Thereafter, the students had to identify which mascot was playing—for example—the lowest tone or the highest tone. To avoid potential biases, the mascot’s correct and incorrect sound samples were randomized and children were informed that mascots were equally “good.” Children were advised to avoid picking a favorite mascot. Prior to the test, participants were asked to provide their age and gender. Participants received a small present after participation.
Data Analyses
The Rasch Model
A Rasch model-based analysis of dimensionality and differential item functioning (DIF) was chosen as principal analysis in this study. WINSTEPS version 4.5.4 software was used to make calculations (J. M. Linacre, 2020). Multi-item interval scales were calculated by the Rasch model, resulting in ITAT items and participants placed on a continuum. The location of each item and each participant on the continuum suggests respectively the difficulty and ability measures, expressed in a log odds unit (logit) interval scale. A unidimensional line is separating items and participants (see Appendix B). For many educational variables 1.0 logit is equivalent to 1 year of educational growth (J. M. Linacre, 2022a).
The data should fit the Rasch model in order to get accurate results. Two measures were used to determine the extent to which the ITAT items and the participants fit the RMM: mean square (MNSQ) infit and MNSQ outfit, both t-standardized statistics (J. M. Linacre, 2002, 2022b). According to Wright and Masters (1982), the infit MNSQ is sensitive to inliers, whereas outfit MNSQ is sensitive to outliers. The expected MNSQ values in the RMM are always expected to be 1.0. Fit values between 0.5 and 1.5 are considered to be an acceptable range (J. M. Linacre, 2022b). In social science, Bond and Fox (2007) advise a range of 0.60 to 1.40. For this study we apply a range of 0.80 to 1.20 as advised by D. Linacre (2021). Several Rasch scale calculations were made with different subsets of ITAT items, in order to investigate possible improvements of the reliability value for participants and items.
Reliability
The consistency responses examined by the RMM interpretation on person (the elementary school children) and item (ITAT) reliability are explained with Kuder-Richardson (KR-20) coefficients, as the formula for KR-20 does not require the assumption that all items are of equal difficulty (Fraenkel et al., 2012), and is suitable for dichotomous data. According to Fraenkel et al. (2012), for research purposes the reliability coefficient should be at least .70. An α-value range of .70 to .80 is reported for most classroom tests.
Test of Dimensionality
Multidimensionality in data is usually too subtle to be diagnosed with item-level fit statistics. After all, the secondary dimension must be big enough to influence the measurement; at least the strength of two items (J. M. Linacre, 2022c). Principal component analysis of linearized Rasch residuals (PCAR) was used to investigate the dimensionality of the test data. PCAR includes all the variances when computing component size, including error variance which is central to Rasch measurements (J. M. Linacre, 2022b).
A dimensionality analysis of the data was conducted to ascertain whether test items (ITAT and participants) target the same latent trait. If test items do target the same latent trait, then the data is unidimensional. Several simulated data files were produced to investigate the stability of measures, distribution of fit statistics and amount of statistical bias. If the data fit RMM then only random noise would be analyzed by conducting a PCAR. Accidental correlations in the residuals can be up to 2 to 3 items strong. Standardized residual contrasts were computed to investigate the nature of these correlations, providing a disattenuated correlation value. This value indicates what the Pearson correlation value would be if measured without error. A disattenuated correlation value of >.70 suggests that the model is measuring the same construct.
Differential Item Functioning
Unidimensionality of the data is a necessary precondition to Differential Item Functioning (DIF) analysis in Rasch (J. M. Linacre, 2022a). An analysis of DIF was conducted to indicate whether one group of participants is scoring better than another group of participants on ITAT items, after adjusting for the overall scores of the participants. Uniform Differential Item Functioning (UDIF) and Non-Uniform Differential Item Functioning (NUDIF) analyses were conducted for both age and gender. For UDIF the amount of DIF is constant across ability levels, whereas for NUDIF the amount of DIF varies across ability levels.
Non Rasch-Based Analyses
Non Rasch-based analyses were performed in SPSS for Windows, version 26. Descriptive statistics were used to explore given answers to test items of the ITAT. An independent t-test was run to determine if there were differences in ITAT score based on gender. Multiple one-way ANOVAs were conducted to test for the effect of age on ITAT score and each musical feature subscale.
Results
The first research question was: Do the data of the Implicit Tonal Ability Test (ITAT) fit the Rasch Measurement Model? Overall, results suggested that the ITAT data fit the RMM. A visual inspection indicated that the ITAT differentiated well at all levels, except for the seven highest scoring participants (N = 233). Four to five items of the ITAT (mainly targeting perception of rhythmical patterns and loudness) were too easy for all participants. Descriptive statistics for the ITAT items are displayed in Table A1 in Appendix A. A unidimensional scale for both participants and items was constructed based on person ability and item difficulty measures (see Figure B1 in Appendix B). Descriptive demographic statistics of participants are displayed in Table A2 in Appendix A.
Dimensionality Analysis
The second research question was: Do distinct musical features behave as one Rasch dimension on the ITAT? Overall, results suggested that items behaved as one Rasch dimension. The difference in observed and expected raw explained and unexplained values was 0.1%, indicating that the computation of the Rasch difficulty measures was successful (J. M. Linacre, 2022a). The Rasch dimension explained 24.0% of the variance in the data (eigenvalue = 15.4). The amount of variance explained by the Rasch dimension is usually irrelevant; it is not important what the Rasch dimension does, but what the other dimensions do to the model. The large size of unexplained variance in the data, 76.0%, indicated that the spread of the person and item measures did not explain as much variance as the randomness in the data. It was, however, almost the same as the amount of unexplained variance (75.9%) that was expected if the data fitted the Rasch model perfectly.
Loading patterns of items on the first hypothesized contrast in the linearized residuals are displayed in Figure 1. Test items have not formed clusters or patterns, since they scatter in different regions of the map, irrespective of their difficulty measure. Therefore, this analysis supports the presumption that the data set is unidimensional.

Overview of the standardized residual first contrast of the ITAT.
The largest secondary dimension, the first contrast in the residuals, explained 3.8% of the variance (eigenvalue = 2.4). This was much smaller than the 17.1% explained by the test items (eigenvalue = 11.0) and smaller than the 6.9% explained by person ability measures (eigenvalue = 4.4). In the first contrast of the original data, the strength of a possible second dimension was 2.4 items. This is considered an accidental correlation, since the disattenuated correlations between clusters 1–3, 1–2, and 2–3 had values of 1.00, 1.00, and 0.84, respectively (J. M. Linacre, 2022c). This suggested that there was no dimensionality beyond the Rasch dimension, as was also suggested in several simulated data sets.
Reliability and Separation
The third research question was: Can the ITAT reliably discriminate between high and low performers? Overall, results suggested the ITAT could discriminate the sample into two ability levels. Furthermore, the ITAT items showed a robust hierarchy in difficulty levels. The reliability for persons on the ITAT had a value of α = .76. This value shows how reproducible the persons’ statistics or parameters are if the same or a similar ITAT test was given to the same group of persons. The separation value for persons was 1.77. This value indicates how many levels of ability RMM has been able to identify. It suggested that the test identified 1.77 statistically significantly different groups. This indicated that the pupils’ abilities are at best approaching two group levels.
Likewise, also the ITAT items were separated or differentiated in terms of their difficulty level. The reliability for ITAT items had a value of α = .98. This value indicates how reproducible the ITAT item statistics or parameters are if the same items were used in the same or a similar test. The separation value for items was 6.56, meaning the test identified over 6 statistically significantly different levels of item difficulty in the data. This indicated that the ITAT items matched several ability levels. Removing items with high outfit MNSQ values did not lead to a meaningful improvement of α -value for persons’ reliability, and even lowered the person separation value.
Variability
The fourth research question was: Is the Rasch Measurement Model of ITAT variable across age and gender?
ITAT and Age
Overall, results suggested that ITAT items were fair for all ages based on (N)UDIF analyses and DIF measures. Furthermore, there was a positive relation between age and implicit tonal ability scores. All musical features except loudness showed this relation; strongest effects were found between children aged 6 versus 9 to 12. A one-way ANOVA was conducted to determine if ITAT scores were different for groups with different ages. There was one genuine outlier, as assessed by boxplot; data were normally distributed for all ages, as assessed by Shapiro-Wilk’s test (p > .05); and there was homogeneity of variances, as assessed by Levene’s test of homogeneity of variances (p = .550). The ITAT score increases gradually from age 6 to age 11–12 (see Table 1 for statistical measures). The ITAT score was statistically significantly different for age, F (5, 227) = 22.664, p < .0005, ω2 = 0.333. Tukey post hoc analysis revealed that the increase of ITAT score between ages 6–7 and 8–12 was statistically significant (p < .0005).
Average Number of Correct Answered ITAT Items Sorted by Age.

Note. N = 233.
Age 11 and 12 are combined.
Multiple one-way between subjects ANOVAs were conducted to compare the effect of age on perceiving musical features in elementary school children aged 6 to 12. The analyses of variance per musical feature showed that the effect of age was significant on perception and interpretation of (1) pitch, F (5,227) = 10.708, p < .0005, ω2 = 0.191, (2) intonation, F (5, 227) = 11.833, p < .0005, ω2 = 0.207, (3) tonality, F (5,227) = 3.072, p = .011, ω2 = 0.063, (4), scales, Welch’s F (5,105.526) =6.224, p < .0005, ω2 = 0.114, (5) (harmonic) intervals, F (5,227) = 4.991, p < .0005, ω2 = 0.099, (6) timing, F (5,227) = 4.077, p = .001, ω2 = 0.082, and (7) timbre, F (5, 227) = 8.650, p < .0005, ω2 = 0.160. The effect of age on loudness was not significant, Welch’s F (5,104.047) = 1.994, p = .086, ω2 = 0.061.
Rasch DIF Analysis for Age
All ITAT items were explored using UDIF analysis for age. Items 5, 46, and 47 were more difficult for age 6 than expected, whereas items 11, 12, 21, 22, 23, and 44 were easier than expected. Item 3 was more difficult for age 7 than expected, whereas items 12, 20, and 40 were easier than expected. Item 29 was more difficult than expected for age 8 and item 45 was more difficult than expected for age 9. Item 47 was easier than expected for age 10. Item 13 and 17 were more difficult than expected for age 11 to 12, whereas item 46 was easier than expected for age 11 to 12. Statistical measures and an explanation of abbreviations are displayed in Table 2.
Statistically Significantly Different DIF Values for ITAT Items Sorted by Age.
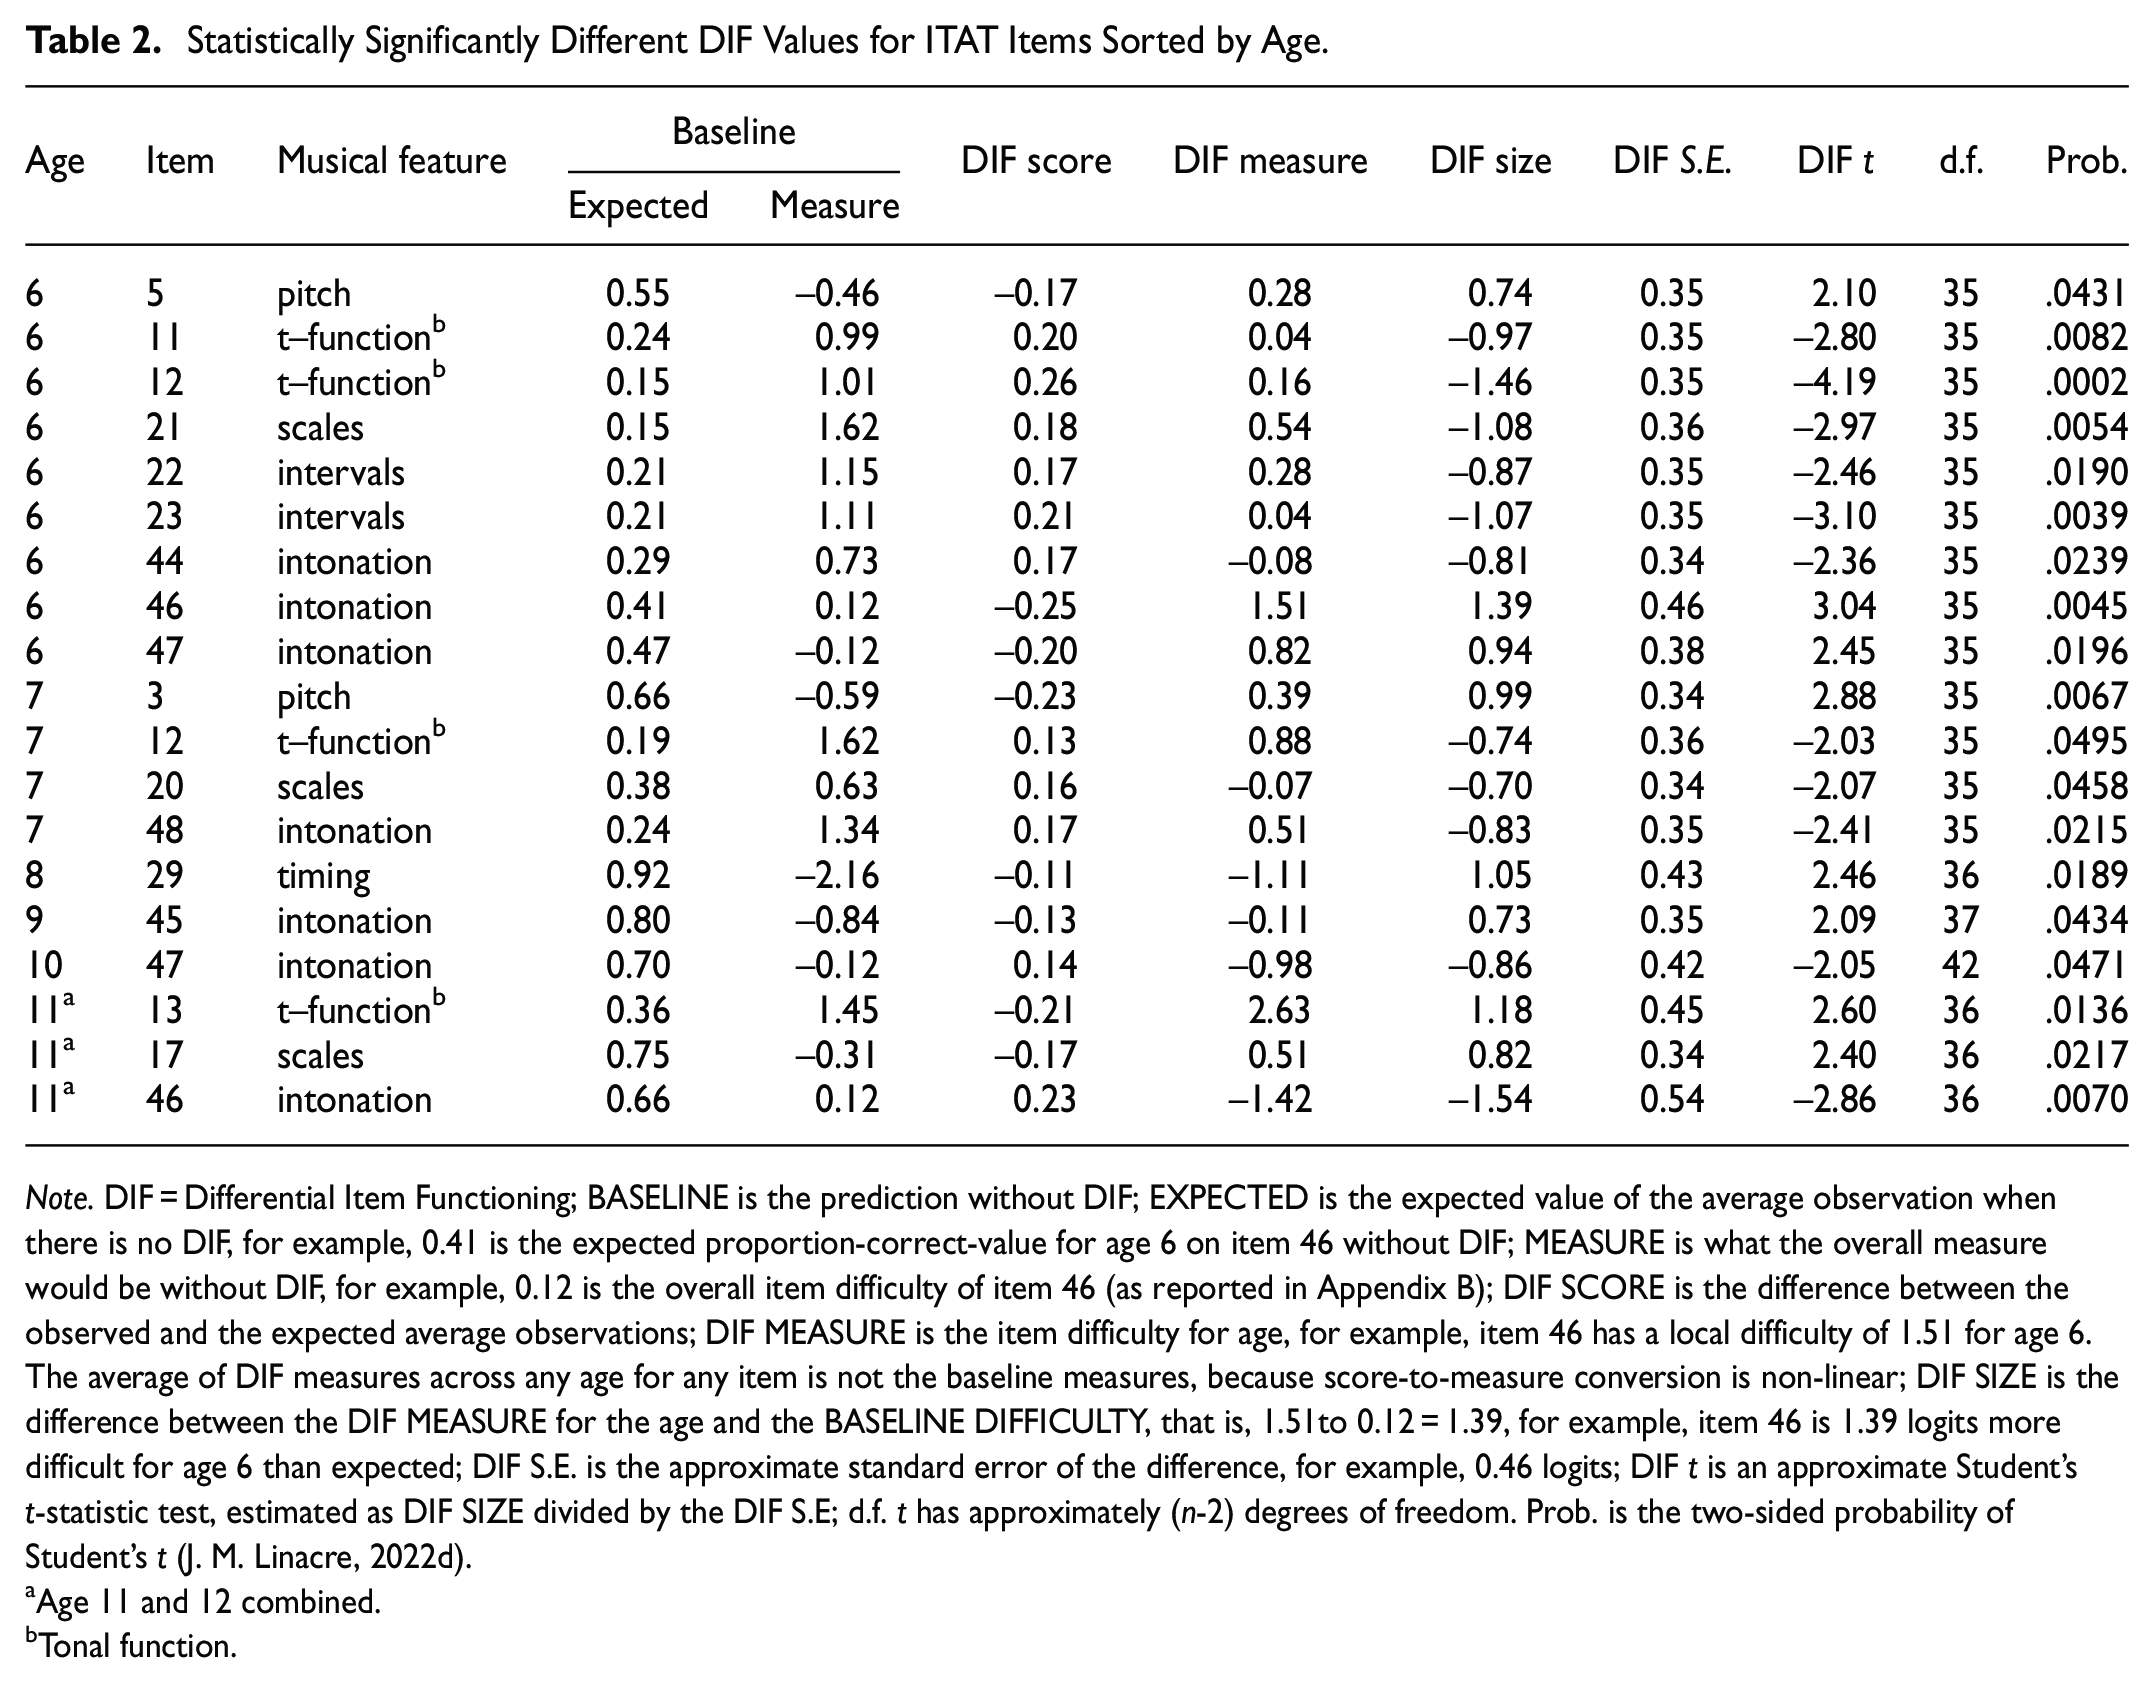
Note. DIF = Differential Item Functioning; BASELINE is the prediction without DIF; EXPECTED is the expected value of the average observation when there is no DIF, for example, 0.41 is the expected proportion-correct-value for age 6 on item 46 without DIF; MEASURE is what the overall measure would be without DIF, for example, 0.12 is the overall item difficulty of item 46 (as reported in Appendix B); DIF SCORE is the difference between the observed and the expected average observations; DIF MEASURE is the item difficulty for age, for example, item 46 has a local difficulty of 1.51 for age 6. The average of DIF measures across any age for any item is not the baseline measures, because score-to-measure conversion is non-linear; DIF SIZE is the difference between the DIF MEASURE for the age and the BASELINE DIFFICULTY, that is, 1.51to 0.12 = 1.39, for example, item 46 is 1.39 logits more difficult for age 6 than expected; DIF S.E. is the approximate standard error of the difference, for example, 0.46 logits; DIF t is an approximate Student’s t-statistic test, estimated as DIF SIZE divided by the DIF S.E; d.f. t has approximately (n-2) degrees of freedom. Prob. is the two-sided probability of Student’s t (J. M. Linacre, 2022d).
Age 11 and 12 combined.
Tonal function.
Two strata for each age were defined to investigate NUDIF: the upper ability age group and the lower ability age group. In total 588 NUDIF analyses (12 [6 lower ability groups and 6 higher ability groups] × 49 [ITAT items]) were examined. A total of 21 analyses (3.57%) were statistically significant at p < .05 or p < .01. Items 9, 46, and 47 were more difficult than expected for age 6 with a higher ability, whereas items 11, 12, 13, 22, and 23 were easier than expected. Item 3 and 5 were more difficult than expected for age 7 with a higher ability, whereas items 12, 20, 39, and 48 were easier than expected. Item 28 was easier than expected for age 8 with a higher ability, and item 20 was easier than expected for age 8 with lower ability. Item 12 was more difficult than expected for age 10 with a lower ability. Item 13, 17, and 20 were more difficult than expected for age 11 to 12 with a lower ability, whereas item 46 was easier than expected for age 11 to 12. Statistic measures are displayed in Table 3.
Statistically Significantly Different DIF Values for ITAT Items Sorted by Age and Ability Level.

Note. Ability: 1 = higher ability level, 2 = lower ability level. For an explanation of abbreviations see Note in Table 2.
Age 11 and 12 combined.
Tonal function.
Idiom of consonance.
The aforementioned results indicated that the ITAT is variable across age. For the youngest children, hearing intonative differences was more difficult (items 44, 46, and 47), while interpreting the size of intervals (items 22 and 23) and recognition of out-of-key tones (items 11 and 12) as well as the chromatic, Lydian, and Phrygian scales (items 17, 20, and 21) was easier for them.
ITAT and Gender
Overall, results suggested that ITAT items were fair for both boys and girls based on (N)UDIF analyses and DIF measures. An independent-sample t-test was run to determine if there were differences in male and female ITAT scores. There were no outliers in the data, as assessed by inspection of a boxplot. The difference scores for male and female were normally distributed, as assessed by Shapiro-Wilk’s test (p > .05) and visual inspection of Normal Q-Q Plots. There was homogeneity of variances, as assessed by Levene’s test for equality of variances (p = .890). The ITAT score for males (M = 27.46, SD = 6.36) was lower than for females (M = 29.46, SD = 6.21). Male mean ITAT score was 2.00, 95% CI [−3.62, −0.37] lower than female mean ITAT score. There was a statistically significant difference in mean ITAT score between males and females, t(2321) = −2.427, p = .016; d = 0.318.
Rasch DIF Analysis for Gender
A UDIF was computed for gender (statistic measures are displayed in Table 4). One DIF item was identified: item 10 (tonal function) was more difficult for males than for females. The DIF contrast of −0.73 is considered a large effect (Zwick et al., 1999).
Statistically Significantly Different DIF Values for ITAT Items Between Genders.

Note. DIF MEASURE is the difficulty of this item for one gender, with the other gender held constant, for example, 0.66 is the local difficulty for females of item 10. The more difficult, the higher the DIF measure; DIF S.E. is the standard error of the DIF MEASURE; DIF CONTRAST is the “effect size” in logits, the difference between the two DIF MEASURES, that is, size of the DIF across the two classifications of persons, for example, 0.66to 1.39 = −0.73 (in logits). A positive DIF contrast indicates that the item is more difficult for the gender listed in the lower table line (=male). JOINT S.E. is the standard error of the DIF CONTRAST; Mantel-Haenszel DIF test for dichotomies is computed (Mantel & Haenszel, 1959). Chi-square is the Mantel-Haenszel (MH) for dichotomies with 1 degree of freedom. Prob. is the probability of observing these data (or worse) when there is no DIF based on a chi-square value with 1 d.f; Size CUMLOR (cumulative log-odds ratio in logits) is an estimate of the DIF. DIF contrast ≥0.64 logits is considered a moderate to large effect; Active Slices is a count of the estimable stratified cross-tabulations used to compute MH (J. M. Linacre, 2022e).
Two strata within each gender group were defined to investigate NUDIF: the upper ability and the lower ability. In total 196 NUDIF analyses (2 [lower ability groups] × 2 [higher ability groups] × 49 [ITAT items]) were examined (statistical measures are displayed in Table 5). A total of 11 analyses (5.61%) were statistically significant at p < .05 or p < .01. Item 12 and 23 functioned in favor of higher ability males, whereas item 20 functioned against lower ability males. Items 12, 13, and 48 functioned in favor of high ability females, whereas item 5 functioned against them. Item 2 functioned in favor of lower ability females, whereas items 12, 13, and 48 functioned against them.
Statistically Significantly Different DIF Values for ITAT Items Sorted by Gender and Ability Level.

Note. Ability: 1 = higher ability level, 2 = lower ability level.
Tonal function.
The aforementioned results indicated that the ITAT is variable across gender. Perceiving out-of-key tones seemed to be especially difficult for low ability males. In addition, it was easier for high ability males to recognize the Lydian scale and the size of dissonant intervals. Finally, high ability females recognized out of tune harmonies better than low ability females.
Discussion and Conclusion
This study set out to investigate the development of a reliable listening test for perception and interpretation of several distinct musical features by elementary school children aged 6 to 12.
Test Reliability and Dimensionality Analyses
Results indicated that the ITAT met criteria for internal reliability of classroom tests. Dimensionality analysis indicated that responses to ITAT items are not contaminated by off-dimensional structures. Consequently, implicit tonal ability level can be assessed with a test model in which several distinct musical features are treated as one latent dimension. Based on the number of logits, 6 difficulty levels were identified, being the equivalent of 6 years development in education (J. M. Linacre, 2022a). Our findings raise a question that deserves a closer look: why could the ITAT distinguish only 2 ability levels while 6 item difficulty levels were identified? It is unlikely that a low person separation originates from actually few skill levels existing in the population. After all, previous research on musical perception skills found drastic improvements at specific ages for perception of different musical features (see Corrigall & Schellenberg, 2015, for an overview). However, we should keep in mind that skills were measured in participants without training in musical perception. Future research should investigate whether person separation indeed increases when ITAT is administered to trained participants. The low person separation of the ITAT was likely caused by the instrument being less sensitive to distinguish between high and low performers. The easy solution to obtain higher person separation by adding more items can, however, do more harm than good: it might improve the separation value, but would make the test also considerably longer. Consequently, fatigue and indifference could yield unreliable responses from young participants. In contrast, the current ITAT test length is within expectations of Dutch children in terms of number of items and testing time. For example, the semiannual listening comprehension state exams for first graders contains 46 items spread over two segments of 45 min (Van Berkel et al., 2013). However, increasing the person separation to at least 3 ability levels will significantly increase the practical applicability of the test in elementary education. In principle, removing items can also be an option for improving validity or reliability measures. However, J. M. Linacre (2002) recommends this procedure only in case an individual item has an infit and outfit measure outside the range of 0.5 to 1.5. All ITAT items fall within this range (see Table A1).
Variability Across Age and Gender
This study found a gradual increase in musical perception ability by age, with a statistically significant increase between age 6 and 7, and 8 and 12. The positive relationship between age and all musical features but loudness might not come as a surprise. However, tonal ability development by age is erratic and difficult to predict from other variables. The unpredictable nature of differences in individuals’ implicitly acquired tonal abilities is in line with previous research (Schellenberg & Weiss, 2013). In our study this becomes apparent in the relatively high number of items that are easier than expected for children aged 6 compared with older children. There is no evidence that the ITAT is unfair to younger or older children despite considerable individual differences between children’s perception abilities (Table 3). However, counting out-of-key tones in a two-part piano fragment was apparently more difficult for boys than for girls (see item 10 in Table 4). As results indicate that an item shows DIF, it does not necessarily imply bias (Liao & Yao, 2021). However, such an item should be further examined for appropriateness. In the event of a retest of the ITAT, the above item might be eligible for substitution. DIF across age and gender is not self-evident in music perception tests. Previous research by Barros et al. (2017) showed no DIF based on age or gender on an 80-item perception test among children (age range 6–13).
Practical Implications, Limitations, and Future Research
Individual results and classroom averages per musical feature may help teachers to add additional and specific listening exercises to their curriculum, aimed at strengthening musical perception, increasing musical awareness, and training effective listening skills. The ITAT can also be used to investigate in detail which tonal abilities develop at which age. This first version focuses on a broad age group and can be further refined in the future. As is the case in other (early) academic skills in elementary school settings, children’s working memory and non-verbal reasoning as well as linguistic abilities may have affected the findings, as previous research found significant associations between musical perception and cognitive abilities (e.g., Ireland et al., 2018; Schellenberg, 2015; Swaminathan et al., 2017). This study is limited in scope because participants were not randomly selected from a large international population. Additional research could focus on a larger and multi-country scope to augment generalizability of the findings. For this a larger and preferably international sample is required. Depending on how the current easy items behave in a more internationally representative sample, these may also need to be adjusted. However, care should be taken because removing easy items can lead to undesirable effects, such as an impact on the measurement precision of test takers with higher test performance (Lin, 2018). Our ITAT test attempted to measure the musical abilities of elementary school aged children, which was successful according to the Rasch analyses. We invite the research community to further investigate and improve the ITAT, by examining and potentially improving or replacing strikingly behaving and poorly fitting items.
Conclusion
Even though musical features differ widely, the ITAT can be best described as containing one Rasch dimension and is, therefore, suitable to capture implicit tonal abilities in one listening test, expressed in one sum score. The one-dimensionality makes it possible to test implicit tonal abilities of elementary school students easily and validly in less than 1 hr of class. The ITAT can reliably discriminate between high and low performers within the same age group, although improvement of person separation is desirable. Furthermore, the ITAT is variable with regard to age and gender. An implication of this is that teachers can better segregate students into similarly-performing groups and place them into a curriculum that matches their level of music understanding.
Supplemental Material
sj-docx-1-sgo-10.1177_21582440231199041 – Supplemental material for Assessing Tonal Abilities in Elementary School Children: Testing Reliability and Validity of the Implicit Tonal Ability Test Using Rasch Measurement Model
Supplemental material, sj-docx-1-sgo-10.1177_21582440231199041 for Assessing Tonal Abilities in Elementary School Children: Testing Reliability and Validity of the Implicit Tonal Ability Test Using Rasch Measurement Model by Zyxcban G. Wolfs, Saskia Brand-Gruwel and Henny P. A. (Els) Boshuizen in SAGE Open
Footnotes
Appendix A
Due to the dichotomous nature of the data, easier items have lower mean values, whereas difficult items show higher mean values. Likewise, the shape of the dichotomous data is asymmetric, resulting in long distribution tails and skewness values that are high towards the side with a lower frequency. Table A1 also shows the ITAT item difficulty and MNSQ statistics. The measures column shows the item difficulty level in logits. Item 12 was most difficult with a measures value of 1.62 (+1.3 logit) and item 31 was easiest with a value of −2.58 (−2.9 logits). Erratic outfit MNSQ statistics were observed in items 12 and 48, but all infit MNSQ statistics fell within the acceptable range for high stake tests.
Table A2 shows descriptive statistics by demographics of participants playing an instrument, taking singing lessons, both playing an instrument and taking singing lessons as well as not being engaged in music education at all. Descriptives are provided for age, gender, and school.
Appendix B
Acknowledgements
The authors wish to thank all 233 children, their parents, and their teachers who took part in or cooperated with this study.
Data Availability Statement
Declaration of Conflicting Interests
The author(s) declared no potential conflicts of interest with respect to the research, authorship, and/or publication of this article.
Funding
The author(s) disclosed receipt of the following financial support for the research, authorship, and/or publication of this article: This work is part of the research program Doctoral Grant for Teachers with project number 023.012.020, which is financed by the Dutch Research Council (NWO).
Ethics Approval Statement
Approval was obtained from the Research Ethics Committee (cETO) of the Open University of the Netherlands (approval ID U2018/03755/HVM).
Supplemental Material
Supplemental material for this article is available online.
References
Supplementary Material
Please find the following supplemental material available below.
For Open Access articles published under a Creative Commons License, all supplemental material carries the same license as the article it is associated with.
For non-Open Access articles published, all supplemental material carries a non-exclusive license, and permission requests for re-use of supplemental material or any part of supplemental material shall be sent directly to the copyright owner as specified in the copyright notice associated with the article.