
Abstract
In addition to the use of grade point average and academic background to assess candidates for admission into professional graduate programs, many university programs today use structured interviews to further assess candidates’ suitability. The Master of Occupational Therapy program at the University of Manitoba has in recent years adopted a standardized interview designed to capture specific psychometric characteristics of applicants considered relevant for scholarship in Occupational Therapy professional program. This study applied the Rasch Analysis Model to test the reliability and validity of the structured interview to determine whether the tool is invariant and fits the Rasch probabilistic model. A three-cohort interview data from 258 applicants were analyzed. The result indicates that the tool has high reliability (person separation index [PSI] = 0.8715), and was invariant across the participants. This Rasch analysis result supports the use of structured interview as an additional tool for students’ admission.
Keywords
Introduction
The process of selecting students into health professional education programs has become increasingly competitive. The admission committees of these programs have to continuously re-examine their selection criteria and procedures to ensure that the best qualified candidates are selected (Till, Myford, & Dowell, 2013; Timer & Clauson, 2011). Traditionally, admission committees for graduate programs select students based on their grade point average (GPA) obtained at the undergraduate or prior entry degree/certificate program. However, most selection processes for graduate-level programs today consider a wider range of criteria, which include entry GPA, a brief written statement, professional reference letters, and an individual interview (Dowell, Lynch, Till, Kumwenda, & Husbands, 2012; Roberts et al., 2014). However, with the increasing number of qualified applicants and limited number of spaces in programs, the task has become more challenging (Salvatori, 2001; Timer & Clauson, 2011).
In the health profession, there are many stakeholder groups with diverse expectations for health care graduates. For instance, regulatory and professional bodies have a set of competencies they expect graduates entering into the profession to possess. Program graduates have to sit for professional examinations to further assess their competencies before they can be licensed to practice. Also, governments and society at large expect certain levels of professionalism and skills from health profession graduates. In the context of these diverse expectations, admission committees have to ensure that they select students who do not only have high GPAs but are most likely to succeed in the program and become successful clinicians (Kuncel, Hezlett, & Ones, 2001; Salvatori, 2001; Timer & Clauson, 2011). Hence, the selection criteria are designed to reflect expectations of a wide range of stakeholders, which includes the university, employers, professional bodies, governments, and society at large (Puddey & Mercer, 2014). Health profession programs strive to ensure that students admitted into the programs have the potential to graduate with high GPA, and demonstrate the competencies for effective clinical practice as established by their respective professional associations (Roberts et al., 2014; Salvatori, 2001). These expectations have necessitated the emergence of stringent admission procedures intended to select the best qualified candidates.
The GPA is probably the most widely used admission criteria, and there are several reasons for this. The most obvious reason is the predictive value of the GPA for post admission performance. A study by Wilkinson et al. (2008) found the GPA, admission tests, and interview scores to be modest predictors of performance in graduate medical school courses, with GPA being the strongest predictor followed by interview score and admission test results. Other studies (Blackman & Darmawan, 2004; Kuncel et al., 2001) found that, although the GPA scores were stronger predictors of academic performance, the relative predictive strength diminishes as a course progresses. Similarly, Lamadrid-Figueroa, Castillo-Castillo, Fritz-Hernández, and Magaña-Valladares (2012) have reported that general admissions criteria (GPA, interview score, and letters of recommendation) were strong predictors of academic grades but not of graduation. Some studies, such as Puddey and Mercer (2014), have shown interview and admission test scores to be relatively weak as predictors of a student’s academic performance. However, most studies (Eva, Rosenfeld, Reiter, & Norman, 2004; Salvatori, 2001; Wilkinson et al., 2008) have shown that previous academic performance, primarily measured in terms of the GPA, remains a consistent predictor of academic success.
In an effort to assess valued personal characteristics of candidates into graduate programs, Lamadrid-Figueroa et al. (2012) have noted that individual interviews, unstructured, and non-standardized interview tools are commonly being used today, in addition to entry GPA. However, some programs have made efforts to develop standardized interview tools that are robust and relevant. For instance, the McMaster University developed the multiple mini-interview (MMI), which measures the non-cognitive attributes of candidates, and is widely used in medical schools (Eva et al., 2004; Roberts, Rothnie, Zoanetti, & Crossley, 2010). Several studies have indicated that the MMI is reliable (Peeters, Serres, & Gundrum, 2013; Sebok, Luu, & Klinger, 2014), valid (Roberts, Zoanetti, & Rothnie, 2009), and has high acceptability and feasibility (Dowell et al., 2012; Eva et al., 2004). Although some of the criteria may be objective, scholars have raised concerns about some level of subjectivity in the MMI process, especially with respect to examiner judgment, error, and bias, despite the level of training and experience the examiner may possess (Jones & Forister, 2011; Lamadrid-Figueroa et al., 2012). The difference in evaluation style among groups of examiners has equally been identified as a factor that could influence student selection processes (Roberts et al., 2010; Till et al., 2013).
Existing evidence shows that different schools and programs have adopted an admission model that combines some of these tools as a strategy for selecting the best candidates for their graduate-level programs; however, there is insufficient evidence on the predictive validity of these admission criteria (Puddey & Mercer, 2014; Roberts et al., 2009) or the extent of objectivity embedded in these processes (Lamadrid-Figueroa et al., 2012). Also, several studies have looked at the standardization of the admission process among graduate-level programs, but much has yet to be explored in terms of the reliability and validity of constructs used to measure the competencies or the components of standardized admission interview questionnaires (Dowell et al., 2012; Jones & Forister, 2011). Lamadrid-Figueroa et al. (2012) have observed the lack of research evidence to support the criteria used in creating scales to assess admission candidates and whether such criteria, if met, do in fact predict success in academic and clinical practice.
The Rasch analysis model is “a means of achieving conjoint measurement for non-physical attributes by examining candidates’ knowledge using tests” (Peeters & Stone, 2009, p. 210). The Rasch model relates person’s ability to one or more parameters, including item difficulty (Hissbach, Klusmann, & Hampe, 2011; Wilson, 2005); and the probability of an individual attaining a correct response (Peeters & Stone, 2009; Tran, Griffin, & Nguyen, 2010). Furthermore, the relationship that exists between person ability and item difficulty is able to capture the relationship of the item and person (Coe, 2008; Wilmot, Schoenfeld, Wilson, Champney, & Zahner, 2011). The Rasch model is able to provide a rigorous and detailed methodology to identify the psychometric properties of an instrument at the item level (Pomeranz, Byers, Moorhouse, Velozo, & Spitznagel, 2008; Tran et al., 2010). It has proven to elevate test design to a level of sophistication not otherwise possible when using only raw scores to determine an individual’s ability (McAllister, Lincoln, Ferguson, & McAllister, 2010; Potgieter, Davidowitz, & Venter, 2008). The Rasch model is able to provide details of the validity and reliability of instruments by focusing specifically on rating scales, items, persons, and other facets like the rater (Coe, 2008; Pomeranz et al., 2008).
Context of the Current Study
To ensure equal opportunity to applicants selected into the Master of Occupational Therapy (MOT) program at the University of Manitoba, the Admissions Committee has developed a set of selection tools, which include prior GPA and a standardized individual interview. Each applicant is interviewed by three different people (a student, a clinician, and a faculty member). Every interviewer attends an orientation, and receives training specific to the admissions interview process and content. Each interviewee is scored on five interview domains, communication skills, and overall suitability. To control for bias, each domain is scored individually and independently. Also, the interviewers were not allowed to discuss their interviews with each other. An average interview score is calculated based on the three interviews for each applicant. The Admission Committee then considers the total scores obtained from the three-station standardized interviews and the candidates’ average GPA from the last 60 credit hours of study prior to entering the program.
The purpose of this study is to conduct an analysis of the adequacy of the student selection criteria into the MOT program at the University of Manitoba using the Rasch analysis model. The specific objectives of this research are to determine whether Differential Item Functioning (DIF) exists in the student selection criteria, and if the interview scale is reliable. Previous studies, such as Puddey and Mercer (2014) have explored DIF and its role in identifying variables outside the measured domain that can affect the result of the measurement. The ability of test results to be unaffected by factors outside the primary trait being measured, such as gender, age, and socioeconomic background, is crucial in providing fair and ethical evaluations (Blackman & Darmawan, 2004; Roberts et al., 2009), and for ensuring that individuals selected were the most qualified based on the set of objective criteria.
Method
This is a retrospective cohort study designed to examine the adequacy of the interview method in selecting students into the MOT program. A set of anonymized data were obtained from the Department, with the approval of the Admissions Committee of the Occupational Therapy Program at University of Manitoba. All components of the study were reviewed and approved by the Health Research Ethics Board (HREB) of the University of Manitoba, as conforming to international ethical standards for research involving human participants.
Participants and Materials
This study used data from 258 candidates who were interviewed for selection into MOT Program within a 3-year period from 2012 to 2014. The materials used in this study include anonymized applicant records. The analytical data set included the year the interview was conducted, applicants’ interview scores, entry GPA, age, gender, application category (whether from Manitoba, other Canadians, Aboriginal, or International), type of entry degree, and the university attended. For the Rasch analysis, the variables on interview year, GPA, age, gender, and interviewer (clinician, faculty, and student) were used. The interview data contained a set of 21 items, derived from three-stage interviews. Each interview session lasted for 20 minutes and assessed seven areas, with the first five questions focusing on some individual characteristics around knowledge, attitudes, personality traits, relevant experiences, and abilities considered important for a successful participation and graduation from the program. The sixth question evaluates communication skills, while the last question provides the opportunity for the interviewer to assess the overall suitability of the candidate for the profession. The specific questions are protected because they are used annually for selecting candidates into the program. As such, it is not possible to provide sample questions in this article.
Procedures
The research team negotiated access to the admissions data with the Department of Occupational Therapy. The data were anonymized by an authorized support staff, who removed the applicants’ personal information such as names, candidate ID number, address, telephone number, email address, and postal codes to avoid the identification of individual participants. The participants’ dates of birth were converted to age at time of interview, which was then categorized into age groups to facilitate comparison across age. Each candidate was assigned a unique study identifier number.
Data Analysis
The SPSS 22 and RUMM 2030 software were used to analyze the data. The Rasch analysis was performed using the selected parameters, to determine the presence of DIF, reliability, unidimensionality of the tests, and fit to the model. The SPSS 22 provided additional statistical tools for regression, ANOVA, and multiple comparisons.
Results
Descriptive Statistics
The majority of participants were female (89.9%). Participants in the interview were from diverse disciplines, spanning from Arts to science degrees. The Table 1 shows interview mean score across interviewer level and by other characteristics such as gender, type of degree, and GPA level. The interview mean score varied by interviewer and across the interview sessions. The participants’ GPA, based on their last 60 credit hours, ranged from 3.3 to 4.4, with an average of 3.79, and standard error of 0.01. The high GPA level and small amount of random error indicate that the majority of the candidates had a high academic performance. The GPA was categorized into four, with “Below 3.66” as Lower GPA, “3.66 to 3.77” as Low, “3.78 to 3.959” as High, and “3.96 and above” as Very High GPA. Table 1 shows that the mean of participants’ interview score increased as their GPA increased, from Lower GPA to Very High GPA. The positive trend in the relationship between interview scores and GPA is an important indicator that the interview is a good measure of participants’ ability, and as such a good screening tool for identifying participants’ characteristics relevant to academic and clinical performance in the occupational therapy program.
Descriptive Statistics for Some Participants Characteristics.

Note. GPA = grade point average.
Combined interview mean.
The person-item distribution in Figure 1 reveals a lack of convergence between the scale items and person scores. Although the scale measured several traits located more to the left, majority of the participants’ scores were located more to the right, which implies that the persons’ mean ability level was higher than the scale mean. However, the graph shows that the scale has wide targeting, which means that it covered a wide range of the candidates’ ability level. There is a high risk of ceiling effect in this scale, with the person location of 1.17 being higher than the item location of 0.00.

Distribution of person-item threshold.
Reliability and Validity
Reliability of the interview tool was measured using the Cronbach’s alpha and person separation index (PSI) provided by the Rasch analysis. The PSI = 0.8715 and Cronbach’s alpha = .8790 demonstrate that the interview tool has a high reliability. The face validity of the tool was determined through interviewers’ feedbacks and reviews that have occurred over the years. In this study, the validity was further determined by the significant statistical correlation between the interview scores and candidates’ prior GPA. Academic GPA is a well-established objective measure of a student’s ability (Lamadrid-Figueroa et al., 2012; Wilkinson et al., 2008). The Pearson’s correlation between total interview score and prior GPA was significant, r = .214, p = .001. The relationships and the interaction between levels of GPA and the interview scores were further explored using linear regression and ANOVA, with post hoc comparative analysis.
Regression Analysis
A regression analysis was performed to determine which of the factors were significant in predicting the outcome variable, which is the interview score. The R2 indicates that the linear regression is able to explain 5.6% of the variation in the interview performance. Table 2 provides information on the regression coefficients of the predictor variables. Based on the regression table, the only factor that significantly explains the outcome variable is the GPA, β = .217, p = .001. This statistic corroborates the Rasch analysis result that the GPA is an important determinant of candidates’ interview performance, with interview scores increasing as the GPA increased.
Regression Analysis of Predictors of Interview Performance.

Note. Application category refers to whether candidate was from Manitoba, Other Canadians, Aboriginal, or International. r = .214, p = .001. CI = confidence interval; GPA = grade point average.
Dependent variable: Total score from all the three interviews.
The result of a one-way ANOVA shows a significant difference in interview scores across the GPA, F = 4.235, p = .006, supporting the evidence from Table 1 that interview scores increased with higher GPA levels. In Table 3, the multiple comparison result indicates that candidates with Lower GPA (below 3.66) were significantly different from other candidates whose GPA were higher. Although the average interview score increased with GPA (see Table 1), there was no significant difference between groups whose GPA were 3.66 or above. Also, there was no significant difference between interview scores by year of the interview (2012, 2013, 2014), F = 0.664, = 0.575. The result of this analysis strongly reinforces the association between interview score and entry GPA, and the fact that candidates whose GPA were below 3.66 scored significantly lower in the interviews than those with a higher GPA. This association between interview scores and GPA attests to the validity of the interview tool.
Multiple Comparisons by Fisher’s Least Significant Difference (LSD) Method.
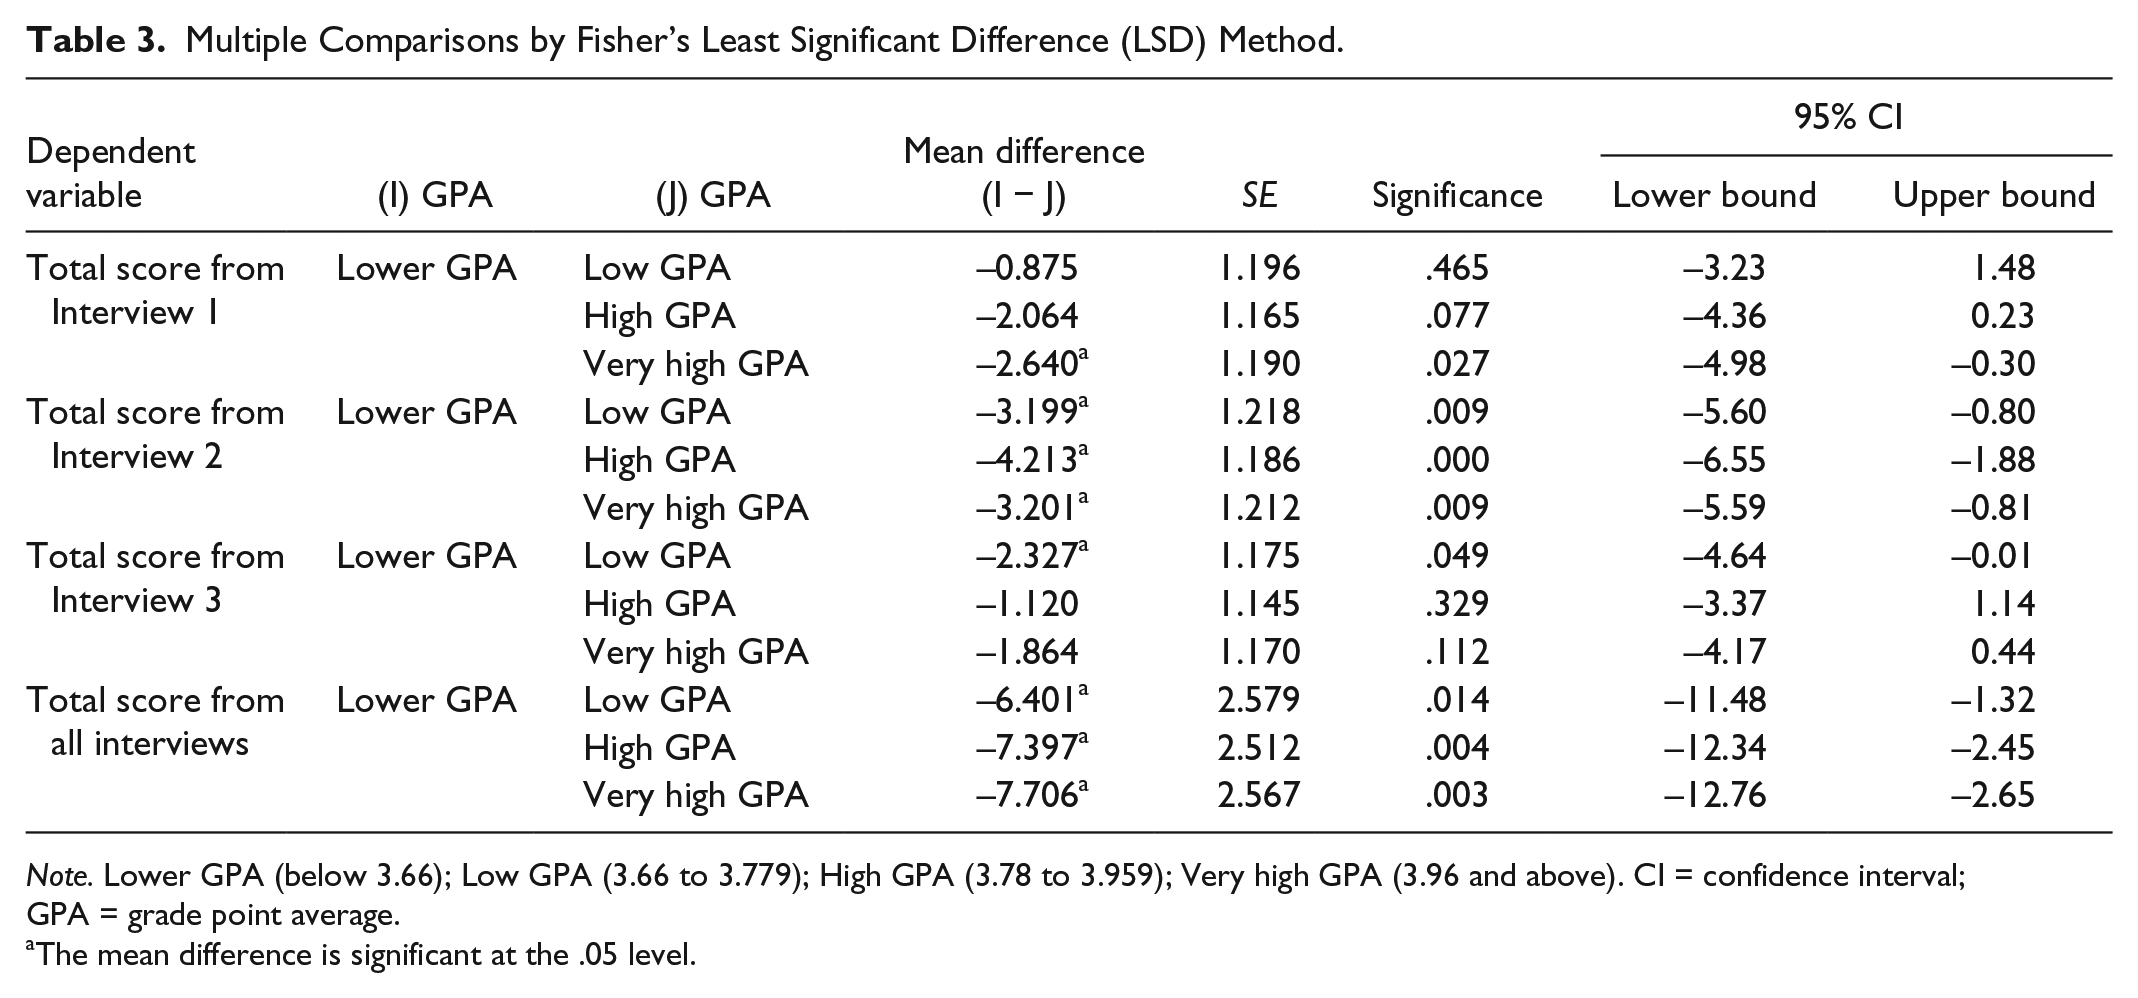
Note. Lower GPA (below 3.66); Low GPA (3.66 to 3.779); High GPA (3.78 to 3.959); Very high GPA (3.96 and above). CI = confidence interval; GPA = grade point average.
The mean difference is significant at the .05 level.
Analysis of Fit
The Rasch result indicates an excellent power of analysis of fit, based on the high PSI of 0.8715, as shown in Table 4. However, the overall model fit analysis using the mean and chi-square statistic indicates some problems with the model fit. First, the Rasch analysis of person-item fit statistics indicates that, on average, person scores are located above the item mean (Item mean = 0.0, Persons mean = 1.17). In Rasch analysis, the chi-square statistic is generally used to evaluate whether the hierarchical ordering of items is consistent across increasing levels of the person traits. The item–trait interaction based on 19 items, after two items with extreme fit residual were deleted, was χ2 = 99.632, with p value = .0004, which suggests a significant difference between the measure and the Rasch model expectation. Also, the root mean square error approximation (RMSEA) = 0.069 supports the evidence from the chi-square statistic of a misfit to the Rasch model. This misfit is most likely due to the presence of several items on the scale located on the extreme left, measuring traits at levels below the ability levels of the candidates. Depending on the purpose of the measure, in this case primarily screening, it may be better to eliminate these items from the scale.
Summary of Fit Statistics.

Note. PSI = person separation index.
Correlation between location and standardized residual.
An item by item analysis shows that 19 of the items in the interview had appropriate fit residual, except for Item 16 with an extreme fit residual of 2.965. The mean residual for the items and the persons was located around zero, and the standard deviations were approximately within 1.18 (see Table 4). This suggests that both the items and persons are within acceptable range of the Rasch model expectation. A further examination of each item and individual statistics indicated that although Item 13 has an acceptable fit residual of −2.261, it has a significantly high variation compared with other items, F = 6.459, df = 3;254 at Bonferroni adjusted p = .0003. Consequently, Items 13 and 16 were eliminated from the final Rasch model. Table 5 shows the fit statistics for the 19 items included in the final Rasch analysis. This improved the model fit from χ2 = 140.428, df = 63, p value = .0000 to χ2 = 99.632, df = 57, p value = .0004 (see Table 4).
Analysis of Individual Item Fit.

Unidimensionality Test
The interview scale was originally designed as a multidimensional test to measure different aspects of a candidate’s ability that were relevant to academic and professional practice in occupational therapy. However, there has not been any formal testing of this characteristic of the tool. The Rasch analysis test of dimensionality was performed, using the t test. The result shows that 35.3% of the estimates were significantly different, thereby confirming that the scale was not unidimensional. This is acceptable, as the interview items were designed to measure different dimensions of participants’ characteristics considered important for admission into the MOT program.
DIF Analysis
The data were also analyzed to determine whether the tool was invariant, in other words, if there was any evidence of DIF for any of the person factors. The results show there was no evidence of DIF for all the person factors considered in the analysis. However, Item 13 consistently showed significant DIF by class interval for year of interview, gender, GPA, and degree. As noted above, this item was removed from the final model. The lack of a uniform DIF in the tool suggests that it is unbiased and as such provides all participants with a fair assessment of their abilities.
The Rasch’s ANOVA shows no significant difference in the participants’ interview performance with respect to all the person characteristics, except for the GPA (see Table 6). This suggests that the only factor related to participants’ interview score was academic ability measured by their prior GPA. This was consistent with all the other statistical results, and further confirms lack of bias in the interview tool. Hence, the interview process complemented the GPA as an objective measure of candidates’ ability.
One-Way ANOVA for the GPA Person Factor.

Note. GPA = grade point average; SS = Sum of squares; MS = Mean squares.
Discussion
Typically, admissions committees of graduate-level programs select relatively high-performing graduates who have achieved a specified GPA during their undergraduate or prior entry studies (Puddey & Mercer, 2014). The admissions process into these programs is highly competitive, with more applicants than available spaces (Roberts et al., 2014; Timer & Clauson, 2011). Existing evidence shows that the task of selecting students with relevant knowledge and attitudes from a large pool of applicants has been very difficult for admission committees of health profession education programs (Till et al., 2013; Timer & Clauson, 2011). As noted earlier, there are many stakeholder groups with diverse expectations for health care graduates. The admission committees have to ensure that they select students who are most likely to meet the academic and clinical expectations of the stakeholders (Salvatori, 2001; Timer & Clauson, 2011). To capture the diverse applicant characteristics considered appropriate for students going into these professional programs, many admission committees have added standardized interviews into their admission selection tool kit. The reliability of some of these admission tools remains unknown. This study shows that the interview scale used for admission into the MOT program at University of Manitoba is reliable and valid. The reliability of the MOT interview tool, PSI = 0.87 and Cronbach’s alpha = .88 is quite high. The high reliability index of the MOT interview tool points to its high internal consistency, and there is also the evidence that the scale adequately measures those candidates’ characteristics it is intended to measure.
Previous studies have shown that students’ GPA obtained at the undergraduate or prior entry degree/certificate programs is a very important and reliable measure of their ability (Dowell et al., 2012; Puddey & Mercer, 2014), and have been used as a standard criteria for evaluating other measures of knowledge. In this study, the MOT interview scale scores have a positive linear correlation with prior GPA, a criterion that points to its validity; candidates with high GPA performed better than others, in knowledge domains and characteristics for admission into the professional program.
Apart from the reliability and validity of the interview tool, this study found the interview tool to be invariant across candidates. In other words, there was no evidence of DIF for any of the person characteristics. The lack of DIF in the tool shows that it is unbiased and as such provided all participants with a fair assessment of their abilities. The studies by Blackman and Darmawan (2004) and Hissbach et al. (2011) had looked at DIF in the context of gender neutrality in the admission process. In both studies, females were found to have a slightly higher chance of success on various items. In this study, the male interviewees had a higher interview mean score (Table 1), but it is possible that the higher standard deviation and smaller sample size for the male could have biased this difference. Also, those holding an arts degree scored lower on average than science or other degrees. The DIF analysis using Rasch provides an analysis for inter-rater reliability at an item-by-item level. Contrary to previous studies where significant variation was reported for examiner factor (Roberts et al., 2010; Till et al., 2013), this study did not find any significant difference in interviewers’ (faculty, clinician, student) rating. This lack of difference can be attributed to the stringent training provided to all the interviewers. The interviewers receive a 1-day training and simulated scoring session, using an interview video. Individual scores are discussed in small groups, followed by a large group feedback session. It is very likely that variation in interviewers’ scores was reduced by the training and standardized implementation procedure.
Besides the reliability and validity of the interview scale, this study identified some measurement issues which would require some attention to further improve the interview tool. There was an evidence of ceiling effect in the scale, which is reflected by many of the items being located on the left side of the scale. Ceiling effect is used to describe the level above which variations within the population traits of interest are no longer being captured, as the scale does not have questions that estimate such traits. This can affect the ability of the scale to differentiate and discriminate between individuals with higher ability levels and others. On this scale, the person mean location of 1.17 is much higher than the item mean location of 0.00, suggesting a possible ceiling effect. This ceiling effect has not, to our knowledge, been addressed in many previous studies. It is therefore an important area for further research, to determine whether scale items used in admissions provide adequate challenge and truly capture high-ability levels.
One of the considerations for the adequacy of a scale is the targeting of the population traits
The alignment of the PSI with the Cronbach’s alpha, suggests that the scale has a wide targeting of the participants’ ability level. However, the information on Figure 1 and other statistics indicate that several of the items on the scale measured knowledge below the average ability level of the participants. In other words, the result suggests that most of the candidates had knowledge or ability levels, which were higher than what some of the interview questions were measuring. However, this might be a good characteristic for a screening tool such as this, to broadly target population traits that are considered relevant. However, in this scenario where most of the candidates appeared to be knowledgeable and very well prepared, the items located on the left of the scale may not contribute much to the measurement, as they are not able to discriminate between high- and low-performing candidates. It could be argued that such interview items amount to a waste of time for the interviewers and candidates.
Typically, in an educational test similar but not necessarily equivalent to this, it would be a waste of time to administer a test to students, which was far too easy than their ability level. There are a number of possible explanations that may be the case in this measure. One is that to qualify for the interview, applicants would have scored a very high GPA based on the last 60 credit hours of their pre-admission courses. Also, some of the candidates may have participated in the interview in the past or learnt from their friends and would have been better prepared for the interview. There was anecdotal evidence that some of the candidates preparing for admission into the program had volunteered or worked in environments that prepared them for occupational therapy or medical rehabilitation roles. The interviewees are usually a pool of high-ability candidates. These facts will have some implications for interpreting the result and power of fit to the Rasch model.
It is also important to restate that one of the key objectives of developing interview scales for admission is to provide additional screening tools that would help university programs and their admission committees to make the best decisions, while screening the large number of well-qualified candidates into their program. Primarily, such interview tools incorporate measures targeting skills, competences, personality traits, and other capabilities, which the committee considers essential for successful completion of the program and future practice in the profession. Many of these criteria are based on stakeholders’ expectations and feedback. In Canada, most professional university programs conduct regular stakeholder reviews of their programs to identify what future employers, the clinical community, the professional associations, regulatory body, the government, and the general public desire to see in graduates from their programs.
Conclusion
The result of this Rasch analysis indicates that the use of interview tools in the student selection process by the MOT program is objective, especially in consideration of the association between interview scores and candidates’ entry GPA. This additional screening tool seems fair, and provides additional means to ensure that candidates meet the program unique requirements.
The Rasch analysis reveals that participants’ ability level was above the item mean, which indicates that the current scale may not fully capture the full ability of the interview candidates. The extent of discrimination of participants’ ability therefore needs to be further investigated. However, as the interview process provides an additional level of screening for admission candidates, the targeting of all levels of ability may not be very crucial. However, this may not fully discriminate candidates’ ability levels, due to the potential ceiling effect. It may be necessary to further review the tool to identify and modify or drop those items that lie on the extreme left of the measure, which do not necessarily differentiate between applicants’ ability levels. This will help the admissions committee to more accurately differentiate applicants’ ability and further select the most competitive candidates. A contrary argument will be that those “easy” items provide an introductory and more relaxed level into a three-stage interview, helping candidates to overcome their initial anxiety. This will be valid, if the items are sequentially ordered to achieve this.
It is important that admission interview questions incorporate important psychometric measures on knowledge, attitudes, personality traits, educational achievement, relevant experiences and abilities, because professional and licensing bodies commonly consider these characteristics.
Limitations
Rasch analysis is a unidimensional measure, so the use of data from a multidimensional tool, as in this study, may have implications for the model fit interpretation. The findings of this study are based on the interview tool used by the MOT program, so the comparability with other graduate-level admission interview tools may not be quite correct, as some of the programs have different criteria and procedures. Finally, although the sample size of 258 is relatively large, the average number of participants in the three cohorts was 86. A much larger total sample size would give a stronger analysis power.
Footnotes
Acknowledgements
I wish to acknowledge the important contributions made by two of my graduate students, Naomi Seon & Lauren Henry in the Master of Occupational Therapy program. I also thank the Department of Occupational Therapy, University of Manitoba and the Admissions Committee for the access granted to the use of the admission data.
Declaration of Conflicting Interests
The author(s) declared no potential conflicts of interest with respect to the research, authorship, and/or publication of this article.
Funding
The author(s) received no financial support for the research and/or authorship of this article.