
Abstract
Research literacy is essential for teachers to practice their profession based on research-based knowledge. The present study aimed to develop and validate the Research Literacy Scale (RLS) and investigate teachers’ research literacy based on the Theory of Planned Behavior and research utilization models. The data was collected from teachers working in primary and secondary schools for two separate studies. According to the exploratory factor analysis results, a 20-item, four-factor solution emerged: research awareness, attitude toward research, research skills, and research use. Confirmatory factor analysis indicated that the four-factor model fit the data well, and all items are significant under the relevant factors. The sub-factors of the RLS demonstrated high internal consistency. Measurement invariance tests revealed showed full configural, metric, scalar, and strict invariance across gender. Teachers doing research had significantly higher scores on all four dimensions, and those who followed scientific journals had higher scores on the three dimensions except for attitude. As a conclusion RLS has good psychometric features to measure teachers’ research literacy, and variables related to research experience cause a significant difference in research literacy.
Keywords
Introduction
Internationally, teachers are increasingly expected to use research to inform their educational practices. At the heart of these expectations is the growing importance of research for the teaching profession. Fundamentally, as Hargreaves (1996) emphasizes, teaching is a research-based profession and research should be a sustainable and integral part of being a professional teacher (Evans et al., 2017). Teachers need to be researchers of their own practice to be effective practitioners (Usher, 1996). Teachers who take on the dual role of teacher–researcher seek answers to their questions by conducting research and embracing data-based decision-making (Hathaway & Norton, 2018). However, the essential question is to what extent are teachers interested in engaging with and engaging in (see Borg, 2009) research?
Teachers’ engagement with research is not a new subject (Cochran-Smith & Lytle, 1999; Corey, 1954; Stenhouse, 1975). However, this engagement is still not at a sufficient level. Even if some findings indicate that teachers’ attitudes toward the value of research are positive (Baş & Kıvılcım, 2017; Green & Kvidahl, 1990; Kostoulas et al., 2019; Ratcliff et al., 2005; Williams & Coles, 2007), teachers have not shown a preference for research as an information source in educational environments (Booher et al., 2020; Borg, 2009; Cain & Allan, 2017; Dagenais et al., 2012; Davidson, 2011; Lysenko, 2010; Vanderlinde & van Braak, 2010). Academic studies only marginally influence teachers’ decision-making (Walker et al., 2019).
This problem, which is discussed internationally, is also essential in Türkiye. Teachers do not make use of educational research in their profession (Sarı, 2006; Yıldırım et al., 2014). According to a study, although teachers agreed that research was essential, valuable, and reliable and that using research-based knowledge had professional and individual benefits, 88.3% of the teachers did not follow a scientific journal related to education, 91.9% did not attend a scientific congress, 75% did not review the literature on a subject, and 82% did not conduct any research (Kazancı-Tınmaz, 2020). Moreover, policy initiatives to encourage teachers’ research use are also scanty. When we examine the teacher competencies of the Ministry of Education (MoNE, 2017), among 65 indicators, there are only three items, such as “Interpret the reflections of the basic theories and approaches in the field.”“Classifies the basic sources of information and data related to the field.”“Classifies the basic research methods and techniques related to the field.” All this leads to a widening gap between theory and practice in education. At this point, research literacy is a crucial concept to fill this gap and spread research-based practices in educational settings.
Theoretical Framework
Research Literacy
Research literacy (RL) refers to “develop[ing] a complete and comprehensive picture of how research functions” (Shank et al., 2014, p. 2), or “the ability to locate, understand, discuss, and evaluate different types of research; to communicate accurately about them; and to use findings for academic and professional purposes” (Beaudry & Miller, 2016, p. 4). According to the British Educational Research Association (BERA) and the Royal Society of the Arts (RSA) (2014), research literacy is a dimension of teachers’ effectiveness and their professional identity. BERA-RSA (2014) defined the research literacy “to the extent to which teachers and school and college leaders are familiar with a range of research methods, with the latest research findings and with the implications of this research for their day-to-day practice, and for education policy and practice more broadly.”Groß-Ophoff et al. (2017) treats the concept as educational research literacy and define “the ability to purposefully access, reflect and use evidence from educational research.”Jemsy (2018) conceptualized educational research literacy as interrelated components: “knowledge of research concepts, statistical literacy, information literacy, research engagement, attitudes towards research and critical thinking skill.” A research-literate person knows (1) the fundamental rules of both qualitative and quantitative types of research, (2) the processes by which a research article is developed, (3) how to read complex research articles, and (4) how to assess the strengths and weaknesses of a research article (Shank et al., 2014). In other words, they know what and how to learn from research (BERA-RSA, 2014). Thus, research literacy encompasses many different skills, including the ability to access research, read and understand research studies, discuss them, and reflect on the application of research to practice.
According to Beaudry and Miller (2016), RL combines four distinct literacies: information/technological literacy, verbal literacy, numeracy, and visual literacy. Information literacy encompasses knowledge of using databases to locate and access research publications. The second type of research literacy is verbal literacy, which refers to the ability to understand, interpret, and criticize research studies. The language and style of scientific writing is different from other types of writing, and the reader must have a degree of comfort with this language to be able to understand, interpret, and assess its quality. Another type of research literacy is numeracy, which refers to the ability to understand and apply mathematical calculations and symbols. Finally, visual literacy encompasses the ability to read, understand, and interpret information presented through visual images, such as tables, line graphs, and diagrams, which are often used to present research findings.
Dimensions of Research Literacy
In the current paper, research literacy is assessed as a multidimensional concept. We consider research literacy as a behavior developed in the process, and we include awareness, attitude, skill, and research use that enable behavior to emerge. We based our thoughts on Ajzen’s Theory of Planned Behavior (TPB) and research utilization models (Pelz, 1978; Weiss, 1979). TPB includes specific critical ideas from the social and behavioral sciences and describes them in a way that makes it possible to predict and comprehend specific behaviors in particular settings. TPB contends that behaviors result from behavioral intention, which arises from three precursors: attitudes, subjective norms, and perceived behavioral control. It asserts that behavioral, normative, and control beliefs primarily predict intentions and behavior. In general, an individual’s intention to engage in the behavior under consideration should be stronger the more positive the attitude and subjective norm concerning the behavior and the stronger the perceived behavioral control (Ajzen, 1991).
Awareness
Awareness is defined as “overall knowledge and understanding of potential issues” (Bulgurcu et al., 2010, p. 532), “the mental state of knowing about something” (Cambridge Dictionary, 2023), “to the extent to which people are aware of the stimulus triggering a process or of the process itself.” (Chatzisarantis & Hagger, 2007, p. 664). Once someone becomes aware, they often change their behavior to match their level of awareness (Kang et al., 2012). For example, awareness is effective in smoking cessation behavior (Vallone et al., 2011) and the level of the lecturers’ utilization of the free online digital tools (Alordiah et al., 2023). Such findings show that awareness is vital for some behaviors.
We can explain the relationship between awareness and behavior according to TPB. This theory acknowledges the possible significance of background factors (Ajzen, 2005). These factors are categorized into personal, social, and informational factors, and they can influence attitudes toward behavior, as well as intentions and actions. Experience, knowledge, and media exposure are in the informational categories. Based on TPB, we suppose that a research-literate teacher has research awareness. We can assume research awareness as knowing something about research. Teachers can have research awareness through direct experience by taking a scientific research techniques course in their undergraduate education or attending a master’s program. Thus, they can have general information such as what research is as a concept, which parts research consists of, and where research is published.
Attitude
The relationship between attitude and behavior has been studied by many theories for a long time. TPB is one of them and, attitude toward the behavior refers “to the degree to which a person has a favorable or unfavorable evaluation or appraisal of the behavior in question” (Ajzen, 1991, p. 188). In this study, we hypothesized that attitude is a component of research literacy and analyzed teachers’ views on the value, usefulness, and importance of research in the attitude dimension.
Skills
According to TPB, perceived behavioral control is a factor affecting behavior. Ajzen (1991) refers to perceived behavioral control as “the perceived ease or difficulty of performing the behavior, and it is assumed to reflect experience as well as anticipated impediments and obstacles” (p. 188) and “self-efficacy with respect to the behavior” (p. 199). It means the widely held notion that one’s actions determine one’s outcomes instead of being determined by external factors (Ajzen, 2005). According to Ajzen (2005), people undertake a behavior to the extent they believe they can complete it. If they can carry out the desired activity, their attempts succeed. He states that the factors that can affect the degree of control a person has over a particular behavior can be of internal and external origin. Skills and abilities are among the internal factors. A person who intends to perform a behavior may realize that he/she lacks the necessary skills or abilities when he/she tries to do it. From this perspective, we can postulate that a literate research teacher has skills in doing, reading, and discussing research.
Research Use
Research utilization is the process of transferring research-based knowledge to practices (Hunt, 1996). It is a complex behavioral process requiring individuals to do something with research results (Beyer & Trice, 1982). Nutley et al. (2007) consider research utilization an ongoing process rather than a single event. While specific descriptions of research utilization are debated in the literature, they suggest that measures of research utilization include whether research is accessed and taken into account, if research is cited in documents, whether knowledge, understanding, and attitudes have changed, and whether research has been directly incorporated into policy or practice. In this study, three models of Weiss (1979), who states that the use of information research can have seven different meanings, were adopted. Among these, the problem-solving model is used to find a solution to a determined problem or to fill the knowledge gap on a subject. In the enlightenment model, research results improve general thinking on a topic in the decision-making process. In the tactical version, research evidence is used to increase the prestige and credibility of the decision-maker.
Present Study
For many years, some countries have been setting policies (Every Student Succeeds Act [ESSA], 2015; No Child Left Behind [NCLB], 2011) and international organizations such as the Organisation for Economic Co-operation and Development (OECD, 2007, 2022) and BERA-RSA (2014) have been drawing attention to research-based practice. However, there have not been enough scientific studies in Türkiye. Moreover, there are no policies to support the participation of teachers in this direction. Teachers’ interest in research is limited, similar to studies conducted in other countries (Booher et al., 2020; Walker et al., 2019). Whereas studies show that engagement of teachers with research has positive outcomes on teaching (Cordingley, 2013; Crain-Dorough & Elder, 2021; Rose et al., 2017). In a systematic review by Bell et al. (2010), it was found that teachers’ engagement in and with research positively impacted student outcomes. Because of this importance, improving teachers’ research literacy is necessary. Therefore, measurement tools are needed since we cannot improve what we cannot measure. However, in a study analyzing measurement tools, only a small percentage of the research using these tools provided evidence of their reliability (27.77%) or validity (38.8%; Lawlor et al., 2019).
On the other hand, the lack of the theoretical infrastructure of measurement tools is also among those mentioned (Brown, 2014). Because of this deficiency, Brown et al. (2022) developed the “Research-Use BCS survey” for teachers (n = 147). They adopted Baudrillard’s semiotic theory of consumption and developed a measurement tool based on the benefit, cost, and importance of research use in their scale. As mentioned above, we took Ajzen’s (1991) TPB and Weiss’s (1979) usage models as a basis for this study. We combined teachers” research engagement with and under “research literacy.” We assumed that research literacy is a concept that includes research awareness, attitude toward research, research skills, and research use as behavior and evaluated it holistically. Such a scale is needed not only because of methodological problems but also conceptually, and it will contribute to national and international literature. In the literature, there are scales of attitudes toward research, level of research use, and factors affecting research use for teachers (Cousins & Walker, 2000; Lysenko, 2010; Öztürk, 2011; Penuel et al., 2016). Besides, several scales measuring research literacy (Groß-Ophof et al., 2017; Yusof et al., 2018) have also been developed to measure the gains of university students taking research techniques courses. In their study aiming to develop a tool to measure the research literacy of teachers, Yıldız et al. (2019) identified four dimensions of RL: the research process, preparation for research, method knowledge, and access to resources. The dimensions cover the skills/knowledge required to conduct a research study from beginning to end. These studies alone are insufficient to measure teachers’ research engagement with and in comprehensively. As emphasized by Beaudry and Miller (2016) and Jemsy (2018), RL includes a broad understanding of accessing, reading, discussing, and conducting research and applying research findings to professional practice. A scale is needed to measure this broad scope of RL.
Due to methodological, theoretical, and conceptual deficiencies, this study aimed to develop a valid and reliable data collection tool to define the concept of RL and to measure teachers’ RL. While the primary purpose of the study is to develop a scale with tested psychometric properties, it also aims to investigate teachers’ research literacy based on several variables related to their research experience. The findings of the study will not only make it easier to measure research literacy but will also guide further research to improve teachers’ research literacy.
In sum, we seek answers to the following research questions:
RQ1: Is the Research Literacy Scale a valid and reliable measurement tool?
RQ2: Does teachers’ research literacy differ significantly according to following scientific journals related to education (FSJE)?
RQ3: Does teachers’ research literacy differ significantly according to doing research?
RQ4: Do FSJE and doing research together cause a significant difference in teachers’ research literacy?
Two studies were carried out to achieve the aims mentioned above. Exploratory factor analysis (EFA) was conducted on the first study; the second was used to confirm the obtained structure with confirmatory factor analysis (CFA) and to test the other aims of the study.
Study I
Method
Research Design
This study, in which the “Research Literacy Scale” was developed and implemented, was conducted in the cross-sectional survey model, one of the quantitative research methods. These studies aim to collect information on people’s current behaviors, attitudes, and beliefs related to a specific subject in a population (Gay et al., 2009, p. 202).
Participants
The participants were recruited using convenience sampling. There were a total of 348 teachers who worked in primary and secondary schools in Türkiye, during 2018 spring semester. After the univariate and multivariate outliers were cleared from the data sets, 310 (M = 209.25; SD = 29.08) data remained in this sample. Comrey (1988) classifies the sample as 100 as poor, 200 as moderate, 300 as good, 500 as very good, and 1,000 as excellent. In this context, the number of samples in this study can be interpreted as good. Of the participants (N = 310), 195 (62.9%) were female and 115 (37.1%) were male. The age range of teachers was 24 to 61, and their seniorities ranged from 1 to 38 years. The majority of the participants (88.7%) had bachelor’s degrees, 2.9% had two year degrees, and only 8% had postgraduate education.
Research Instruments and Procedures
We followed the steps suggested by DeVellis (2017, pp. 103–141) in the scale development process (Figure 1). First, we determined what we were to measure, and in order to determine the features that constitute the theoretical framework of research literacy, we scanned the literature in depth. We examined studies conducted in different fields regarding the characteristics of being “research literate” (Beaudry & Miller, 2016; Brody et al., 2011; Groß-Ophof et al., 2017; Shank et al., 2014), aiming to measure teachers’ attitudes toward research use (Cousins & Walker, 2000; Öztürk, 2011) and Weiss’s (1979) conceptual, instrumental, and symbolical research use model. Besides, technological literacy, verbal literacy, visual literacy, and mathematical skills, which are subtypes of research literacy, were considered (Beaudry & Miller, 2016).

Scale development stages.
In the second stage, we created an item pool within the framework of the characteristics determined from the studies mentioned above. As DeVellis (2017, pp. 110–113) suggested in item writing, we chose the expressions that were most likely to measure the relevant feature, and we paid attention to the fact that each item measures a single feature, to the determination of explicit expressions, and to the sentences not being too long. We removed unnecessary words and avoided grammatical structures that would cause ambiguity. We created a pool of 56 items by paying attention to these issues.
In the third phase, we decided to use the 5-point Likert type as a format. The categories were organized between 1 and 5, ranging from “I completely disagree” (1) to “I completely agree” (5). Subsequently, the item pool was consulted by five experts who study educational sciences for content validity. According to the expert opinions, some revisions were made to improve the power of meaning, clarity, readability, and content appropriateness. In addition, 12 teachers and school administrators evaluated the comprehensibility of the items.
Finally, the draft scale was put into final form, and we applied it face-to-face in the schools. A form also included demographic information such as gender, age, seniority, and degree. In the data collection process, we explained the aim of the study to the teachers, gave a short briefing on how to fill in the blanks, and stated that they could leave the study unfinished if they wanted to. After that, the data were entered into the SPSS 22.0 program. The items with negative meanings were reverse-scored.
Data Analysis
IBM SPSS for Windows Version 22 was utilized for data analyses. All statistical tests were performed using a significance level of p < .05.
Data Screening
Data were examined for correct data entry and factor analysis assumptions. These assumptions are sample size, missing data, normality, absence of univariate and multivariate outliers, linearity, absence of multicollinearity, and factorability of R (Tabachnick & Fidell, 2013, pp. 618–620).
Although there is no consensus on the sample size for factor analysis in the literature, it is reported that at least 5:1 should be the ratio of participant number to scale items (Hair et al., 2014, p. 100). Sample 1 (n = 310) was used to evaluate the dimensional structure and develop construct validity based on this advice regarding sample size.
Since it was seen that the missing data were 0.4% and it was randomly distributed (MCAR test, p > .05), the missing data were replaced with new scores adjusted with the EM algorithm. Z scores were calculated to determine univariate outliers, and 12 cases exceeding the critical point of ±3.29 were excluded. Multivariate outliers were examined through Mahalanobis distance, and 26 cases were omitted from the sample. In order to check the normality, it was examined whether the skewness and kurtosis values were between −1 and +1 (Tabachnick & Fidell, 2013). Besides, the fact that the Kolmogorov-Smirnov test results (p > .05) are not significant shows that the distribution is normal in the data set. The histograms and Q–Q charts point out that the data are normally distributed. In addition, it was observed that the scatter plots for samples were linear.
Exploratory Factor Analysis
EFA was performed to assess the construct validity of the scale. Before conducting EFA, as Field (2005, p. 642) suggested the correlation matrix and the anti-image correlation matrix tested the factorability of R. To assess the construct validity of the scale, principal axis factor extraction and varimax rotation were used. Kaiser-Meyer-Olkin (KMO) coefficient was calculated, and Bartlett’s test of sphericity was performed to determine whether the scale was appropriate for factor analysis. Field (2005) states that while the KMO value should be at least .05, a value greater than .08 is more valuable. We decided whether or not the item remained in the factor based on the cross-loading being greater than 0.10 (Büyüköztürk, 2010, p. 125) and factor loadings being greater than .32 (Tabachnick & Fidell, 2013, p. 654).
Nomological Validity
Pearson correlation coefficients were calculated to observe inter-correlations among sub-factors to examine nomological validity. Nomological validity, based on EFA, is concerned with the significance of the relationships between the structures obtained in the scale (Hair et al., 2014, p. 620).
Reliability
Cronbach’s coefficient alpha (Cronbach, 1951) was calculated in this study. Cronbach alpha value should be at least 0.7 (Field, 2005; Hair et al., 2014).
Results
Item Analysis
Before conducting EFA, we examined means (4.51–3.38), standard deviations (0.611–0.974), and corrected item-total correlations (0.423–0.809) of all items. We removed three items (item 33, item 34, and item 37) whose corrected item-total correlation coefficient was less than .30.
Exploratory Factor Analysis
We found that most correlations were higher than .30 in the correlational matrix, and diagonal values were greater than .5 (.865–.983) in the anti-image correlation matrix. KMO coefficient was .966, and Bartlett’s test of sphericity was also significant (χ2 = 14 332.685, df = 1378, p < .01). Therefore, the dataset was determined to be suitable for factor analysis.
As a result of principal axis factoring extraction, seven factors with an eigenvalue greater than one emerged. The analysis was repeated with Kaiser normalization varimax rotation, and the number of factors decreased to five because one item was left in one factor and none in the other. We removed cross-loaded items one by one and a four-factor structure consisting of 20 items emerged. The four factors explained 62.602% of the total variance (Skills = 46.9, Attitude = 7.2, Research Use = 4.6, and Awareness = 3.8). In Table 1; the factor loadings, communalities, means, and standard deviations of the items are presented.
Rotated Factor Structure of the Scale.
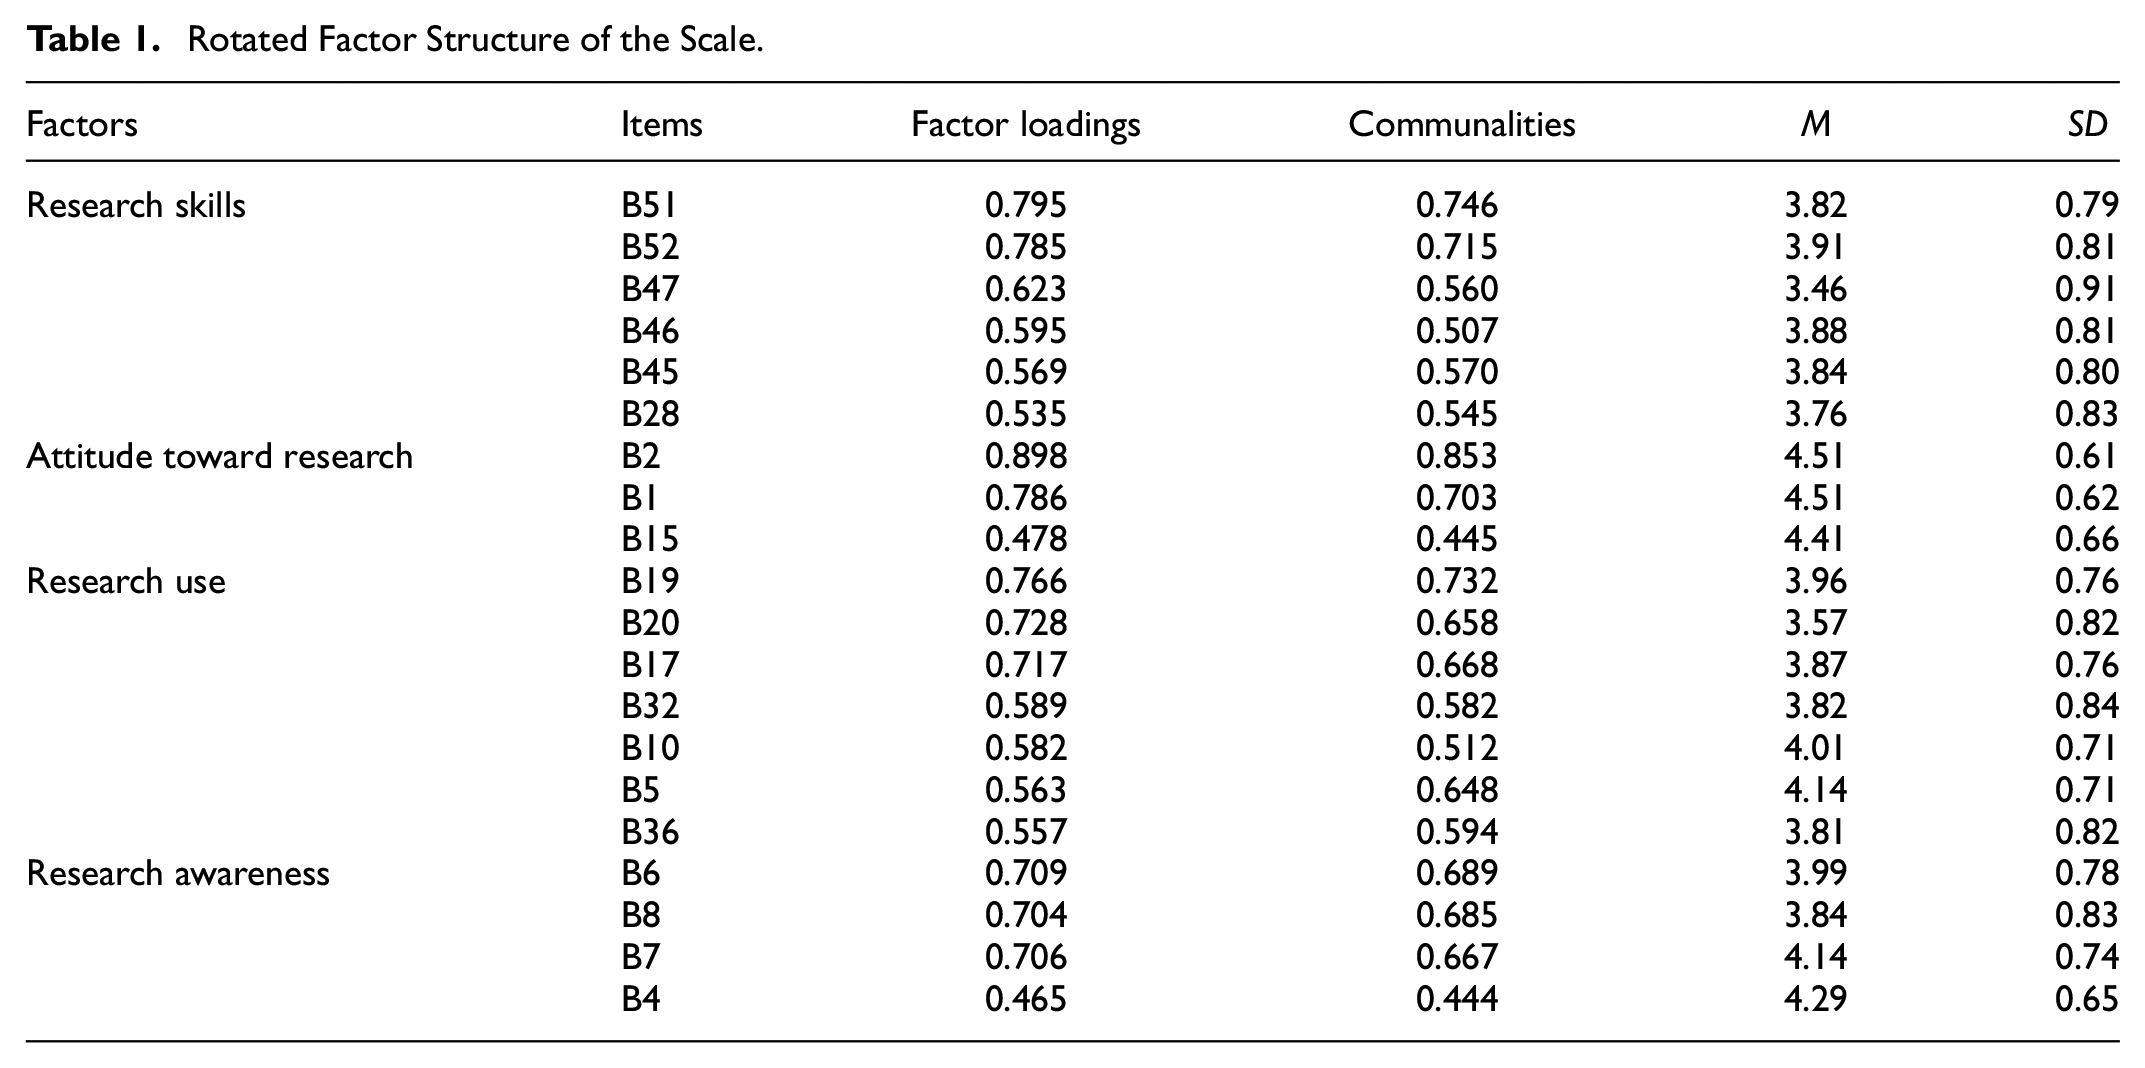
Common characteristics of the items which comprise the factors were taken into account, by naming these four factors. Therefore, the first factor was labeled “Research skills” (six items), the second factor “Attitude toward research” (three items), the third factor “Research Use” (seven items), and the fourth factor “Research awareness” (four items). Face validity is related to the compliance of the items with the definition of the structure they are placed in (Hair et al., 2014, p. 601). Examples of items in the attitude sub-factor are: “Scientific research is important to my profession,” and “Educators should benefit from research in their professional practice.” Examples of items in the skills sub-factor are: “I can do a literature review on a subject when I need it,”“I can discuss the research done on a subject,” and “I know how to interpret the tables, graphs, charts and similar figures in research publications.” In the research use sub-factor, there are items such as: “I use scientific research to organize my daily professional activities,”“I benefit from scientific research while preparing the course contents,” and “I benefit from research to improve my pedagogical knowledge.” It is seen that all items are compatible with their factors, and this points to face validity. Finally, the items in the dimension of awareness can be exemplified as follows: “I know what topics research consists of” and “I know where scientific research is published.”
Nomological Validity
The correlation coefficient between skills and attitude scores was found to be .43 (p < .001); between research use and attitude scores, it was found to be .55 (p < .001); between awareness and attitude scores, it was found to be .49 (p < .001); between awareness and skills scores, it was found to be .66 (p < .001); between awareness and research use scores, it was found to be .67 (p < .001); and between skills and research use scores, it was found to be .70 (p < .001). All correlations were found to be significant, the sub-factors were positively related to each other, and the correlations were smaller than .85. Therefore, nomological validity of the scale was supported in the scale.
Reliability
The Cronbach’s α for the RLS and sub-factors was high (RLS = .94, Skills = .89, Research Use = .91, Attitude = .81, and Awareness = .86).
Study II
Method
Research Design
The second study was conducted using the cross-sectional survey model like the first one. As Fraenkel et al. (2012, p. 394) stated, this model aims to collect some information at just one point in time from a sample.
Participants
We collected the data from 268 primary and secondary teachers in a city in the Black Sea Region in Turkey, during the 2018 spring semester. Three provinces were selected in the city, and we collected data from 14 schools. After the univariate and multivariate outliers were cleared from the data sets, 258 (M = 26.46; SD = 4.48) data in the second sample. There were 258 teachers (181 female and 77 male) with ages ranging from 23 to 64 and seniorities ranging from 1 to 46 years. The majority of them (n = 223, 86.4%) had bachelor’s degrees, 22 (8.5%) had 2-year degrees, and 13 (%5) were postgraduates.
Research Instruments and Procedures
A demographic information form (gender, age, seniority, and degree), some questions about research practice such as following scientific journals related to education, doing research, and the “Research Literacy Scale” were used as data collection tools. The data collection procedure was similar to that used in Study 1.
Data Analysis
LISREL 8.80 (Jöreskog & Sörbom, 2001), IBM SPSS for Windows Version 22, and JASP 0.14.1 software program were used for analysis. All statistical tests were performed using a significance level of p < .05.
Data Screening
The missing data were below 1% (Sample 2 = 0.3%) and randomly distributed in the sample (MCAR test, p > .05). So, we replaced them with new scores adjusted with the EM algorithm. Four univariate and six multivariate outliers were excluded from the sample. The normality and linearity procedures were similar to those used in Study 1, and it was found that the requisite qualifications were met.
Confirmatory Factor Analysis
CFA was performed using the maximum likelihood estimation method and covariance matrix to confirm the EFA’s obtained factor structure. We used the Ratio of Chi-Square (χ2) to degrees of freedom named as Normed Chi-Square (χ2/df), Root Mean Square Error of Approximation (RMSEA), Comparative Fit Index (CFI), Non-Normed Fit Index (NNFI), and Standard Root Mean Square Residual (SRMR) to evaluate model fit. Although there is no consensus regarding which fit indices should be reported in studies, the Chi-Square test, the RMSEA, the CFI, and the SRMR are suggested (Kline, 2011). NNFI, one of the incremental fit indices, was also reported because of the most commonly used indices (McDonald & Ho, 2002).
While a normed chi-square value can be accepted below five for the fitting model, it is considered perfect if it is less than two (Hair et al., 2014, p. 630). An RMSEA value below 0.05 indicates a perfect fit; however, if it ranges between 0.05 and 0.08, it is considered a fair fit (Browne & Cudeck, 1992, p. 239). CFI and NNFI indices take values in the range of 0 to 1, and values closer to 1 indicate better fit (Hair et al., 2014). Bentler and Bonnet (1980) suggested that values greater than 0.90 indicate a good-fitting model. Besides, Hu and Bentler (1999, p. 27) recommended that the cutoff value of NNFI and CFI should be 0.95. Also, they pointed out that the cutoff value should be 0.08 for SRMR and 0.06 for RMSEA.
Convergent Validity and Discriminant Validity
In scale development studies, it is recommended to examine the convergent and discriminant validity. Convergent validity means that the items that belong to the same construct are related to each other at least moderate levels (Kline, 2011, p. 71). As suggested by Hair et al. (2014, pp. 618–619), it is examined with (i) factor loading, (ii) average variance extracted (AVE; at least .5), and (iii) construct reliability (CR; at least .7) which is calculated by McDonald omega.
Discriminant validity is the separation of structures from each other (Hair et al., 2014, p. 619), and the items should be less related to the other factors than the factor they are found in (Yaşlıoğlu, 2017, p. 82). To examine discriminant validity, AVE values should be greater than the correlation square between those factors (Hair et al., 2014). Correlations between sub-factors were examined using Pearson correlation analysis.
Reliability
Item-total correlations, Cronbach alpha coefficient (α), split-half test reliability (Spearman-Brown coefficient), Guttman coefficient (λr), Armor theta (θ), and McDonald omega (ω) were calculated to examine the internal consistency of the RLS. Although Cronbach’s alpha is widely used, it has received criticism as it is not related to internal consistency and incorrectly predicts reliability (McNeish, 2018; Peters, 2014). Therefore, different reliability coefficients were also calculated in this study.
Measurement Invariance
We used CFI (ΔCFI ≤ 0.010; Cheung & Rensvold, 2002) and RMSEA difference criteria (ΔRMSEA ≤ 0.010; Chen, 2007) to compare the models for measurement invariance.
Manova
We conducted the MANOVA test to compare teachers’ research literacy sub-factors scores according to FSJE and doing research. First, we tested MANOVA assumptions, which were univariate and multivariate normality, homogeneity of variances, and covariance matrices. We examined Q–Q plots, histograms, skewness, and kurtosis values for univariate normality for each variable. As suggested by Hair et al. (2014, p.34), the skewness and kurtosis values were ±1. We calculated Mahalanobis distances for multivariate outliers (p < .001). Levene’s test results showed that the awareness (F = 1.853, p > .05), attitude (F = 0.564, p > .05), skills (F = 0.946, p > .05), and research use (F = 1.274, p > .05) sub-factors had homogeneity of variances. Box’s M statistic (p > .05) indicated that the covariance matrices were equal.
Results
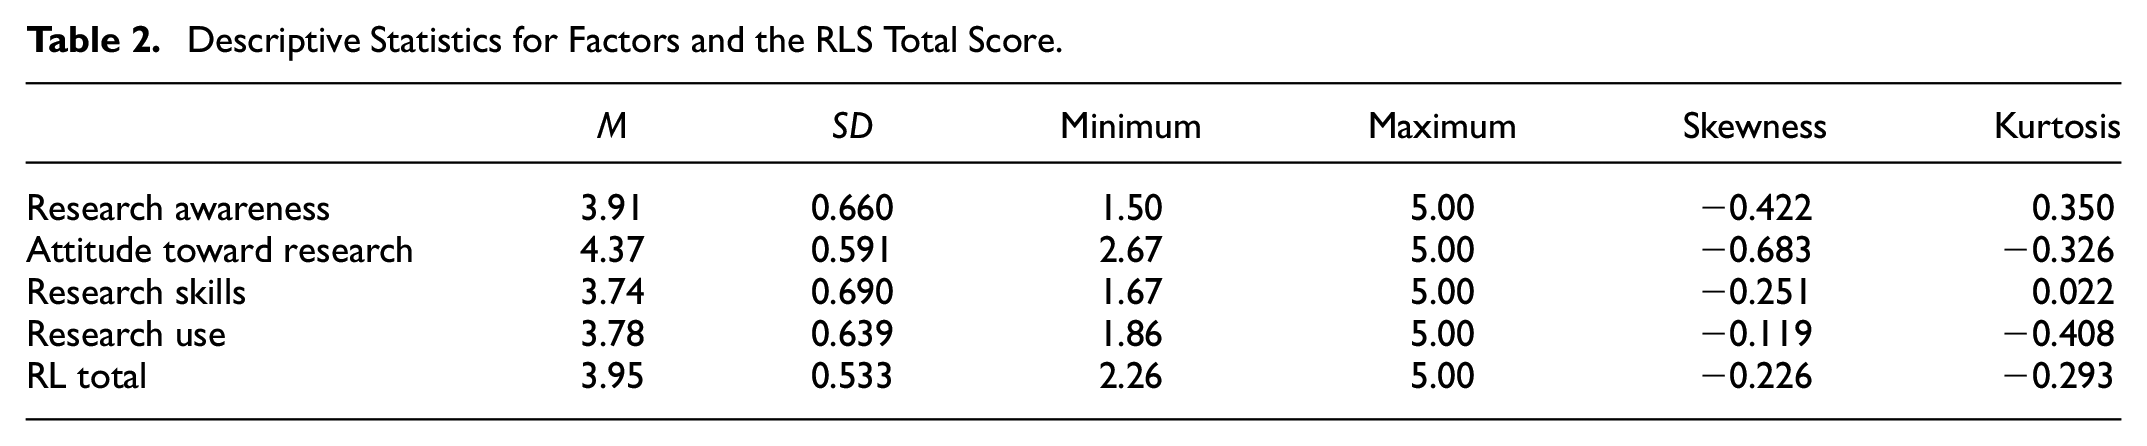
Descriptive statistics for factors and the RLS total score are presented in Table 2. According to mean scores, teachers’ attitudes toward research were positive, and research awareness, skills, and research use were high. All the RLS subfactors and the total score showed symmetrical distributions.
Descriptive Statistics for Factors and the RLS Total Score.
Confirmatory Factor Analysis
CFA was conducted on the 20 items of the RLS with three different models: the single-factor model, the first-order model, and the second-order model (Table 3).
The Results of Confirmatory Factor Analyses.

Single Factor Model
This model required all items loaded on a single research literacy factor. According to the results, it did not fit the data well, χ2 (209) = 1,060.054, p < .001, χ2/df = 5.07, CFI = 0.75, RMSEA = 0.126, 90% CI [0.118, 0.133], SRMR = 0.081, NNFI = 0.072.
First-Order Model
The four-factor structure which was obtained with EFA was verified via χ2 (164) = 421.67, p < .001, and with acceptable model fits as follows: χ2/df = 2.57, RMSEA = 0.078 with 90% confidence interval (CI) [0.069, 0.087], SRMR = 0.069, NNFI = 0.90, CFI = 0.914. Standardized loading estimates were higher than 0.5 [0.61, 0.90], and t-values of items were significant at the .01 level [10.22, 17.03].
At this stage, the modification indices were examined, and the relationships that could cause a significant decrease in the χ2 value were examined. CFA was repeated by drawing the error covariance between the fifth and sixth items in the skills sub-factor (χ2 = 99.10). As a result, χ2 (163) = 316.25, p < .001 decreased, and model fits were as follows: χ2/df = 1.94, RMSEA = 0.060 with 90% CI [0.050, 0.070], SRMR = 0.068, NNFI = 0.93, CFI = 0.94, showing a better fitting model. Standardized path diagram scores of the four-factor structure are shown in Figure 2.

Standardized scores of first-order model of the RLS.
As seen in Figure 2, error variances of the variables were between .19 and .63, which means that the error variances were not at a high level. Besides, the standardized path coefficients of the factors were as follows: For the awareness factor: .61 to .81; for the attitude factor: .62 to .90; for the skills factor: .72 to .75; and for the research use factor .68 to .81. Standardized loading estimates should be at least .5, and values greater than .7 are better. All standardized path coefficients were statistically significant, and as seen in Figure 2, there were no items below .5, and the majority of them were higher than .7. Also, the t-values of items were significant at the .01 level (10.22–17.06).
Second-Order Model
In the second-order CFA, four factors were linked to the research literacy latent variable. The factor structure in which the four-factor model validates the high-order research literacy model is shown in Figure 3.

Standardized scores of the second-order model of the RLS.
The results show that the second-order model had an acceptable fit: χ2 (166) = 436.94, p < .001, χ2/df = 2.63, RMSEA = 0.080 with 90% CI [0.071, 0.089], SRMR = 0.071, NNFI = 0.90, CFI = 0.91. As a result of examining the modification indices, we drew the covariance between S5 and S6 as we did in the first-order model analysis. It was seen that there was an improvement in the results obtained as χ2 (165) = 336.15, p < .001, χ2/df = 2.11, RMSEA = 0.064 with 90% CI [0.054, 0.073], SRMR = 0.07, NNFI = 0.93, CFI = 0.94. When these results were compared to the first-order model, CFI and NNFI were the same in the two models; χ2/df, RMSEA, and SRMR were lower in the first-order CFA. Figure 3 shows that error variances range from .20 to .62 and standardized path coefficients from .62 to .90. T-values are also significant at the .01 level [4.61, 10.33].
Convergent Validity and Discriminant Validity
AVE and CR values were calculated with some formulas suggested by Fornell and Larcker (1981, pp. 45–46), and AVE/CR was found as follows: .56/.83 in the awareness factor, .50/.75 in the attitude factor, .54/.87 in the skills factor, and .56/.90 in the research use factor. Because all AVEs were higher than .5 and all CR values were higher than .7, convergent validity was supported in the study (Table 4).
Correlations and Squared Correlations of Sub-factors, AVE, and CR.

Note: Correlations between sub-factors are above the diagonal (**p < 01. ), and the square of the correlations is below the diagonal.
In Table 4, there were correlations between sub-factors above the diagonal, and the square of the correlations is below the diagonal. When AVEs and intercorrelations were examined, all AVE values were higher than squared correlations, except in three cases. The squared correlation between research use and skills was .59, and this was greater than the AVE of these two factors. The AVE of skills (.54) was also smaller than the squared correlations between skills and awareness (.55), and the AVE of attitude (.50) was smaller than the correlations between attitude and research use (.52). However, these were very close to the boundary values. Therefore, it can be said that discriminant validity is provided in the scale. Besides, the not very high correlation between factors also indicates discriminant validity.
Item Analysis and Reliability
The item analysis of the RLS, the reliability analysis of each factor of the RLS, and overall RLS were presented in Table 5.
The Item Analysis and Reliability of the RLS.

According to results, item-total correlations ranged from .48 to .72. Reliability coefficients were satisfactory because Cronbach’s alpha, (RLS = .94, Skills = .88, Research Use = .90, Attitude = .83, and Awareness = .83); Spearman-Brown (RLS = .91, Skills = .88, Research Use = .88, Attitude = .87, and Awareness = .84); Guttman λ (RLS = .91, Skills = .86, Research Use = .87, Attitude = .78, and Awareness = .83) values of the scale and sub-factors were higher than .7. Also, McDonald’s (1999) omega was calculated, which is a commonly suggested measure of composite reliability (McNeish, 2018). As mentioned above, it was calculated while examining convergent validity and obtained satisfactory values (.75–.90). Moreover, theta was calculated as recommended by Armor (1973), and it was found to be .93. It can be interpreted that the internal consistency of the scale was high and that the items had the power to represent a similar purpose.
Measurement Invariance Across Gender
We tested configural (Model A), metric (Model B), scalar (Model C), and strict (Model D) invariance models across gender in the first-order four-factor model via multi-group confirmatory factor analysis (Table 6). Configural invariance serves as the fundamental model with unconstrained factor loadings, factor correlations, and error variances. Metric invariance, on the other hand, entails fixed factor loadings, while still allowing free factor correlations and error variances. Scalar invariance is a model where both factor loadings and factor correlations are fixed, but error variances remain free. Lastly, strict invariance describes a model in which all factor loadings, factor correlations, and error variances are constrained (Başusta & Gelbal, 2015).
Measurement Invariance Across Gender in RLS.

In order to determine the measurement invariance across gender, all models were hierarchically compared with each other. We used the CFI and RMSEA difference tests because, compared to the often-used chi-square difference tests, these results show higher performance in finding measurement non-invariance and are more resistant to changes in sample size (Chen, 2007; Cheung & Rensvold, 2002). We interpreted the ΔCFI based on the cutoff value (ΔCFI ≤ .01) recommended by Cheung and Rensvold (2002). In evaluating ΔRMSEA, if the sample is less than 300, Chen (2007) suggested cutoff criteria of <.010. We evaluated the results according to these cutoff values.
As seen Table 6, fit indices revealed that the configural model had acceptable fit to the data across gender: χ2 (292) = 557.039, χ2/df = 1.90, CFI = 0.907, RMSEA = 0.084, 90% CI [0.073, 0.094], and SRMR = 0.077. Although RMSEA slightly exceeded 0.80, normed χ2 and CFI had a good fit and SRMR acceptable fit. This means that male and female teachers used the same conceptual perspectives in responding to the scale items.
Secondly, to assess metric invariance, we compared the fit of the metric model with the fit of the configural model. Changes in fits across gender were as follows: ΔCFI = 0.001, ΔRMSEA = 0.002. These values were less than the .010 threshold as mentioned above, indicating that factor loadings were invariant across gender.
Subsequently, we compared the scalar and metric models in order to measure the scalar model. We obtained values of ΔCFI = −0.003 and ΔRMSEA = 0.003. Because these values did not exceed the critical .010, scalar invariance of the scale was provided across gender. This result indicated that the relationships between the characteristics measured by the scale items and the sub-factors of the RLS were similar for male and female participants. Besides, indices showed that the scalar invariance model exhibited a good fit to the data.
Finally, to test the strict invariance, the error variances of the items were equalized between the groups, and the multi-group CFA results were compared with the scalar invariance model. Fit indices showed that the strict invariance model also had a good fit to the data. Difference indices showed no significant changes with ΔCFI = 0.000, and a minor alteration was observed with ΔRMSEA = 0.002.
ΔCFI and ΔRMSEA of this comparison were less than 0.01, indicating that strict equivalence was achieved. All of these demonstrate that the scale has measurement invariance according to the gender variable.
Teachers’ Research Literacy According to FSJE and Doing Research
The MANOVA test was conducted to determine whether FSJE and doing research caused a significant difference in teachers’ research literacy. According to descriptive data, only 73 of 258 teachers (28.3%) followed an education-related journal and 82 of them (31.8%) did research. MANOVA results presented in Table 7 demonstrated that except for the attitude sub-factor (p > .05), there were significant differences according to FSJE in the dimensions of awareness, skills, and research use (p < .05).
MANOVA Results of Research Literacy in the Comparison of Variables.

R 2a = .087 (Adj. R2 = .076). R2b = .126 (Adj. R2 = .115).
R 2c = .019 (Adj. R2 = .007). R2d = .072 (Adj. R2 = .061).
As seen Table 8, research use (4.03 ± 0.57), skills (4.00 ± 0.60), and awareness (4.14 ± 0.59) scores of teachers who followed educational scientific journals were significantly higher than those who did not. When the main effect of FSJE was examined, it was understood from the eta square value that it affected research use the most (η2 = .46). In addition, FSJE affected awareness (η2 = .37) and attitude (η2 = .34) at a moderate level.
Descriptive Statistics for FJSE and Doing Research.

There were significant differences according to the doing research variable in the research use, skills, attitude, and awareness (p < .05). The scores for doing research were found to be significantly higher than those who did not conduct research in all dimensions. According to eta square values, doing research had the greatest effect on skills (η = .56). Besides, doing research had an effect on research use (η2 = .31), awareness (η2 = .28), and attitude (η2 = .18). The joint effect of doing research and FSJE did not cause a significant difference in any of the sub-factors. A 0.076% of research use, 0.115% of skills, 0.007% of attitude, and 0.061% of awareness were explained by the FSJE and doing research variables.
General Discussion
Given the growing importance of research-based practice, developing and validating a scale that measures RL is essential to teachers’ research engage with and in. So, the present study aims to develop and validate the RLS, test the internal consistency of the scale, and subsequently investigate whether teachers’ research literacy differs according to FSJE and doing research. We can discuss the findings of the first research question on three bases in order: methodological, conceptual, and theoretical.
There are some methodological criticisms of RU tools in the literature. In a systematic review of 18 URE instruments, only three scales provided information on both reliability and validity. Seven of them assert some validity, but no evidence was typically provided to substantiate these claims. Five stated Cronbach’s α for reliability, and only two instruments’ overall scale reliability (Lawlor et al., 2019). These determinations are critical because, in scientific research, data should be collected with a valid and reliable measurement tool to reveal accurate findings. This study has made a methodological contribution to the field by taking these criticisms into account. In brief, we followed this process: EFA was conducted in the initial stage of scale development, revealing a four-factor structure consisting of 20 items. Based on the EFA, the four sub-factors interpreted to reflect a common theme of the items in the scale were named research awareness, attitude toward research, research skills, and research use. The variance explained by these four factors is 62.60%, over 60% as Hair et al. (2014, p. 109) stated. Except for the factor loadings of B15 (0.478) and B4 (0.465) items, the others have factor loads over 0.5. As stated Hair et al. (2014), ±0.30 or ±0.40 values of factor loadings are acceptable, but they should be higher than ±0.50 for practical significance. Therefore, these values show that factor loadings have practical significance. Then, CFA was conducted to verify the factor structure and to ascertain teachers’ research literacy. First, we tried a single-factor model in CFA, since in the EFA result, the variance explained by the first factor was dominant. The results showed that the single-factor structure had poor fit values. Failure to verify a single factor can be interpreted as an indication that the structure intended to be measured has more than one sub-factor. Subsequently, the first-order four-factor model was tested, and we determined that the standardized factor loadings of the model were high, the t-values were significant, and the fit indices considered in the model evaluation indicated a good fit between the data and the model structure. Besides, we tested the second-order model and determined appropriate structural model fit. This provided evidence that research literacy consists of those four factors. In addition to conducting construct validity, we examined the nomological, convergent, and discriminant validity of the scale and obtained satisfactory results. Thus, we strengthened the validity of the evidence, as suggested by Lawlor et al. (2019).
For the reliability of the scale, we examined item-total correlations [.454–.754] and as Field (2005, p. 672) suggested, all values were found to be higher than .30. The Cronbach’s alphas of the four sub-factors of RLS were .88, .83, .90, and .83, respectively. The Cronbach’s alpha of the total scale was .94. As Field (2005) and Hair et al. (2014) stated, all of them were above 0.7. Besides, Spearman-Brown coefficients of four sub-factors were above 0.8. Guttman coefficient and McDonald omega are above .8 except attitude (respectively; .78, .75). This may be because there are three items in the attitude factor. Moreover, Armor theta is high (.93). Thus, RLS demonstrated adequate internal consistency and reproducibility. In other words, the internal consistency of the factors that make up the research literacy criteria of the teachers and their power to explain the structure is strong. Finally, we tested measurement invariance to see whether the factor structure of the RLS and the perception of the items changed according to gender. Configural, scalar, metric, and strict invariance were achieved across gender. As a result, the factor structure of the scale and the perception of the items did not change for men and women teachers.
Taken together, these results show that the RLS is a valid and reliable measurement tool to measure teachers’ research literacy. The RLS is a self-report data collection tool with a 5-point rating scale that measures perceived research literacy by teachers. The results of the second order can be interpreted as allowing a total score to be obtained. Therefore, researchers can use the sub-factors separately or by taking the total score according to their research purposes. High scores obtained from the factors indicate high research literacy.
As well as methodological contributions, these results also bring a conceptual contribution to the literature on research-based practice in education. We accepted research literacy as a behavior that can emerge in a particular process and created a model according to TPB. We have also provided a more comprehensive perspective by including research utilization and research conduct together on the same scale. According to our results, it is possible to define RL as “having awareness of research, engagement in and with research, belief in the importance and usefulness of research, in other words a positive attitude towards scientific research, having sufficient skills in accessing, reading, and conducting research, and using research in professional practice.” So, by testing it empirically, we contributed to the definition of research literacy for teachers, which has been expressed conceptually.
The first factor, research awareness aims to measure teachers’ prior knowledge of doing research and reading. The attitude toward the research factor attempts to measure the attitude that research is essential for the teaching profession, that it benefits professional development, and that educators, including teachers, should benefit from this research in their professional practices. The research skills factor emerged as an inclusive dimension of Beaudry and Miller’s (2016) types of research literacy. It includes information/technological literacy, such as the ability to access research on a subject that the teacher wants to investigate; verbal literacy, such as the ability to discuss these subjects; and visual literacy, such as the ability to understand visuals such as tables and figures in research. It also includes statistical literacy with the ability to understand the results of statistical analysis. Statistical literacy is also a sub-factor in studies on the research literacy of university students (Groß-Ophoff et al., 2017; Jemsy, 2018; Yusof et al., 2018). All these literacy-related features are united in the skills dimension. Finally, research use includes features such as reading research for teachers’ professional and pedagogical development, reflecting this knowledge in their professional practices, enriching their daily practices with research-based knowledge, and consulting research.
In the theoretically based discussion, awareness, attitude, and skill are the dimensions of RL, which shows that Ajzen’s (1991) theory is supported in this study context. In TPB, awareness is expressed as a background variable in the emergence of the behavior. Attitude explains intention, and intention explains behavior. Perceived behavioral control explains behavior through intention and directly explains behavior without intention. In this study, we considered all of them as a variable directly affecting RL, and our model was proven. On the other hand, the variance of the research skill is the highest among the factors. This finding supports the consideration of perceived behavioral control as a variable that directly explains behavior in TPB. In parallel to these findings, Bulgurcu et al. (2010) found that attitude, normative beliefs, and self-efficacy to comply significantly impact employees’ intent to comply with the information security policies. Also, information security awareness influences both attitude and outcome beliefs positively. In another study on the same subject, Vilander (2021) found that in comparison to knowledge, attitude is a more powerful predictor of behavior. Results of the research on the mediation between knowledge and behavior revealed that attitude mediates the majority of this influence. Some findings demonstrate that increased awareness helps people translate their intentions into actions (Chatzisarantis & Hagger, 2007). Wathuge and Sedera (2021), who examined internet use and awareness in a longitudinal study, found that awareness alone can change behavior. In contrast to these findings, Greisel et al. (2023) hypothesized that a model developed from TPB might describe evidence-informed reasoning in pre-service teachers. They examined behavior both subjectively and objectively. The hypothesis could only be partially confirmed for subjective behavior and could not be confirmed at all for objective behavior. Also, in the first-order factor model, self-efficacy was negatively associated with objective behavior, but the second-order factor model found no relationship between the two. The authors interpreted this result as unskilled respondents not being aware of their lack of competence.
In the second research question, we sought the differentiation of teachers’ RL according to the FSJE. The results show that, except for the research attitude factor, teachers who followed a scientific-educational journal had significantly higher awareness, skills, and research use scores. Knowing how to access academic journals to follow scientific research is necessary. Therefore, it is anticipated that there will be a difference in the awareness dimension in favor of individuals who read scientific journals. As teachers follow and read scientific research, they will be able to discuss scientific issues, understand and interpret statistical information, tables and figures. Teachers’ information literacy, visual literacy, statistical literacy, and numeracy have improved over time. The significant difference in the RU indicated that FSJE was reflected in professional practices. It also showed that research-based knowledge could be used directly or indirectly in educational settings. The absence of a significant difference in the attitude dimension according to FSJE can be explained by the fact that teachers have positive feelings toward research even if they do not follow scientific journals related to education. As stated before, teachers’ attitudes toward research are generally positive (Baş & Kıvılcım, 2017; Kostoulas et al., 2019; Williams & Coles, 2007).
In terms of awareness, attitude, skills, and the use of research, we observed a substantial difference between teachers who conducted research and those who did not. Teachers who had experience in a research process scored higher in all dimensions. Moreover, the effect of doing research on skills was higher than on the other sub-factors. These results point to the importance of teachers’ participation in research processes. Teachers gaining this experience by doing research during postgraduate education or projects carried out at school will ensure the development of their RL. In Bell et al. (2010), whether self- or researcher-initiated, practitioner involvement in research almost always seemed to engage them in the process as well. In this respect, action research is a guiding and essential tool for teachers’ self-improvement (Smith & Sela, 2005). Finally, we tested the joint effect of doing research and FSJE, and there was no significant difference in any of the sub-factors. While both variables caused significant differences separately, according to the common effect, there was no significant difference in teachers’ awareness, attitudes, skills, and research use.
Limitations and Further Research Implications
In this study, although we developed a scale by considering the methodological, conceptual, and theoretical problems in the field, the current study has some limitations. The sample size in Study 2 was relatively small. Confirmatory factor analyses should be performed with larger samples in future studies. Future studies should include larger samples to conduct confirmatory factor analyses and ensure the scale’s robustness. Additionally, the sample size of postgraduate teachers was insufficient to allow for a comparison between individuals with bachelor’s and postgraduate degrees. This comparison contributes to research literacy fields. Further studies should obtain a balanced sample for this comparison with more heterogeneity. While the current paper demonstrates good psychometric quality, it is important to consider the potential impact of social desirability bias due to the self-report nature of the scale. The current study was cross-sectional. Subsequent studies should assess both test-retest reliability and employ longitudinal designs to establish the scale’s predictive validity. Additionally, researchers are encouraged to investigate measurement invariance across different variables to ensure the scale’s validity across diverse populations. This approach will provide further evidence supporting the validity and reliability of the newly developed scale.
We developed the scale to examine the research literacy of teachers. The scale’s validity can also be tested with samples of other education stakeholders, such as school administrators, supervisors, and inspectors. Future research should explore the research literacy of other stakeholders, as improving only teachers’ research literacy is insufficient for schools to transform into research-based communities. Investigating the research literacy of these stakeholders will contribute to the effectiveness of research dissemination and utilization across the educational system.
In the current study, examining RL according to TPB contributed to the field by providing a theoretical discussion. Future research can offer different perspectives on research literacy by taking support from various theories. In this study, we tested teachers’ research literacy according to doing research and FSJE variables. In addition, different variables can be investigated by considering the steps in a research process related to research experience. Especially the low R2 indicates the dark field that needs to be investigated regarding teachers’ research literacy. Therefore, future studies should examine various factors influencing teachers’ research literacy, such as their access to research resources, collaboration opportunities, and professional development programs.
Implications for Policy and Practice
The findings of this study have significant implications for educational policy and practice. The emergence of sub-factors such as awareness, attitude, and skills in research literacy indicates potential avenues for improving teachers’ research literacy. Additionally, the significant impact of variables related to research experience on teachers’ research literacy sub-factors underscores the importance of this experiential component. To enhance this experience, teachers can be encouraged to pursue postgraduate education, with the support of educational authorities. Additionally, schools can organize research literacy courses for teachers.
Türkiye has at least one university in each province, and many of these institutions have a Faculty of Education and Research Institutes. MoNE and the Higher Education Board should provide opportunities and support to teachers. Collaboration between teachers, school principals, and academics should be strengthened with the support of the MoNE and Higher Education Board. Besides, school administrators should create a culture that gives importance to research and learning at school and should give encouragement and support in this context. School internet infrastructures can provide free access to databases for access to scientific research. An infrastructure can be created to provide easy access to the education research of the MoNE. Moreover, MoNE should implement policies to promote research literacy and ensure holistic development among teachers. Policymakers should recognize the importance of research literacy among teachers and prioritize integrating research-based practices in schools. Unless research literacy is seen as a natural part of the profession with policies, teachers’ efforts will remain at the individual level. Also, research literacy can be used as a criterion in the performance evaluation of teachers. Finally, MoNE should investigate the variables associated with teachers’ research literacy to inform targeted interventions and support. By revealing these variables, the actions to be taken at the individual and organizational levels can be determined more concretely.
Conclusion
There is a greater need to operate research-based processes in schools. Teachers’ research literacy needs to be developed to become research-based schools. This study provides a basis for the assessment of teachers’ research literacy. The research was carried out by meticulously following the scale development steps. We both developed the scale content on the conceptual model and presented various findings regarding validity and reliability. While research is a measurement tool that researchers will use, it will also be a tool for schools to become research-based societies by enabling the evaluation of educators. It will contribute to the political initiatives to be made to improve the research literacy of teachers. On the other hand, this study contributed to the relevant literature in conceptualizing research literacy. It is hoped that this research will contribute to a deeper understanding of research literacy for teachers.
Footnotes
Acknowledgements
We thank all the teachers who participated in this research.
Author Note
A part of this research was presented as an oral presentation at the 7th International Eurasian Educational Research Congress, 10 to 13 September 2020.
Declaration of Conflicting Interests
The author(s) declared no potential conflicts of interest with respect to the research, authorship, and/or publication of this article.
Funding
The author(s) received no financial support for the research, authorship, and/or publication of this article.
Ethical Approval
We did not get ethics committee approval because it was not mandatory when we collected data in Türkiye In order to implement the data collection tool, we obtained application permission from the Provincial Directorate of National Education. Volunteering was taken into account in answering the scale during the implementation phase.