
Abstract
Athletes’ goal orientations have been associated with a wide array of sport-related behaviors, thoughts, and perceptions. The two main goal orientations defined in the achievement goal theory framework are task and ego orientations. The task and ego orientation questionnaire (TEOSQ) was developed to assess levels of task and ego goal orientations in sport-related settings and is widely used in research in the field of sport psychology. Its use in research rests on the assumption that sum scores of the TEOSQ can be used to order individuals by their levels of the two goal orientations. In this study, the soundness of this assumption is evaluated using Mokken scale analysis (MSA). TEOSQ responses from 749 football players were used in the analysis. Both the monotone homogeneity model and the double monotonicity model were fitted. The scalability coefficients for both the task and ego orientation subscales were 0.45 indicating a moderately good scalability. Invariant item ordering did not hold for either of the two subscales. There is definite room for improvement in the TEOSQ. Several improvement suggestions are made and further research directions are discussed.
Goal orientations refer to different ways of perceiving the purpose of achievement. In the field of sport psychology, athletes‘ sport-related goal orientations have been associated with a wide array of behaviors, cognitions, and attitudes in achievement-related settings. The two main goal orientations are task orientation and ego orientation. In general, athletes with high task orientation and low ego orientation have more favorable and adaptive responses in achievement-related sports settings (e.g., Duda, 1989; Duda et al., 1995; Lameiras et al., 2014; Nicholls, 1984; Ring & Kavussanu, 2018). The Task and Ego Orientation in Sport Questionnaire (TEOSQ) was developed to assess respondents’ levels of task and ego orientations with its two subscales (Duda, 1989). The scale is mainly used for research purposes in the field of sport psychology (see for instance Duda et al., 1995; Kristjánsdóttir et al., 2022; Lameiras et al., 2014; Newton & Duda, 1993; White & Zellner, 1996).
The basis for using the task and ego subscales of the TEOSQ in research is that sum scores on the subscales can be used to order individuals based on how task and ego-oriented they are. This study aims to examine whether the ordering of individuals by their task and ego subscale sum scores is legitimate. So far, most research on the properties of the TEOSQ has used common statistical methods such as factor analysis to assess the dimensionality of the scale (e.g., Chi & Duda, 1995; Duda, 1989; Duda & White, 1992; Li et al., 1996, 1998). However, questions about the validity of using the sum scores of the two subscales to order people are best answered by assessing the scale with Mokken scale analysis (MSA). To our knowledge, the subscales of the TEOSQ have not been examined with MSA to date. This study is, therefore, the first to assess the legitimacy of using sum scores on the task and ego subscales of the TEOSQ to order individuals by their levels of each goal orientation
Achievement goal theory addresses the influence of individuals‘ aim or purpose in achievement settings. Originally centered around academic achievements, the achievement goal framework has since been applied to other achievement settings such as sports (Duda, 1989; Nicholls, 1984). In sporting settings, the theory states that individual differences in how athletes view their ability and define their success are fundamental to understanding motivational processes. These differences then influence achievement-related behaviors, cognitions, and feelings (Duda, 1989). The theory encompasses dynamic aspects of achievement goals as well as more stable, dispositional aspects known as goal perspectives or goal orientations (Duda, 2001).
The achievement goal theoretical framework identifies two main goal orientations: task and ego orientation (Nicholls, 1984, 1989). The two different goal perspectives are assumed to be orthogonal as opposed to bipolar, that is, people can be high in both ego and task orientation, low in both, or high in one and low in the other (Duda et al., 1995; Nicholls, 1984, 1989). Those who are task-oriented focus on themselves and their improvement. They want to acquire new skills and exert effort in the tasks at hand. For task-oriented athletes, the main goal of achievement is personal improvement, which therefore evokes feelings of success. In contrast, those who are ego-oriented compare their performance and skills to other people‘s. When performing a task, the focus of ego-oriented athletes is on demonstrating their athletic ability and doing better than their peers. Thus, ego-oriented athletes experience success when they outperform others on some tasks, for example, scoring more goals or learning a skill faster than others (Duda et al., 1995; Nicholls, 1984, 1989).
According to theory, the effect of goal perspectives on achievement behavior and cognitions is in part mediated by the perceived level of ability. Ego-oriented individuals tend to display more maladaptive achievement behaviors (e.g., giving up easily, lowered effort), especially those who regard their ability as low. Those who are task-oriented, however, tend to display positive achievement behavior regardless of their perceived ability (e.g., Duda, 1989; Nicholls, 1984).
Research on the correlates of these two goal orientations has shown they are connected to a wide array of behaviors, cognitions, and beliefs. Regarding behavior, task orientation has been linked to prosocial behavior (Kavussanu, 2006), increased cooperative behavior (Lameiras et al., 2014)—in contrast, high ego orientation has been associated with antisocial behavior (Hurst et al., 2021; Kavussanu, 2006), fear of failure (Gómez-López et al., 2019), and decreased cooperation (Lameiras et al., 2014). In addition, a recent study of cheating in sporting settings found that acceptance of cheating correlated positively with ego orientation and negatively with task orientation, and participants who cheated were more ego-oriented and less task-oriented than others (Ring & Kavussanu, 2018).
Goal orientations have also been connected to achievement-related cognitions. Task-oriented athletes have higher moral functioning (Kavussanu & Ntoumanis, 2003), increased intrinsic motivation (Duda et al., 1995), and more mental toughness (Alvarez et al., 2017). On the other hand, those who are more ego-oriented have lower moral functioning (Kavussanu & Ntoumanis, 2003), decreased intrinsic motivation (Duda et al., 1995), and are more likely to experience disrupted concentration prior to or during an athletic performance (White & Zellner, 1996) and have more competitive anxiety (Tomczak et al., 2022). In addition, goal perspectives are associated with a variety of sport-related beliefs and attitudes.
Task orientation is associated with the belief that the purpose of sports is to enhance self-esteem and encourage cooperation and hard work (Duda, 1989), and the belief that effort has the most impact on athletic performance (Newton & Duda, 1993) and values of responsibility, integrity, and honesty (Berengüí et al., 2022). Ego orientation, however, is associated with beliefs that the purpose of sport is to enhance athletes’ social standing (Duda, 1989), that ability is the biggest influence on performance (Newton & Duda, 1993), believing that illegal advantages (such as performance-enhancing drugs) lead to success (White & Zellner, 1996), and viewing aggressive acts in sports as more legitimate (Duda et al., 1991).
In sum, goal perspectives may have important implications in sport, as athletes’ levels of task and ego orientation are associated with how they cope with and behave in sport-related achievement settings. As goal orientations in sports are an active domain of research, accurately assessing the levels of these orientations is important for research results to be valid and applicable.
Originally, an inventory of items to measure task and ego orientations in classroom settings, the Motivational Orientation Scale (MOS), was developed by Nicholls and his colleagues (Nicholls, 1989). The MOS was later modified by Nicholls and Duda to apply to sport-specific settings for use in research. The resulting scale is the Task and Ego Orientation in Sport Questionnaire (TEOSQ), which contains two subscales, one assessing task orientation and the other assessing ego orientation (Duda, 1989; Duda & Nicholls, 1992). Some items were taken from the MOS and reworded to apply to sports, while other items were developed specifically for the TEOSQ. Originally, the TEOSQ had 16 items, 8 items for each subscale (Duda & Nicholls, 1992; Whitehead & Duda, 1998).
Initial factor analyses and assessment of psychometric properties led to the removal of three items, resulting in the current version of the TEOSQ (Duda, 1989; Duda et al., 1991; Whitehead & Duda, 1998). The current version is a 13-item scale where seven items constitute the task orientation subscale and six comprise the ego orientation subscale. On the TEOSQ, respondents are asked to consider when they feel most successful in sport and then indicate how much they agree with each of the 13 statements on a five-point Likert scale ranging from one (strongly disagree) to five (strongly agree). One item on the ego subscale, item 9 (I score the most points/goals/hits), is reworded in some studies to apply to the specific sport that respondents in the given study practice, for example, only referring to goals when assessing football players (e.g., Duda, 1989; Duda & White, 1992). In one study, however, it was completely rephrased to “I contribute most to the victory,” to apply to the goalkeepers as well (Van-Yperen & Duda, 1999). It is worth noting that this differential phrasing of an item on the TEOSQ may affect the generalisability and comparability of research results.
In research, the sum scores—or the mean scores—of the task and ego subscales are used as a measure of respondents’ levels of task and ego orientation, where a higher score indicates a stronger orientation.
The effectiveness of using sum scores on the subscales as a measure of goal orientation levels rests on the assumption that the ordering of individuals by sum scores is justified. If this assumption does not hold, the correlation between the subscales’ measures of goal orientations and other theoretically related constructs will be biased downwards. This assumption has been evaluated using confirmatory and exploratory factor analysis.
Confirmatory factor analyses (CFA) of the TEOSQ have supported its two-factor orthogonal structure (Chi & Duda, 1995; Duda & White, 1992; Li et al., 1996, 1998; Morales-Sánchez et al., 2022). Studies using principal component analyses (PCA) have also found that two uncorrelated factors provide the best fit to TEOSQ data (Duda, 1989; Van-Yperen & Duda, 1999). However, in one of these studies, an older 15-item version of the TEOSQ was used. Results presented only included 12 items—6 for each subscale, as other items’ factor loadings were below 0.4. Item 7 (I learn a new skill by trying hard) was of the task subscale was excluded for this reason (Duda, 1989).
In exploratory factor analysis, the two factors of ego and task orientation also emerged, further supporting the hypothesized factor structure of the TEOSQ (Duda & White, 1992). Research on models with and without correlation between the two factors has not found clear evidence that the factors are not correlated (Li et al., 1996, 1998). Theory dictates that the two factors are uncorrelated, but a recent meta-analysis found that, on average, there’s a weak, positive correlation between the two orientations (Lochbaum et al., 2016).
Only two studies, using CFA, reported the communalities of the items, that is, the proportion of item variance explained by the task or ego orientation factors. In both studies, item 8 (I work really hard) had the lowest communality of the task subscale items—0.35 in one study and 0.52 in the other. For the ego subscale, item 6 (Others mess up and I don’t) had the lowest communality in one study (0.46; Li et al., 1996) and item 1 (I’m the only one who can do the play or skill) in the other (0.52; Li et al., 1998).
In sum, factor analytical research supports that the two hypothesized factors describe the variability among the TEOSQ items. However, these results provide insufficient information on the validity of using the sum score to order individuals. Firstly, the percentage of common variance explained by each of the two factors is not provided in these papers, but within the framework of factor analysis, this information is a natural measure of how justified it is to use the sum score to order people (see for instance Ten Berge & Sočan, 2004). Secondly and more importantly, factor analytic models, whether they ignore the ordinal nature of the data and treat the response as they were on an interval scale or attempt to use a stochastic model to link the ordinal data to an underlying continuous variable, make unnecessary stringent assumptions for evaluating the validity of using the sum score to order persons.
A better approach for evaluating the justification of using the sum scores of the two TEOSQ subscales to order people is based on an ordinal theory of test scores such as the Mokken scaling analysis (MSA; Mokken, 1971; Sijtsma & Molenaar, 2002; Sijtsma & van der Ark, 2016).
MSA assumes unidimensionality of the item set, that is, that all items in each of the subscales are measuring the same latent trait, task goal orientation, and ego goal orientation. Local independence of items and monotonicity of item (step) response functions are also necessary requirements for the validity of using the sum score as a tool to order individuals and those assumptions are tested within the MSA approach.
The assumption of local independence refers to item scores depending solely on respondents’ levels of the latent trait being measured. Thus, if the level of the task goal orientation is kept constant, item scores should be independent. The same applies to ego goal orientation
The requirement of monotonicity means that the probability of endorsing an item remains constant, or increases (i.e., does not decrease) as the strength of the latent trait being assessed increases. Thus, the probability of agreeing with an item in each of the subscales should not decrease as the tendency of the task and ego goal orientations increases. If the three main conditions of MSA hold, it warrants a computation and interpretation of the so-called scalability coefficients. In MSA, a scalability coefficient provides information on whether the set of items intended to measure the task goal orientation and ego goal orientation constitute an ordinal scale precise enough for measurement. If the scaling coefficients are high enough and the other conditions hold, it is justifiable to use the sum score of the subtests to order individuals on the latent task and ego goal orientation variables. (Sijtsma & Molenaar, 2002; Sijtsma & van der Ark, 2016).
Additionally, a stricter model of invariant item ordering (IIO) can be assessed, if the three main conditions hold. If items in the two subscales are ordered with respect to their mean scores and hierarchical pattern of the ordering of items is the same for each value on the task- and ego goal orientation latent variables, the items in the subscales have IIO. If this is the case, every respondent answers all items in the two subscales in exactly the same order in the hierarchy. A high mean score for an item means that it is more difficult for respondents to agree with the item related to either the task or the ego goal involvement and a low mean score the opposite, that is, that it is less difficult for them to agree with the item. Invariant item ordering is therefore convenient for the interpretation of the sum score of the task- and ego goal orientation subscales and for comparison between different respondents (see Sijtsma & Junker, 1996 for a more detailed discussion on the practical implications of IIO).
Thus far, no study has used MSA to assess the two subscales of the TEOSQ. The current study aims to improve this and will be the first to use MSA to assess the legitimacy of using sum scores of the task- and ego orientation subscales of the TEOSQ to order individuals by their goal orientation.
Method
Participants
All affiliate registered football players in Iceland turning 16 in 2020 and 2021 were invited to participate, so data was collected at two different time points. Of the 1,452 registered 16-year-old football players, 758 (52.2%) responded to the TEOSQ. Of the respondents, 588 (77.6%) were male and the majority, 690 (91.0%) played at level 1—the second highest professional level in the Icelandic football league system. The football players either responded to the TEOSQ in 2020, 331 (43.7%), or 2021, 427 (56.3%).
Measures
The Icelandic version of the Task and Ego Orientation in Sports Questionnaire (TEOSQ) (Duda, 1989) was used to assess the football players’ goal orientations. The scale contains 13 items, 7 forming the task orientation subscale, and the remaining 6 constituting the ego orientation subscale.
The scale was translated from English to Icelandic by two individuals who independently translated the scale. The two individuals who translated the scale then compared the translations and came to conclusions regarding the final wording of the translations. Finally, a psychology professor evaluated the translated items and compared them to the original meaning of the items.
Respondents read the statement I feel most successful in sport when… and each item completes this statement. Respondents indicate their agreement with the items on a five-point Likert scale where 1 = strongly disagree, 2 = disagree, 3 = neutral, 4 = agree, 5 = strongly agree. Traditionally, the average score on each subscale is computed so respondents’ scores range from 1 to 5, with higher scores on each subscale indicating a stronger orientation. In this study, to conform to MSA tradition, sum scores will be used rather than average scores. In addition, the sum scores will be computed so that scores for each item range from 0 to 4. Thus, in the current study, scores on the task subscale range from 0 to 28, and scores on the ego subscale range from 0 to 24. The 13 items of the TEOSQ are presented in Table 1.
Items of the TEOSQ.

Procedure
The data in this study was originally collected for other research projects, and the original data collection included other questionnaires and fitness tests. First, participants underwent the physical tests, and then they answered the questionnaires. The items of the TEOSQ (and other questionnaires) were administered via QuestionPro, an online survey software. Participants answered the TEOSQ on their phones, or if they didn’t have one, a tablet was provided by researchers.
Participants were asked to answer the questions honestly and remain silent while answering. A researcher was present while respondents answered the questions and participants were informed they could ask them for assistance if needed.
After completing the TEOSQ, participants were thanked for their participation and dismissed.
To be eligible for participation, a participant’s parent or a guardian, as well as the participants them selfs, had to read an information sheet about the study and provide written consent for their child/them selfs before participation. When the informational sheet was written, the recommendations of the Icelandic data protection authority were followed. The study respected the principles of the Declaration of Helsinki, and approval for the study was given by the Ethics Committee of Reykjavik University.
Statistical Analysis
Data analysis was conducted in RStudio, primarily using the functions of the mokken package (van der Ark, 2007).
Missing Data
To handle missing data, two-way imputation with normally distributed errors was used (separately for each subscale). To obtain plausible scores for missing data, the two-way imputation uses three values: the mean of the available item scores for the row, that is, person mean (PM), the mean of the observed scores for the column, that is, item mean (IM), and the overall mean (OM) of all observed item scores. Then, the sum of the person and item means, minus the overall mean is computed (PM + IM − OM). Finally, a random error term is added and missing data is substituted with the resulting value (van Ginkel et al., 2007). The error terms are normally distributed with a mean of 0. For the details on computing the sample error variance see van Ginkel et al. (2007). Approximately 1.55% and 0.68% of values were missing for the task and ego subscales, respectively, so missingness was minimal for both scales.
Mokken Scale Analysis
A Mokken scale analysis (MSA; Mokken, 1971) was conducted to assess the legitimacy of using sum scores of the two TEOSQ subscales to order individuals by their task and ego orientations. Within MSA two non-parametric item response theory (IRT) models are tested; the monotone homogeneity model (MHM) and the double monotonicity model (DMM). The MHM is based on the assumption of unidimensionality. The assumptions of local independence, and monotonicity are tested. In the DMM, the nonintersection of items is in addition tested.
Thus, as well as indicating invariant person ordering (as the MHM does), the DMM also implies invariant item ordering (Sijtsma & Molenaar, 2002; Sijtsma & van der Ark, 2016).
Before assessing the MSA assumptions, the item-score patterns were checked for outliers. The number of Guttman errors (the G+ score) and Tukey’s fences were used for outlier detection, as recommended (Sijtsma & van der Ark, 2016). Guttman errors occur when respondents agree with an item that expresses more of the trait that the scale measures but disagree with an item that expresses less of the trait.
Scalability
The scalability of the two subscales of the TEOSQ was assessed by computing the scalability coefficients for each item (Hi), each item pair (Hij), and the whole scale (H) (Sijtsma & Molenaar, 2002). Hij can be computed by dividing the observed number of Guttman errors (GE) in the item pair by the expected number of GE, if the items were independent, and subtracting that value from 1. Hi can be derived by dividing the total number of GE the item is involved in (in the item pairs) by their expected value, assuming independence between the item and all other items and subtracting the resulting value from 1.
Finally, H is computed by subtracting from 1 the total number of GE in the scale divided by the expected total number of GE, if all items were independent (see Sijtsma and Molenaar, 2002) for a more detailed account of these calculations). Thus, the scalability coefficients indicate how close the items are to a perfect Guttman scale, that is, a scale containing no Guttman errors. If the scale contains no GEs, all scalability coefficients equal 1, and the more GEs are present in the item/item pairs/scale, the lower the coefficients will be.
Hi coefficients were required to be higher than 0.3 and Hij were examined to confirm they were nonnegative, following Mokken’s (1971) instruction. Mokken’s (1971) recommended classification of scales with H was used in its’ interpretation, where values lower than 0.3 indicate the items are unscalable, 0.3 to 0.4 indicate a weak scale, 0.4 to 0.5 a medium scale, and 0.5 and higher a strong scale. The use and interpretation of the scalability coefficients rest on the assumptions of unidimensionality, local independence, and monotonicity. The testing and assessment of these assumptions, and the stricter assumption of invariant item ordering, will be discussed in the following subsections.
Local Independence
To assess whether item scores were independent, given respondents’ levels of goal orientations, that is, locally independent, the conditional association procedure was employed (Straat et al., 2016). There are two types of violations of local independence, positive dependence and negative dependence. The conditional association procedure uses two indices, W1 and W3, assessing positive and negative local dependence, respectively. A large W1 indicates that a pair of items in each of the subscales is positively locally dependent and a large W3 suggests that the item pair is negatively locally dependent. These indices are therefore used to flag locally dependent item pairs, and the procedure ultimately returns a set of items that are locally independent (Straat et al., 2016).
Monotonicity
The monotonicity of item step response functions (ISRF) was investigated with the check.monotonicity function. For each item, the function divides respondents into groups based on their sum score on the remaining items, or rest score. In non-parametric IRT, the rest score serves as an assessment of the latent trait. Each rest score group is comprised of respondents with the same rest score or with rest scores within a specific range, depending on when a recommended size criterion is met.
In the current study, the recommended minimum group size of n/10 was used, as the total sample size exceeded 500 (Molenaar & Sijtsma, 2000). Then the function checks, for each item, whether the cumulative probability of an item score higher than or equal to a given score is a non-decreasing function of the rest score. Thus, if the cumulative probability of obtaining a score at least as high as a given score on an item decreases from a one rest score group to a group with a higher rest score, it is considered a violation of manifest monotonicity (Junker & Sijtsma, 2000; Sijtsma & Molenaar, 2002).
The number of violations of manifest monotonicity per item, the size of the violations (i.e., how much the probability decreases), and their statistical significance were examined. The test of violation significance is a z-test with the null hypothesis that the proportions of respondents passing an item step do not differ for two successive rest score groups. The alternative hypothesis is that the proportion is higher for the group with the lower rest score.
In addition, the function outputs summarise values for each item, crit values, which were inspected. Crit values combine the information of Hi values, the frequency and size of monotonicity violations, and their significance, and thus indicate to what extent items are involved in monotonicity violations (Molenaar & Sijtsma, 2000). Molenaar and Sijtsma (2000) suggest that Crit values below 40 imply that violations are due to sampling variations, but values above 80 indicate extreme violations of monotonicity and thus a poor model fit for a given item.
These recommendations for interpreting Crit values were employed in the analysis. For items with violations of monotonicity, the ISRFs and mean item response functions (IRFs) were plotted for visualization of the violations. When plotting the mean IRF of a polytomous item in non-parametric IRT, the item’s mean score is plotted against the rest score groups.
Invariant Item Ordering
Nonintersection, or invariant item ordering, was assessed with Ligtvoet et al.’s (2010) method manifest invariant item ordering (MIIO), and visually by plotting the items’ mean IRFs. The method MIIO is based on the implication that if the item means truly has a specific order in the population, it is implied that the order will hold across all levels of the latent trait—which is approximated with rest score groups in non-parametric IRT. Thus, the means of any item pair should have the same order of size for all rest score groups.
Method MIIO uses overall sample means to determine the size order of item pairs and then inspects if the same order holds for each pair, using conditional sample means for all rest score groups. The rest score groups are formed using the total item score, excluding the two items in the item pair which is being assessed (Ligtvoet et al., 2010). The minimum size of the rest score groups was set to n/10, following recommended rest group sizes for samples of at least 500 (Molenaar & Sijtsma, 2000; van der Ark, 2007).
If the item order is reversed for any rest score group, a one-sided one-sample t-test is computed. It tests the null hypothesis that the two item means do not differ within the rest score group, against the alternative that the order of size is reversed within the group. If the null hypothesis is rejected in any rest score group, the item pair is flagged as not being invariantly ordered (Ligtvoet et al., 2010). To prevent small sample order reversals from affecting the analysis, a minimum violation size was required for testing. The minimum was set at the recommended size of m × 0.03 (m = number of item steps), which was 0.12 in the current study (Ligtvoet et al., 2010; Molenaar & Sijtsma, 2000).
In conjunction with the method MIIO, the mean IRFs of all items were plotted together. As the ISRFs of items can be nonintersecting while their mean IRFs intersect, and the assumption of IIO applies to the items (not item steps), the mean IRFs of all items (on each subscale separately) were plotted and examined for intersections (Meijer & Egberink, 2012; Sijtsma et al., 2011). This is essentially a simple visualization of what the MIIO assesses, that is, which items intersect and where, where item means are plotted against rest score groups for all items in a single plot. To do this, a single split into rest score groups for all items is determined by finding the most common rest score group split when the groups are formed on an item basis. Then the mean for each item for each rest score group is calculated and the means are plotted against groups.
Finally, a scalability coefficient HT, which estimates the degree of invariant ordering of items by respondents (when IIO has been established) was computed. The following rules of thumb were used: HT < 0.3 indicates that item ordering is too inaccurate to be of use, 0.3 ≤ HT < 0.4 indicates that item ordering has low accuracy, 0.4 ≤ HT < 0.5 indicates medium accuracy, and HT ≥ 5 indicates high accuracy (Ligtvoet et al., 2010).
Results
Missing Data
There was no missing data for demographic variables. For the TEOSQ as a whole, 113 values of 9,854 (1.15%) were missing. Summarized by subscales, 82 of 5,306 (1.55%) values were missing for the task subscale and 31 of 4,548 were missing for the ego subscale (0.68%).
In total, 84 participants had missing values. Of those with missing values, 13 had missing values for two items, 3 were missing values for three items, 1 had missing data for four items, and 1 participant had missing values for eight items. One item, number 13 (I do my very best), had noticeably more missing values than the others, with 17 missing values in total. This is the last item of the TEOSQ and is part of the task subscale. The participants with eight and four missing item values were not included in the analysis, as that level of missingness—that is over 30%, was deemed excessive. The remaining missing values were replaced with the two-way imputation method described in the previous section.
Descriptive Statistics
The mean, standard deviation, skew, and kurtosis of the items in both subscales are shown in Table 2. Item 6 had the lowest mean and item 13 had the highest mean. Generally, the item means were higher for the task goal orientation subscale than for the ego subscale. Examination of skew and kurtosis suggests that none of the items have a univariate normal distribution.
Descriptive Statistics of the Task and Ego Subscale Items of the TEOSQ.

Descriptive statistics for sum scores of the task and ego orientation subscales by demographic characteristics are presented in Table 3. The distribution of sum scores for the task subscale was heavily negatively skewed, with a high overall mean. Only one participant scored 0 on the task subscale, a male playing at level 1.
Sum Scores for the Task and Ego Subscales by Gender and Level.

On average, females scored a little higher on the task subscale than males, and level 2 players scored higher than level 1 players. The ego orientation subscale sum scores were approximately normally distributed and the females scored marginally higher on the ego subscale than males.
Mokken Scale Analysis
Before conducting the MSA, item-score patterns were examined for outliers. For the task subscale, an inspection of a fenced histogram of G+ scores indicated that 59 participants had a higher G+ score than the upper Tukey’s fence value of 17.5. When examined with an adjusted boxplot for skewed distributions, 11 participants were identified as having an extreme number of Guttman errors, ranging from 36 to 71 errors. For the ego subscale, 39 participants had G+ scores exceeding the upper Tukey’s fence value of 28. When examined with an adjusted boxplot for skewed distributions, only two participants were identified as having an extreme G+ score, with 61 and 76 Guttman errors.
To assess the influence of the participants with extreme item-score patterns, the analyses were performed without these participants, as recommended by Sijtsma and van der Ark (2016). Results excluding outliers were compared to results for the whole sample for both subscales, revealing that scaling results were not greatly influenced by the outliers, and therefore they were not removed.
Task Subscale
Local independence was assessed with the conditional association procedure. For the seven items of the task subscale, no item pair was flagged as being positively or negatively locally dependent. These results indicate that the assumption of local independence holds. The local independence of the task items is evidence against contextual effects in the subscale.
No statistically significant violation of monotonicity was detected. Three non-significant violations were found, one each in item 2 (crit = 6), item 5 (crit = 7), and item 7 (crit = 7). A visual inspection of monotonicity confirmed that the ISRFs and mean IRFs were monotonically non-decreasing for the task subscale items, the slight decreases in ISRFs for items 2, 5, and 7 were within the confines of the confidence intervals, see Figure 1. Thus, the assumption of monotonicity held for the task subscale.

Monotonicity of ISRFs and mean IRFs for the items of the task subscale.
As the assumptions of local independence, and monotonicity held for the items of the task subscale, scalability coefficients were computed and interpreted. Item and overall scale scalability coefficients are presented in Table 4. Item pair scalability coefficients were in all cases positive and ranged from 0.31 (items 5 and 8) to 0.56 (items 2 and 10). The item scalability coefficients, all exceeded 0.3 and ranged from 0.40 with a 95% confidence interval of 0.31 to 0.48 to 0.50 with a 95% confidence interval of 0.43 to 0.56. Thus, the lower value of the confidence interval for the item with the lowest scalability coefficient was not below 0.3. Items 5 (I learn something that is fun to do) and 13 (I do my very best) had the lowest scalability coefficient values, and item 7 (I learn a new skill by trying hard) the highest.
Scalability Coefficients of the Task Subscale Items of the TEOSQ.

Note. Descriptives are computed based on item scores ranging from 0 to 4.
The overall scalability coefficient of 0.45 with a 95% confidence interval of 0.39 to 0.50 suggests the task subscale is a medium scale according to Mokken‘s (1971) rule of thumb for interpreting overall scalability coefficients. This suggests the scales’ sum scores are moderately useful for ordering individuals by their task orientation. Furthermore, the item scalability coefficients suggest there is room for improvement, particularly in items 5 and 13.
As local independence, and monotonicity were present in the task subscale of the TEOSQ, the stricter assumption of invariant item ordering was explored. Method MIIO did not identify statistically significant mean item size order reversals for any of the item pairs in the subscale. However, a visual inspection of the items’ mean Item Response functions revealed the mean Item Response functions of items 2, 5, 7, 8, and 10 were particularly close together.
Additionally, the mean Item response functions for items 2, 5, and 10 overlapped, and the mean Item response functions for items 7 and 8, see Figure 2. Furthermore, expected item scores for all items on the task subscales were consistently high across all rest-score groups, with item 13 having the highest mean item score across all groups, and item 12 having the lowest expected item score, see Table 3. The order of the remaining five items on the scale is unclear.

Mean item scores by rest score groups for task subscale items.
Lastly, the HT coefficient for the task subscale was only 0.18, indicating that item ordering for the task subscale items is too inaccurate to be of use. In conclusion, invariant item ordering was not present in the task subscale.
Ego Subscale
Results from the conditional association procedure for the ego subscale indicated that the scale‘s six items were locally independent. No item pair was flagged as being positively or negatively locally dependent. Furthermore, the items’ local independence indicates that contextual effects are not a problem for the scale.
One statistically significant violation of monotonicity was detected for item 1 (I’m the only one who can do the play or skill), with a crit score of 29, z = 1.67, p = 0.048. The violation involved rest score group 1 (scores 0–4) and rest score group 2 (scores 5–6). The probability of responding to item 1 with strongly agree, decreased from group 1 to group 2. Further examination revealed that only 4 of 76 participants in group 1 strongly agreed with item 1, while none of the 95 participants in group 2 strongly agreed with the item. In conjunction with the low crit score, the small number of participants involved in the violation suggests the violation is due to sampling variation.
Additionally, three non-significant violations were detected, one each in item 1, item 3 (crit = 7), and item 4 (crit = 8). A visual inspection of ISRFs and mean IRFs supported the conclusion that no substantial violations of monotonicity were present in the ego subscale (see Figure 3), and monotonicity was therefore assumed to hold.
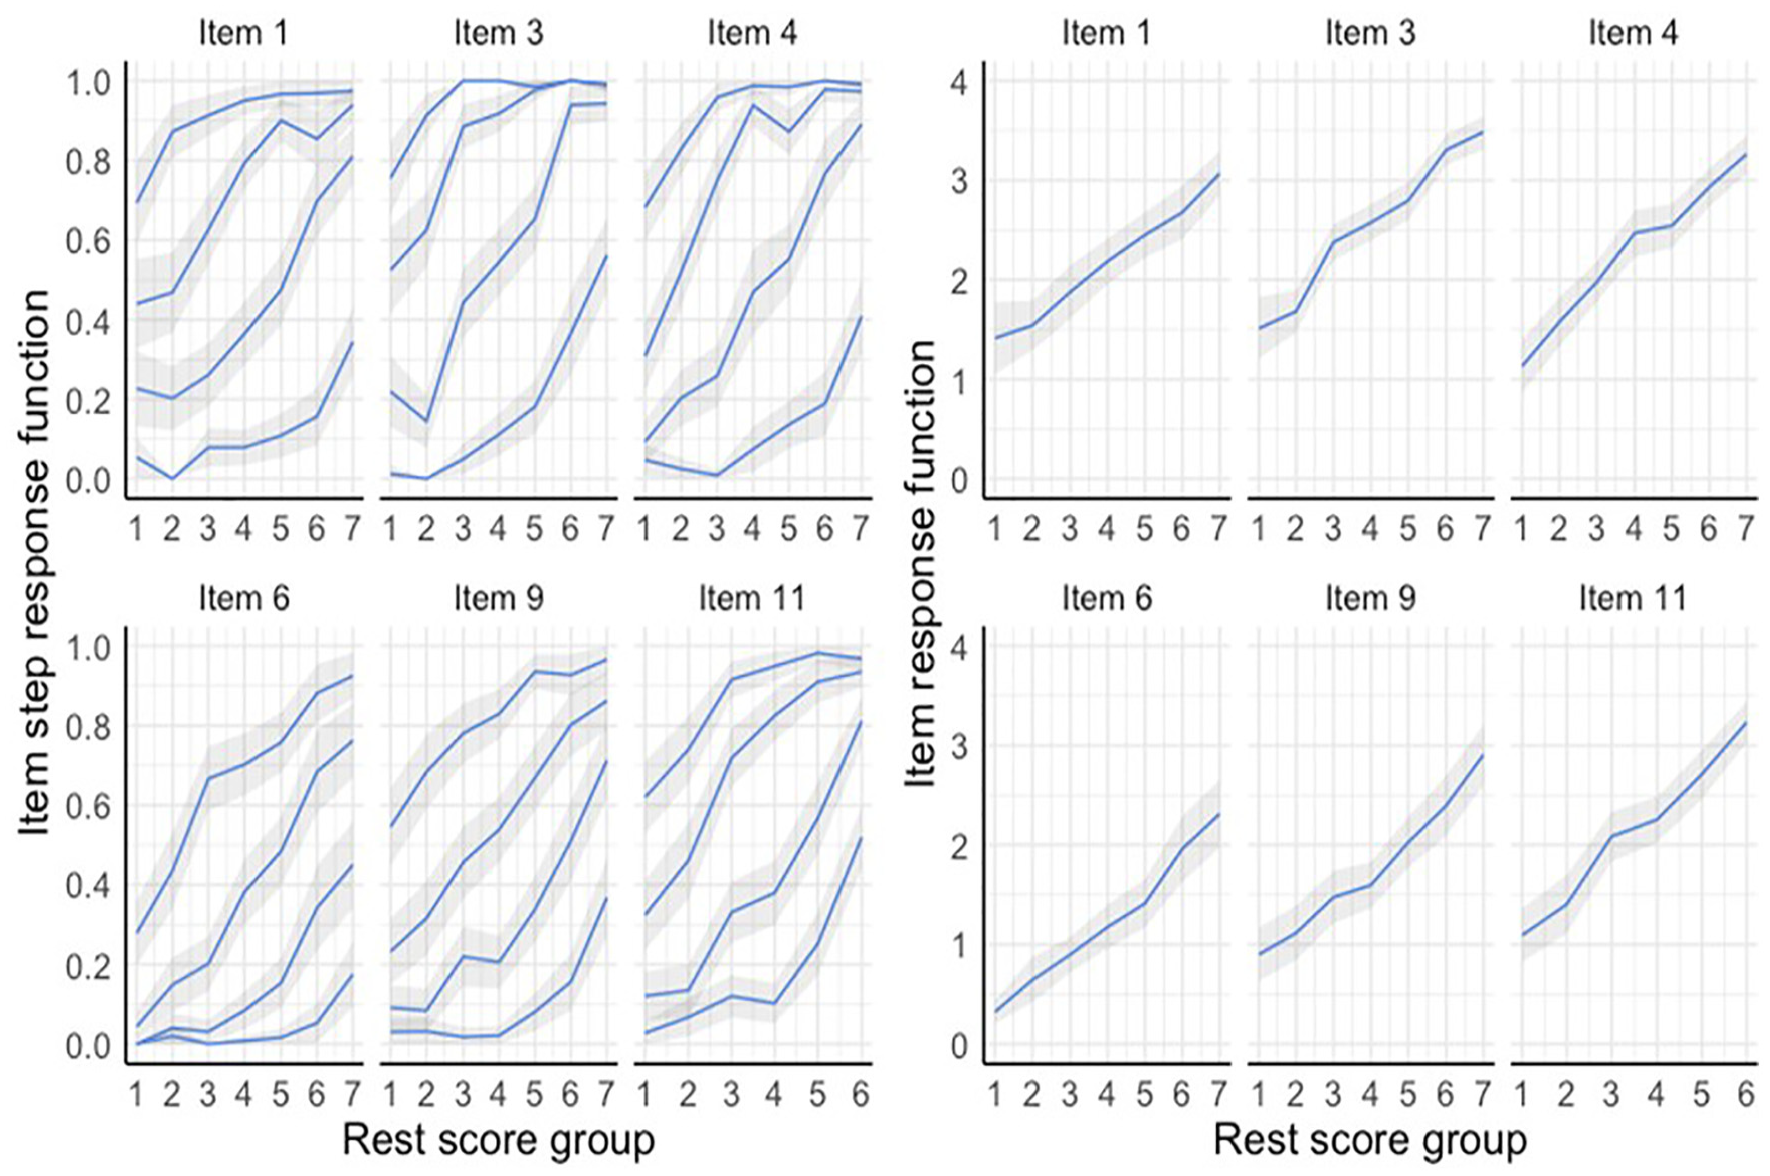
Monotonicity of ISRFs and mean IRFs for the items of the ego subscale.
Given that the assumptions of local independence, and monotonicity hold for the ego subscale of the TEOSQ, scalability coefficients were computed. Item pair scalability coefficients were in all cases positive and ranged from 0.33 (items 1 and 11) to 0.70 (items 3 and 4). Scalability coefficients for each ego subscale item are presented in Table 5. Item scalability, was higher than 0.3 for each item and ranged from 0.38 with a 95% confidence interval of 0.33 to 0.43 to 0.51 with a 95% confidence interval of 0.47 to 0.55, with item 1 (I’m the only one who can do the play or skill) having the lowest scalability and item 3 (I can do better than my friends) the highest. Thus the lower value of the confidence interval of item 1 was not below 0.3.
Scalability Coefficients of the Ego Subscale Items of the TEOSQ.
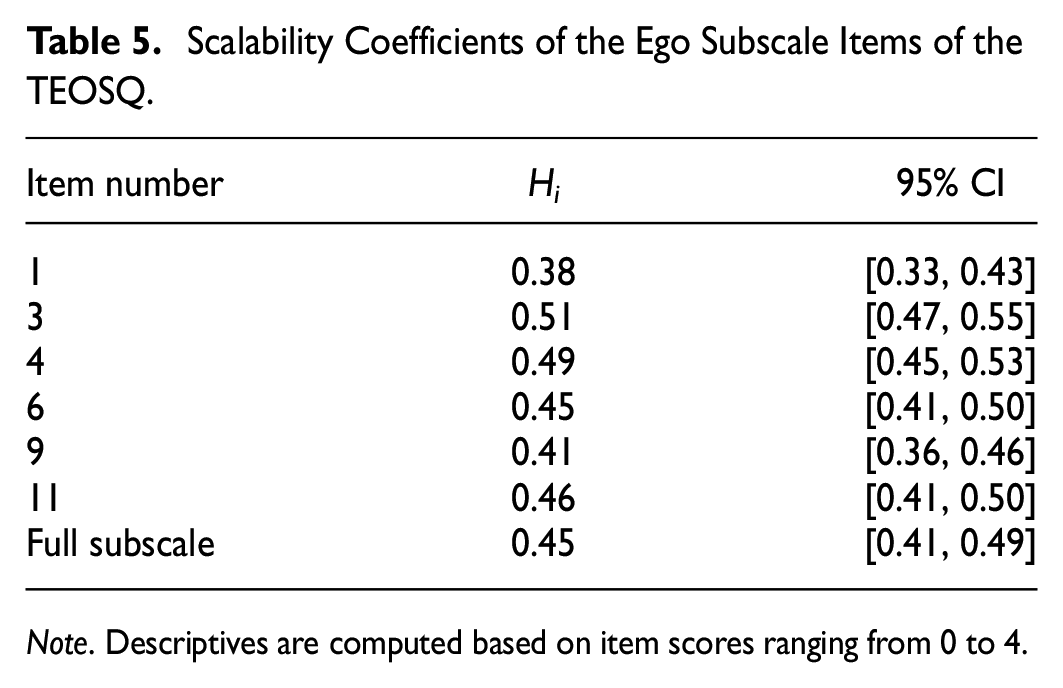
Note. Descriptives are computed based on item scores ranging from 0 to 4.
The overall scalability of the subscale was 0.45 with a 95% confidence interval of 0.41 to 0.49, indicating that the ego subscale of the TEOSQ is a medium scale (Mokken, 1971). These results indicate that ego subscale sum scores are moderately useful for ordering individuals by their ego orientation. Additionally, the item scalability coefficients suggest that the scales’ items might need revising, in particular items 1 and 9 (I score the most points/goals/hits).
As assumptions of local independence, and monotonicity held for the ego subscale, the items were examined for invariant item ordering. Method MIIO identified two statistically significant violations of invariant item ordering, involving items 1 (crit = 122), 4 (crit = 86), and 11 (crit = 73). Item 1 was involved in both violations, one with item 4, and the other with item 11. In the violation involving items 1 (I‘m the only one who can do the play or skill) and 4 (The others can‘t do as well as me), the size order of item means was reversed for the lowest rest score group, with rest scores ranging from 0 to 3.
The overall sample means of items 1 and 4 means were practically the same with item 4 having a slightly higher mean, see Table 2. In the 0 to 3 rest score group, the mean scores of items 1 and 4 were 1.47 and 1.03, respectively. In this group, item 1 had a significantly higher mean than item 4, t(170) = 2.33, p = 0.011, thus the size order was reversed. The other significant violation includes items 1 and 11.
Using the sample means to establish a size order, item 1 has the higher mean of the pair, see Table 2. Again, the item pairs’ sample means are virtually the same. For the highest-scoring rest score group, with rest scores ranging from 12 to 16, the mean of item 1 was 3.07, while the mean of item 11 was 3.36. In this group, item 11 had a significantly higher mean score than item 1, t(214) = 2.25, p = 0.013, so the size order was reversed. In addition, items 1 and 11 were involved in a second, non-significant violation of IIO.
The IIO assumption was assessed visually by plotting the items’ mean Item response functions, see Figure 4. Note that the split into rest score groups is different from the group splits for item pairs involved in the significant violations discussed previously. A single split had to be chosen for the plot, and the most common group split using the check.monotonicity function was used (see Meijer & Egberink, 2012). As a result, the line overlaps occur for different rest score groups on the graph than indicated by method MIIO. However, the plot indicates that items 1, 4, and 11 have adjacent and overlapping mean Item response functions, as suggested by the MIIO significant violations involving these item pairs. This implies that the ordering of these items is vague and unclear.

Mean item scores by rest score groups, that is, mean IRFs of the ego subscale items.
The other items of the ego subscale, items 3, 6, and 9 seem to have a fairly distinct item ordering. Items 6 and 9 are the most difficult across all rest score groups, while item 3 is the least difficult for all groups. Lastly, the HT coefficient of the ego subscale was 0.41, indicating that the item ordering has low accuracy. Thus, the assumption of invariant item ordering does not hold for the ego subscale.
Discussion
This study aimed to assess the legitimacy of using sum scores on the two subscales of the TEOSQ to order individuals by their levels of task and ego orientation. Results suggest that overall, both the task and ego subscales have medium scalability. Therefore, they are moderately good for ordering individuals by levels of goal orientations based on their subscale sum scores. This implies that the TEOSQ can be useful for research purposes, for example, determining correlates of task and ego orientations, and comparing task and ego orientation levels between different groups—which is how the scale has mainly been used to date.
Although results suggest the TEOSQ can be used for research, there is definite room for improvement in both subscales. Furthermore, the analysis indicates that for both subscales, the items are not invariantly ordered for groups with differing levels of task and ego orientation. The task subscale item ordering was too inaccurate to be of use and the ego subscale ordering had low accuracy. This indicates that respondents will not answer the items in the subscales in exactly the same order of hierarchy. Consequently, the sum scores of the two subscales do not provide information about which items respondents endorsed and therefore, cannot be used for individual classification. Thus, the TEOSQ should not be used for decision-making at an individual level, for example, team selection.
The lack of item invariant ordering may suggest that the difference in the conceptual extremity of the items in both subscales is small and that they cover a relatively narrow range on the latent variable. Moreover, it suggests that differential item functioning must be considered a threat to the validity of measurements obtained with the two subscales.
Improvement Suggestions
For the task subscale, item 5 (I learn something that is fun to do) and item 13 (I do my very best) had the lowest item scalability coefficients, indicating that these items are the weakest in the scale. The wording of item 5 is arguably a bit vague compared to other items on the subscale that include sport-related language like “skill,”“play,” and “practice.”
Additionally, responses to item 5 overlapped considerably with responses to items 2 and 10, indicating that perhaps item 5 does not add anything beyond items 2 (I learn a new skill and it makes me want to practice more) and 10 (Something I learn makes me want to go practice more). In fact, items 2 and 10 are essentially the same item, with the word “skill” in item 2 replaced by the word “something” in item 10. Results suggest that overall mean scores for these three items (2, 5, and 10) were almost the same and overlapped considerably between rest score groups, and could therefore probably be combined into only one item, without losing any valuable information on respondents’ task orientation.
Item 13 was the least difficult of all the items on the task subscale, with most respondents agreeing or strongly agreeing with it. Feeling successful when doing their very best seems like something most people, in general, would agree to, except for those who are incompetent in what they are doing. Thus, we would expect most people who are somewhat capable at their sport to be more likely to succeed, and therefore feel more successful, when doing their best.
It raises the question of whether item 13 is indeed assessing task orientation or some other construct like skill level, competence, or perhaps even confidence or self-efficacy. In any case, it is worth considering whether an item that almost all respondents agree to adds anything of value to the task orientation assessment. Item 13 would benefit from a rephrasing that makes it more difficult to endorse. It was probably intended to assess respondents’ feelings of success when they do their best regardless of the outcome, that is, even though they don’t win or do well compared to others. This would be in line with the definition of task-orientated athletes—their goal is personal improvement, regardless of how they perform compared to others. The task subscale might therefore benefit from this sentiment being added to item 13, for example, I do my best, regardless of the outcome. This would make the item more difficult to endorse and is more in line with theoretical definitions.
In addition to identifying possibly problematic items, the analysis revealed that, in general, respondents had extremely high sum scores on the task subscale, suggesting a possible ceiling effect. This means that the scale can be used to differentiate those who have very low levels of task orientation from others, but it might not be suitable to distinguish between those with moderate and high task orientation. Thus, the task orientation subscale would benefit from the addition of more difficult items or a modification of most of its current items to increase their difficulty.
Respondents’ consistently high scores on the task subscale could mean that task orientation is an attribute that most athletes possess an abundance of. But maybe (and more likely) a combination of other factors explain these high scores—for example, a low overall difficulty level of items in the scale and perhaps even social desirability.
For the ego subscale items 1 and 9 were the weakest items, with the lowest item scalability coefficients. The wording of item 1 (I am the only one who can do the play or skill) refers to a very specific situation, that is, it asks respondents to contemplate how they feel when no one else can do something that they can do. Of all the situations mentioned in the items of the ego subscale, this is arguably the most extreme. It’s very plausible that not all respondents have found themselves in this situation—where they are the only ones that know a specific skill. Therefore, some respondents might be basing their answers on how they think they might feel in this situation, while other respondents base their answers on experience. Thus, this item can be improved by referencing a less extreme situation that most respondents can relate to, for example, being better than others at a particular skill. In addition, the wording of item 1 might be somewhat unclear. The item seems to be referencing a particular play or skill because of the use of the definite article “the.”
Some other items on the TEOSQ reference a skill but item 1 is the only one where the definite article is used. This might be confusing to some respondents. Lastly, although it’s not a problem in the Icelandic version, it is worth noting that no other item references a “play” in the English version. All other items conveying a similar notion to item 1 only refer to a “skill.” Thus, item 1 could be simplified to only use the word “skill” to maintain consistency among the TEOSQ items.
The other potentially problematic item of the ego subscale is item 9 (I score the most points/goals/hits). This is an item that has been reworded in studies to apply to different sporting settings (e.g., Duda, 1989; Duda & White, 1992; Van-Yperen & Duda, 1999). In the Icelandic version used in the current study, this item only mentions goals and points, not hits.
Listing different types of sporting achievements depending on who is responding might be needed for this item to be suitable for athletes in various sports. However, listing all possible types of sporting achievements is impractical. Wording the item differently in different studies reduces the comparability and generalisability of research results, as it leads to different versions of the scale being tested. Furthermore, including different concepts applying to different sports in one item makes it potentially confusing. Therefore, item 9 might benefit from rephrasing to make it applicable to various sporting settings, without referencing a particular result like goals or time.
Limitation and Future Research
To our knowledge, the current study is the first to use MSA on the TEOSQ to assess the legitimacy of using its subscales’ sum scores for ordering individuals based on their goal orientations. The current study’s biggest limitation is the lack of diversity in the sample. A big majority of respondents were male, and all respondents were 16-year-old football players. Thus, further MSA studies would be beneficial, preferably on more diverse samples. In addition, further research into possible improvements of the TEOSQ items is needed. Qualitative methods like cognitive interviews could be useful for identifying more possible sources of respondents’ confusion or misunderstanding.
Rephrasing the items identified in the current study, administering a revised TEOSQ, and examining the difference in the psychometric properties of its two subscales could also be informative. Although only the items with the lowest scalability coefficients were discussed in detail here, the other items of both subscales should be examined more closely for possible improvements and revisions. In particular, the task subscale would benefit from more item diversity in terms of difficulty, to more accurately distinguish between those who have moderate to high levels of task orientation. It is, however, important to keep in mind that the whole population of affiliate registered football players were invited to participate.
Conclusions
The TEOSQ can be used to order individuals by their levels of task and ego orientations and is suitable for continued use in research. However, there is room for improvement and the scale would benefit from a rewording of some of its items. For instance, the task subscale item 5 and item 13 only had an item scalability coefficient of 0.4 and item 1 in the ego subscale only had a scalability coefficient of 0.38. If rewording of these items leads to higher scaling coefficients, errors in ordering respondents on the bases of their sum scores will be reduced. Furthermore, adding new, more difficult items to the task subscale could improve its ability to distinguish between those with higher levels of task orientation.
Footnotes
Declaration of Conflicting Interests
The author(s) declared no potential conflicts of interest with respect to the research, authorship, and/or publication of this article.
Funding
The author(s) disclosed receipt of the following financial support for the research, authorship, and/or publication of this article: The research was funded by the Icelandic Football Association.