
Abstract
Poor social and economic circumstances affect the health of individuals throughout the life cycle. The purpose of the study was to examine whether state-level and individual-level socioeconomic factors are associated with mentally or physically unhealthy days in the general U.S. population of adults. The Behavioral Risk Factor Surveillance System and the American Community Survey in 2016 were used to examine state-level social determinants of health and the number of self-reported mentally unhealthy days in the last 30 days using Zero-Inflated Negative Binomial (ZINB) regression models. Men, older individuals, minorities, persons with higher educational attainment levels, persons who were employed, persons who were married, or with a partner, and persons with one or zero chronic condition were more likely to report excessive zeros for responses to the mentally, and physically unhealthy days. The negative binomial regression results indicated that higher state-level poverty rates, higher income inequity, lower median income, and higher unemployment rates were related to the higher number of reported mentally, and physically unhealthy days. Persons with higher educational attainment, and who were employed reported lower mentally, and physically unhealthy days. The findings show significant relationships between socioeconomic contexts and general health status. Health planners and policymakers may use the results to allocate resources and guide public policies and programs.
Keywords
Introduction
The World Health Organization (WHO) defines health as a state of complete physical, mental, and social well-being and not merely the absence of disease, or infirmity. Mental disorders are associated with an increased risk of various chronic physical conditions (Scott et al., 2016). On the other hand, chronic physical health issues can also hurt mental health (Lando et al., 2006). Integrating mental and physical health represents a more holistic approach to disease prevention and health promotion. Recent global and national data indicate high physical and mental health burdens. Globally, only 4.3% of the adult population had no responsibility for disease or injury sequelae in 2013 (Vos et al., 2015). Approximately 10.7% of individuals live with a mental disorder worldwide (Institute for Health Metrics and Evaluation [IHME], 2018). Identifying risk factors associated with mental and physical health is essential to provide corresponding support to decrease the detrimental effects, such as hampered work and housing opportunities (Corrigan et al., 2000).
Relationship between the socioeconomic status (SES) and health status had a long history. Extensive epidemiological research has shown that socioeconomic status (SES) is a critical social determinant of public health (Callan et al., 2015). SES can be assessed at both the micro (individual) and macro (e.g., state or community) levels. Most previous studies focused on the micro-level SES. Individuals from higher SES backgrounds tend to report better health outcomes than those from lower SES backgrounds (Harper & Lynch, 2007). Such associations have been well established in across a wide range of studies across different settings (Callan et al., 2015; Matthews & Gallo, 2011; Meyer et al., 2014; Wang & Geng, 2019). For instance, lower educational and income levels are associated with poorer physical and mental health status (Dube et al., 2019; Regidor et al., 1999). Next, employment status was associated with physical and mental health. Specially, unemployment and job were associated poorer physical and mental health, while employment and reemployment were associated better physical, and mental health (Hergenrather et al., 2015a, 2015b). In general, persons who are less educated, have lower employment status, and lower income levels are at a greater risk for poorer physical and/mental health than other SES counterparts (Matthews & Gallo, 2011).
Meanwhile, macro-level influences should be considered as research has shown that individuals living in socio-economically deprived areas had poor mental and physical health conditions than their counterparts regardless of their own socioeconomic status (Basta et al., 2008). When researchers consider macro-level SES, micro-level SES should be controlled as each person’s health status is the outcome of interests. Studies have investigated how micro and macro-level SES factors impact physical and mental health simultaneously. For instance, high median income and high unemployment rate at the county level were directly linked with poor physical health and mental health (Barile et al., 2015) by controlling individual covariates. On the contrary, higher neighborhood income was associated with better physical and mental health (Robinette et al., 2017) in another study. In the community level, community-level SES (e.g., household income, unemployment rate, public service percentage) was related a person’s self-rated health as well (Robert, 1998). For instance, higher employment rate was associated with poor health.
In addition to these macro-levels, researchers could investigate how various state-level socioeconomic indicators associate with physical/mental health. For instance, states with a lower median income and higher poverty rate had poor physical health status (e.g., hypertension) than their counterparts in more advantageous SES groups (Fan et al., 2015). State level income equity and poor health outcomes (e.g., COVID-19 mortality and maternal health) was positively related (Kahn et al., 2000; Oronce et al., 2020). One study considered how four state-level socioeconomic factors (employment rate, median income, poverty rate, and Gini index) were associated with mental health status (i.e., depression) respectively. Results indicated that lower SES status (e.g., higher unemployment rate) were associated with poor mental health (Fan et al., 2011). These studies focused on a specific aspect of health, while few researchers have examined how state-level socioeconomic factors relate to overall physical and mental health status by controlling individual-level factors.
Subjective health as measured by Health-Related Quality of Life (HRQoL, https://www.cdc.gov/hrqol/measurement.htm) has been widely adopted in population health surveillance with decent validity and reliability evidence (https://www.cdc.gov/hrqol/measurement.htm). Among the health days core module, participants were asked to estimate the mentally, and physically unhealthy days in the past month. The number of unhealthy days have been often dichotomized to create the measure of frequent physical distress and frequent mental distress, respectively based on a cut-off point of 14, or more days in the last 30, indicating a substantial level of impairment (Liu et al., 2018). Numbers of mentally or physically unhealthy days may be an ideal indicator for sub-optimal health, as count variables tend to measure significant variation in subjective health complaints compared to summarizing the count variable into a dichotomous outcome based on subjective criteria. Studies investigated the association of state-level socioeconomic factors with mentally and physically unhealthy days (Jia et al., 2004). The results indicated that the largest mean physically or mentally unhealthy days were associated with the lowest state household income. However, individual variations were not considered in modeling. Other similar studies have been conducted at other macro level (e.g., county level) with similar conclusions (Barile et al., 2015). Overall, few studies have investigated how state-level socioeconomic factors relate to physically and mentally unhealthy days by controlling individual-level factors.
In addition, large number of zeros in mentally or physically unhealthy days reported by participants may be associated with certain factors, but such associations remain unclear in the literature partially due to lack of appropriate statistical analysis. The large number of zeros in self-reported mentally and physically unhealthy days should be examined. Zero-inflated negative binomial regression modeling can analyze the excessive zeros and number of unhealthy days simultaneously. Therefore, the purpose of the current study was to examine whether state-level socioeconomic factors were associated with mentally unhealthy days (MUD) or physically unhealthy days (PUD) by controlling the individual-level factors in the general U.S. population of adults, utilizing zero-inflated negative binomial regression.
Methods
Data Sources
The Behavioral Risk Factor Surveillance System (BRFSS) is a state-based telephone survey of non-institutionalized civilian adult residents from each of the 50 states and the District of Columbia. (https://www.cdc.gov/brfss/index.html). Each year, three components are included in the BRFSS survey: core questionnaire, optional models, and state-added questions. The BRFSS data is exempt from Institutional Review Board review by the Human Research Protection Office, Centers for Disease Control and Prevention. All information, including technical information, questionnaire, and data resources, is available at https://www.cdc.gov/brfss/data_documentation/index.htm. The current analysis was conducted using BRFSS data collected in 2016 from 50 states and the District of Columbia (n = 477,665) using the core BRFSS questionnaire. The response rate of BRFSS was 47.7% (landline) and 46.4% (cell-phone; CDC, 2017).
The American Community Survey (ACS) is an annual nationwide survey to collect social, economic, and housing statistics information. Over 3 million housing unit addresses are sampled each year. The response rate was 94.7% in 2016 (https://www.census.gov/acs/www/methodology/sample-size-and-data-quality/response-rates/). State-level data is available online.
Measures
The 2016 socioeconomic data in ACS were aggregated to create the following state-level variables: proportion of population below the national poverty level in the past 12 months; employment to population ratio; median household income; and Gini index/coefficient (Witlox, 2016). A Gini index of zero means perfect equality with all the same values, and a value of 1 means maximized inequity among incomes. It is a widely used indicator of state-level income inequity. Quintiles of these indicators (20% of the whole) were created by splitting respondents into five groups of equal size in the modeling process to ease interpretation.
Data Analysis
Count data are usually examined by Poisson models, which assume that the conditional variance of the outcome variable is equal to the conditional mean. However, in most applied cases, the conditional variance is not equal to the conditional mean. Commonly, the conditional variance is more significant or much greater than the conditional mean, defined as overdispersion. In addition, excessive zeros may be present in a dataset. For instance, a large proportion of individuals in a general population may report zero MUD or PUD. Two types of models can be used to handle overdispersion and excessive zeros properly.
First, the zero-inflated Poisson (ZIP) model assumes that the sample follows a mixture of two distributions: A Poisson distribution (or Poisson state) to model the count data (number of 0, 1, 2, 3, …) and a logit distribution to model the number of excessive zeros (Heilbron, 1994; Lambert, 1992). The alternative model is called the zero-inflated negative binomial (ZINB) model. Similar to the ZIP, the ZINB model has two processes to classify outcome variables based on the nature of zeros (Hilbe, 2014). The model contains a mixture of the negative binomial and logit distributions. The negative binomial regression can be considered as an extension of Poisson regression. A ZINB model possesses more flexibility to model the conditional mean and conditional variance by introducing an unobserved heterogeneity term (Erdman et al., 2008). Parameters of both ZIP and ZINB models can be estimated by Maximum Likelihood Estimator (MLE) via the Expectation-Maximization (EM) algorithm.
STATA 15.0 (College Station, TX) was used for data analysis (StataCorp, 2017). The final weight of variables and the clustering nature of the data (i.e., individuals are nested within a state) were considered to obtain adjusted standard errors in models regressing MUD or PUD on state-level socioeconomic factors. Two dependent variables, MUD and PUD, were examined separately. The results were then organized side-by-side to facilitate comparison (eight models in total) by controlling the individual covariates. The prevalence ratios were utilized to compare each factor’s strength of association in different socioeconomic levels. The highest quintile indicates the highest poverty rates, unemployment, income inequity (i.e., Gini), and median household income. A likelihood-ratio test of the ZIP versus the ZINB model was used to select the optimal model. A significant likelihood ratio test (p < .001) indicated that the ZINB model was preferred to the ZIP model. Based on the final models, the marginal means were estimated to predict the number of MUD or PUD on average.
Results
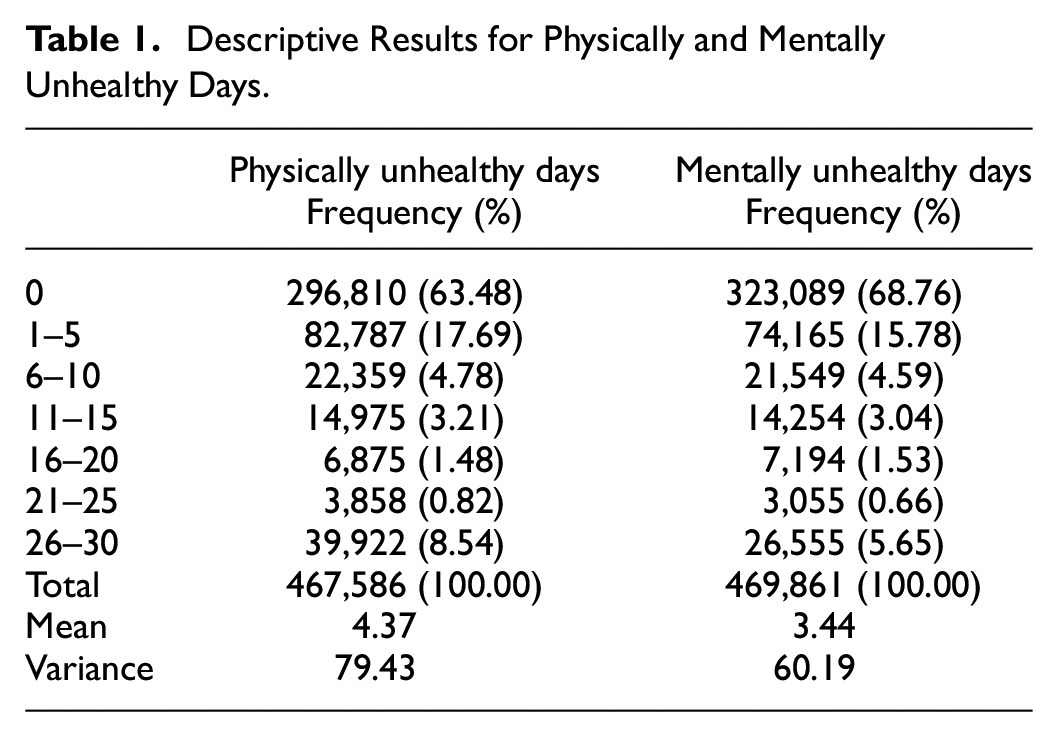
On average, U.S. adults had approximately 3.44 MUD and 4.37 PUD in the past 30 days. The variances of both MUD (60.19) and PUD (79.39) were quite large relative to the means, indicating over-dispersion. In addition, a large number of zeros were identified in both MUD and PUD (see Table 1). Both ZIP and ZINB models were examined accordingly.
Descriptive Results for Physically and Mentally Unhealthy Days.
The demographic characteristics are shown in Table 2. There were similar proportions of individuals in each age group, sex, and state-level socioeconomic factors. The majority were white (69.7%), with a degree higher than high school (59.0%), and married (55.9%). The correlations among state-level socioeconomic variables mainly were medium to high. When fitting the ZINB and ZIP models, the highly correlated state-level variables (See Supplement Material S1) may undermine the statistical significance of independent variables. This study examined state-level variables one by one after controlling for the individual-level covariates to overcome the problem.
Descriptive Characteristics for Health-Related Quality of Life, Individual-Level, and State-Level Socioeconomic Status. BRFSS 2016—Proportion (95% Confidence Interval) Considering Sampling Weights (N = 477,665).
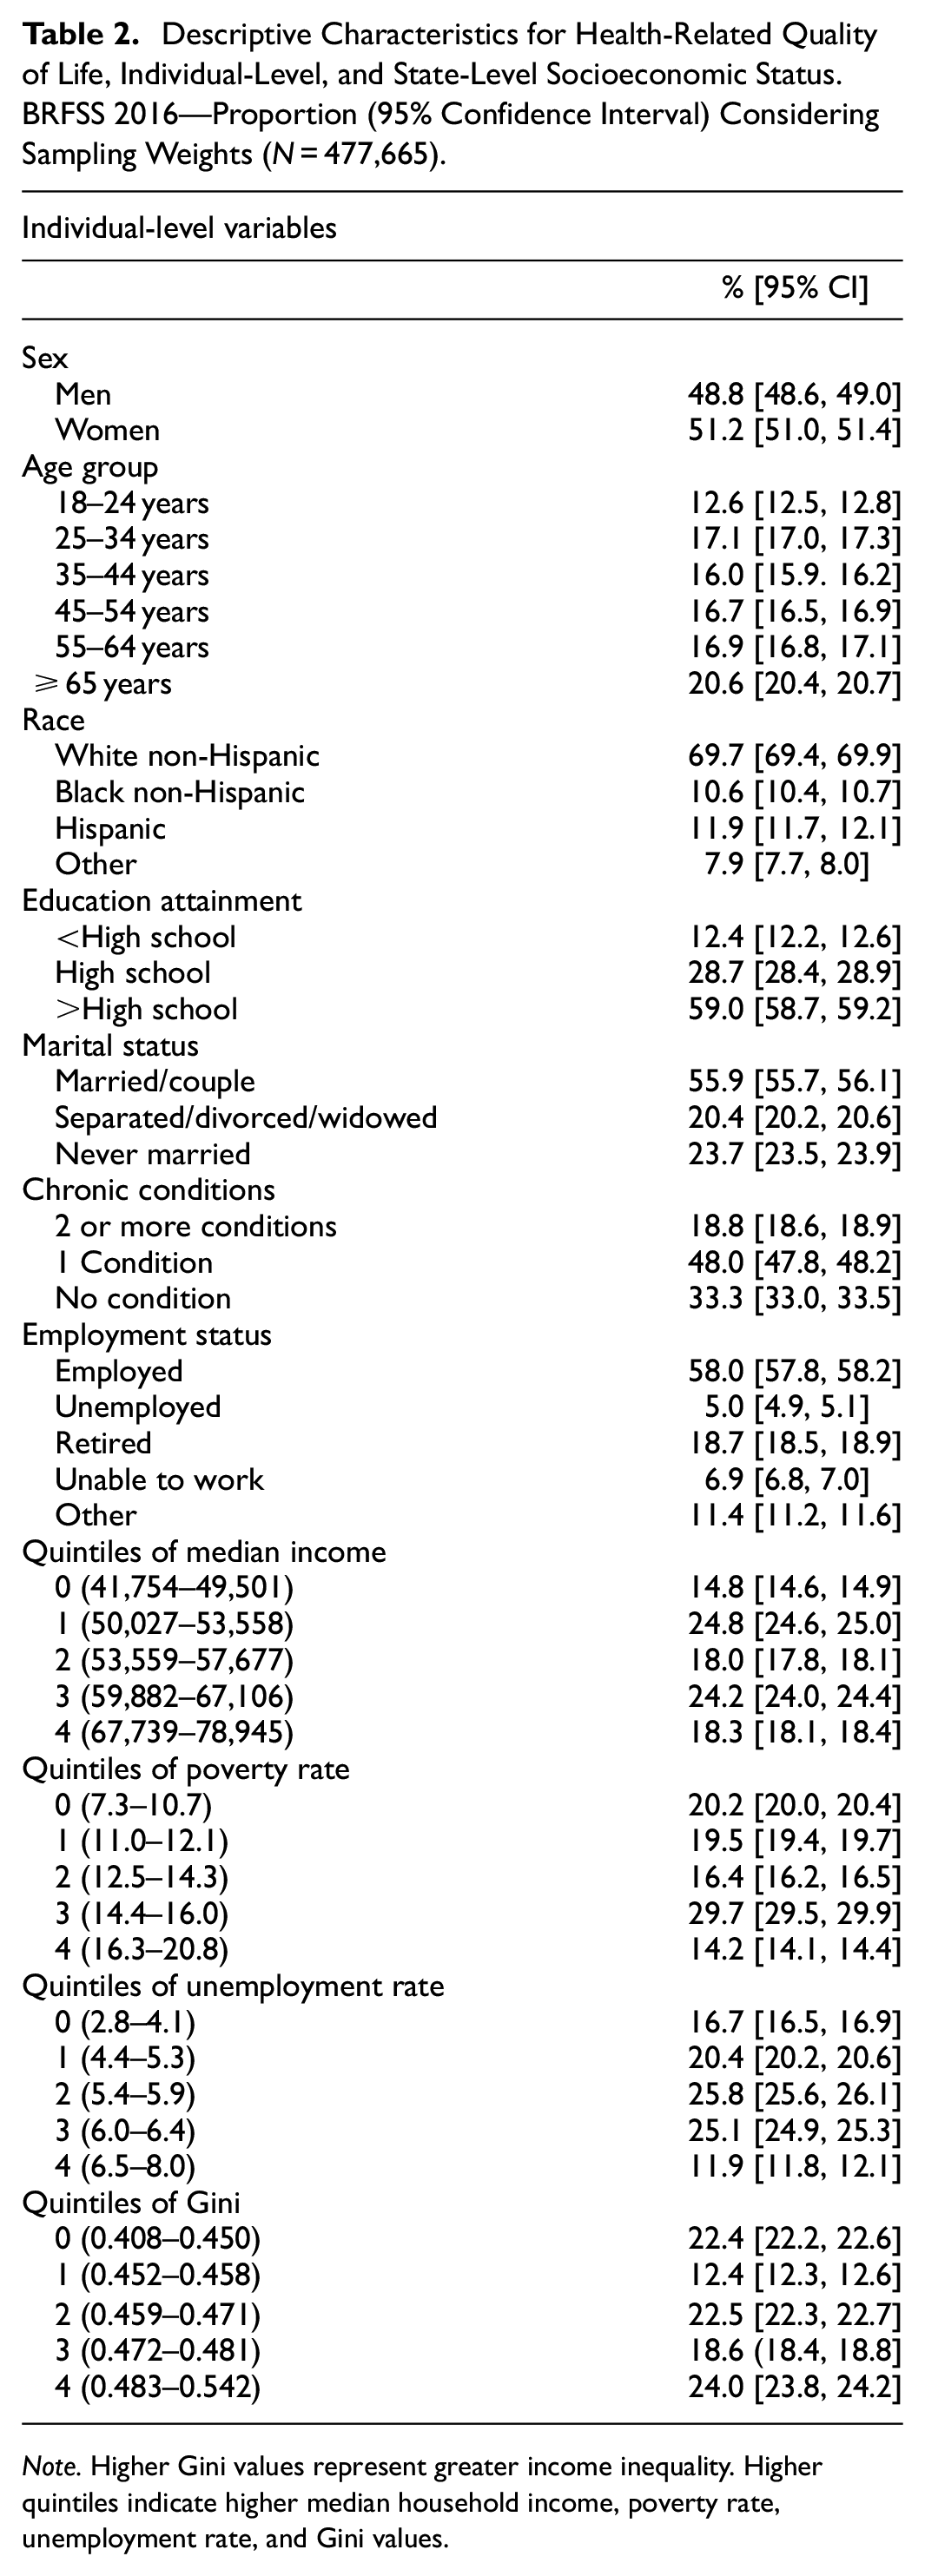
Note. Higher Gini values represent greater income inequality. Higher quintiles indicate higher median household income, poverty rate, unemployment rate, and Gini values.
Eight models were built to estimate the associations between the four state-level quintile variables and adults’ MUD and PUD. The likelihood ratio tests for comparing ZIP and ZINB models were significantly different from zero (p < .001) for all models. The results suggested that ZINB fitted the data better than ZIP, therefore, results from ZINB are reported to explain the relationships.
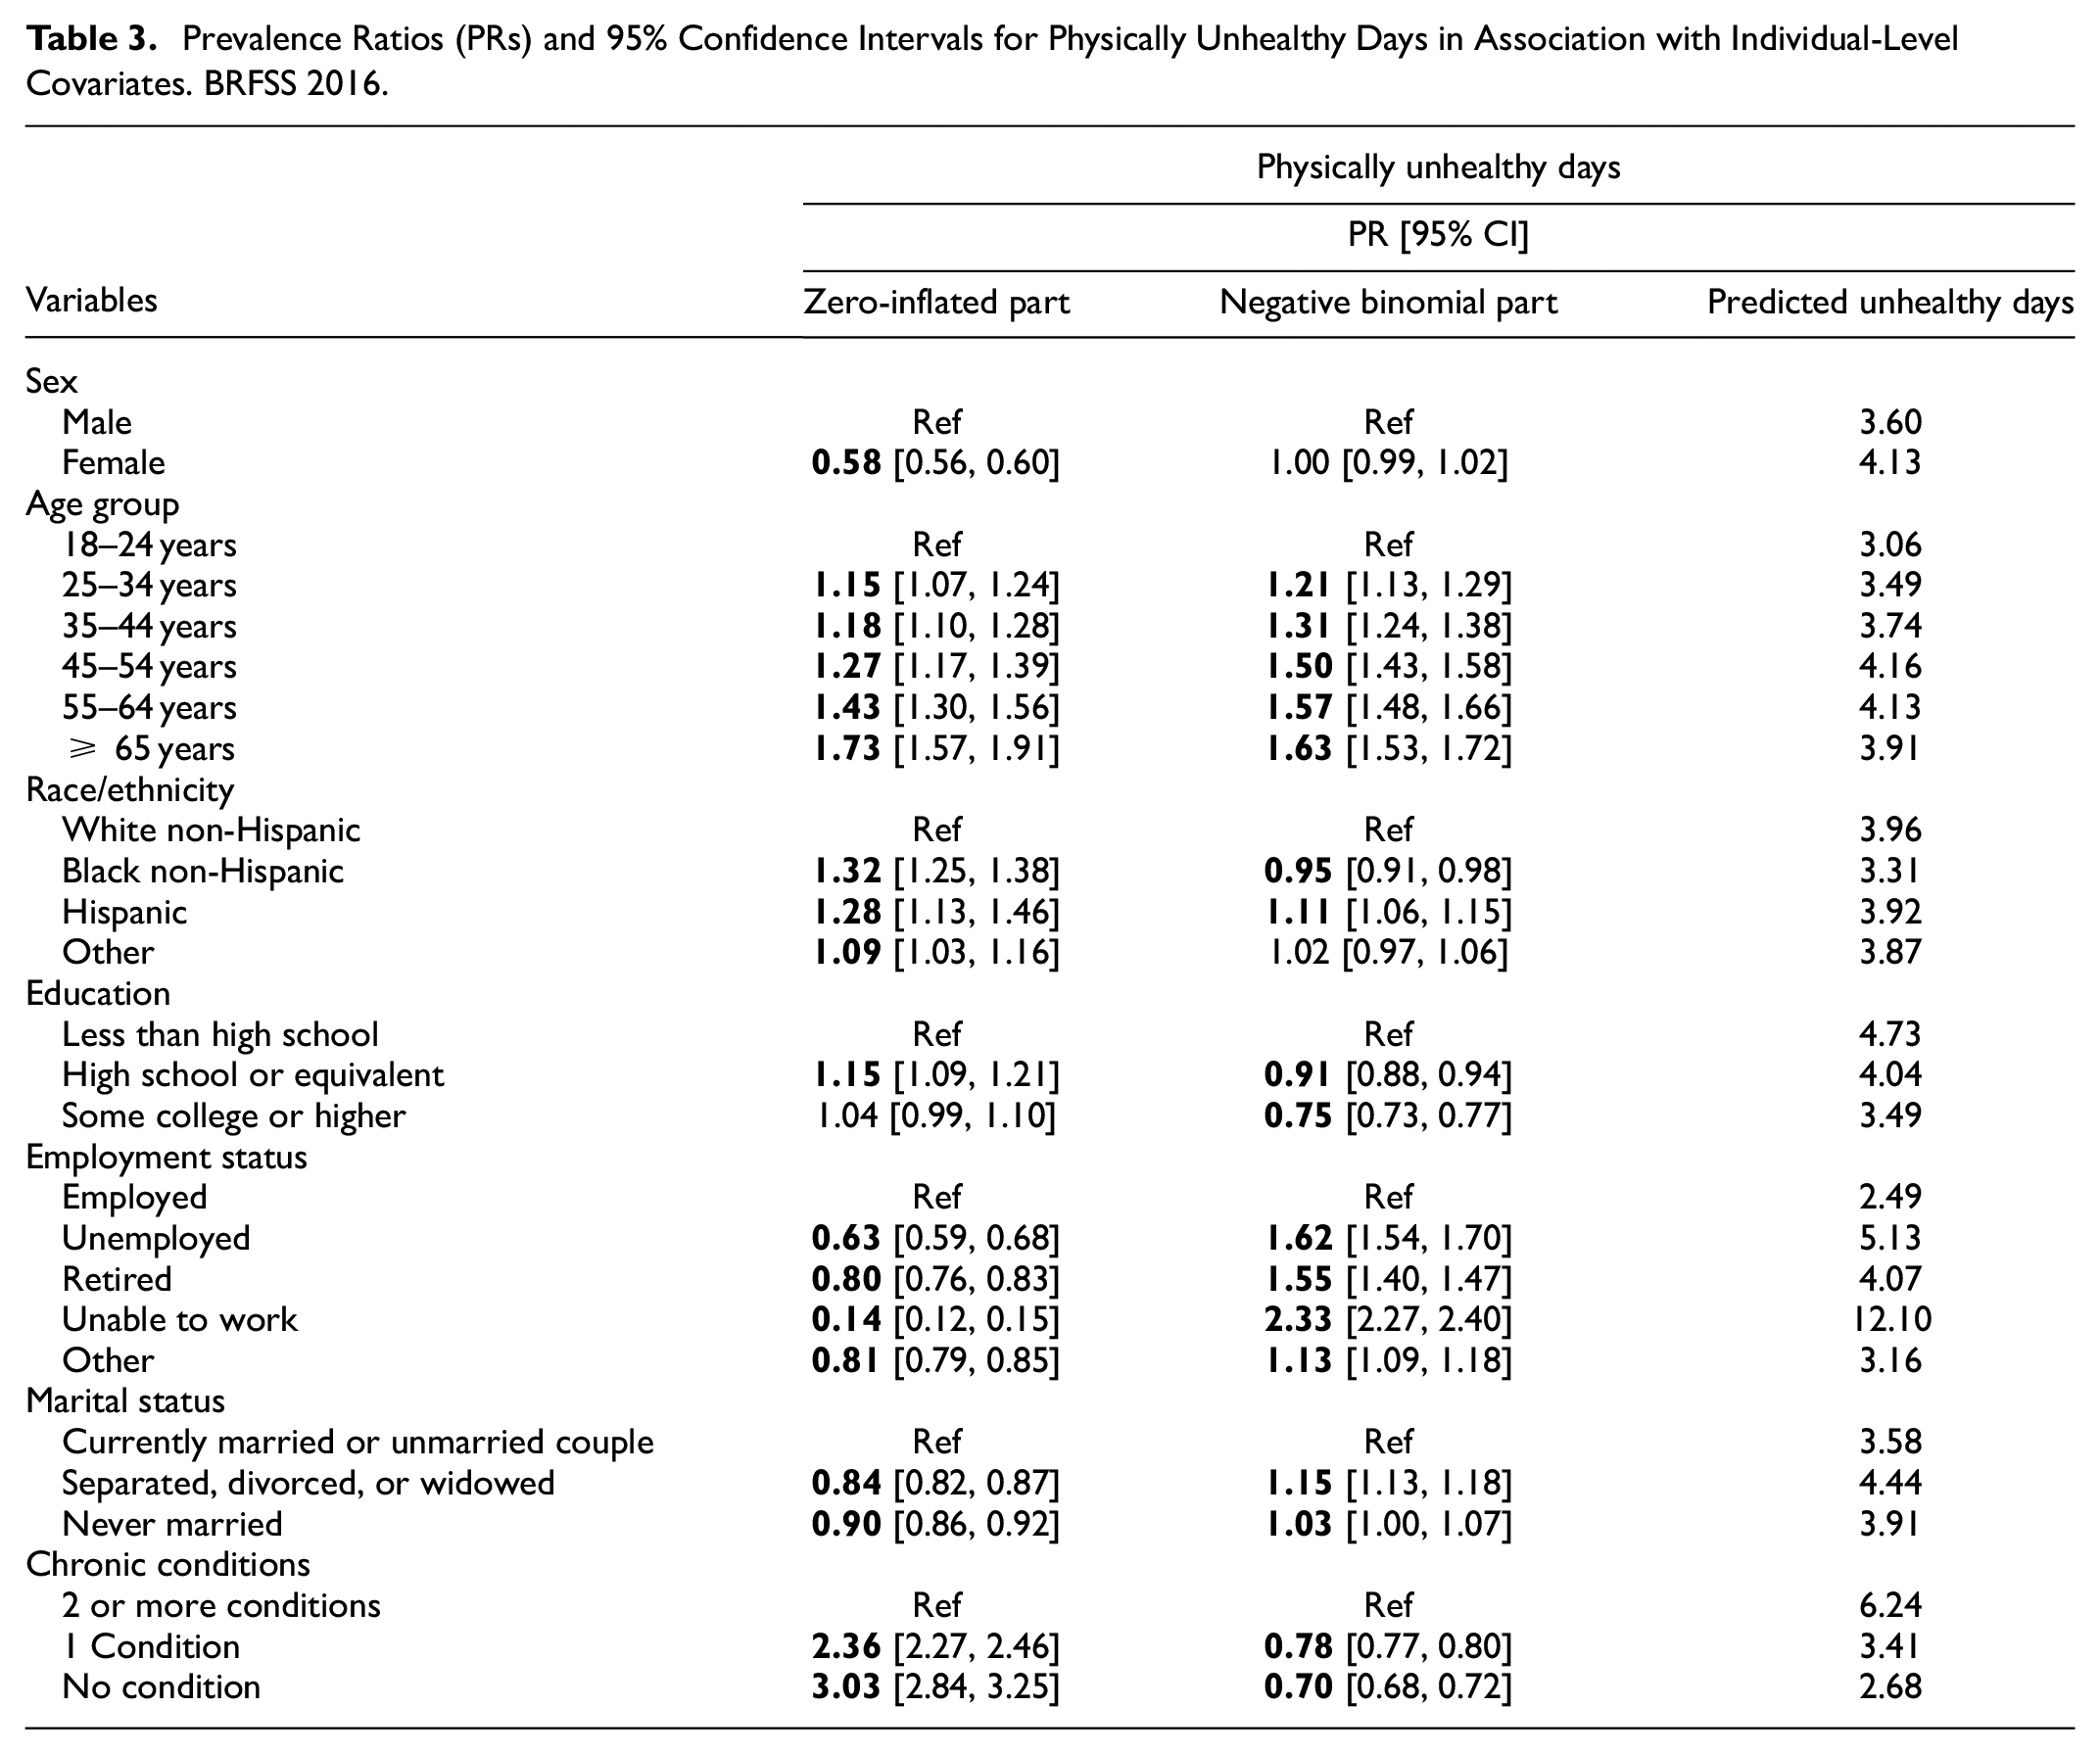
The effects of individual-level covariates for MUD or PUD are presented in Tables 3 and 4. In each table, the first column shows the results of predicting membership of extra zeros using the logit scale for MUD or PUD. The second column present the results of modeling numbers of MUD or PUD not in the specific zero groups using the log scale. The third column includes predicted mentally or physically unhealthy days.
Prevalence Ratios (PRs) and 95% Confidence Intervals for Physically Unhealthy Days in Association with Individual-Level Covariates. BRFSS 2016.
Prevalence Ratios (PRs) and 95% Confidence Intervals for Mentally Unhealthy Days in Association With Individual-Level Covariates. BRFSS 2016.
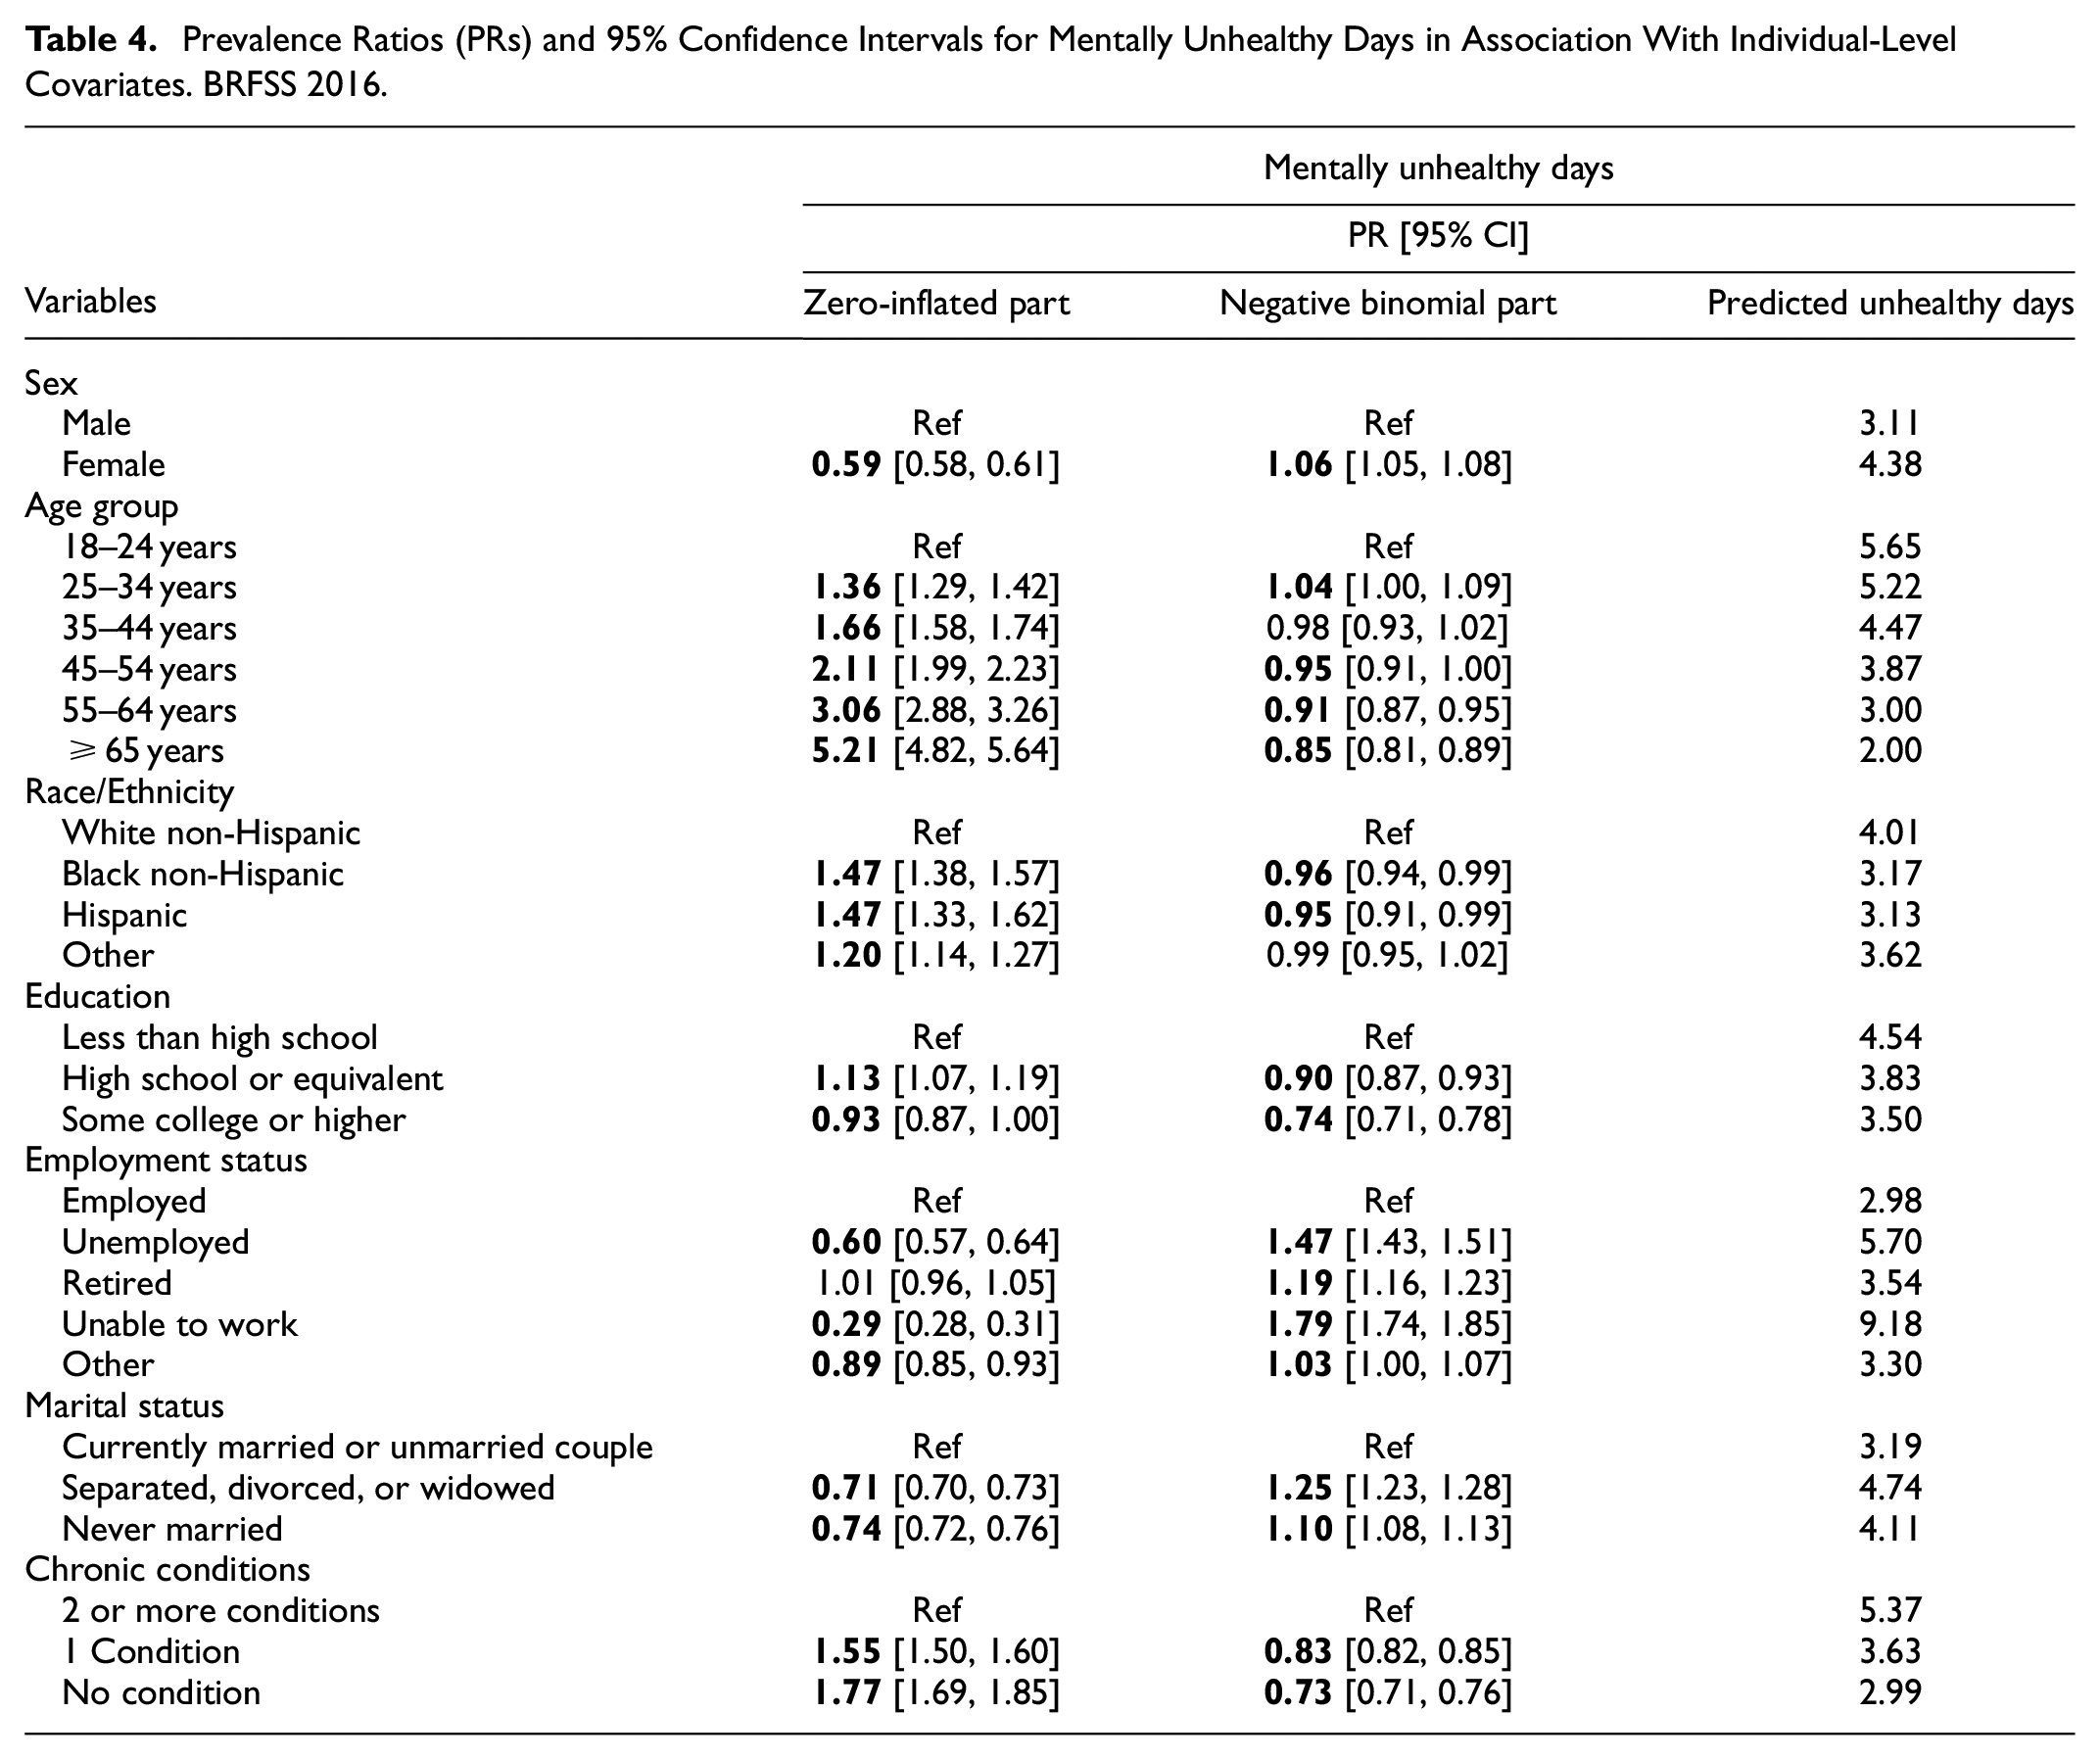
In the zero-inflated models, these groups were more likely to report excessive zeros compared to their counterparts: men, older individuals, minorities, persons with higher educational attainment levels, persons who were employed, persons who were married, or with a partner and persons with one or zero chronic condition. The response patterns were similar with different degrees of relationships for PUD and MUD.
The associations between individual predictors and the number of mentally or physically unhealthy days had different patterns, as shown in the negative binomial regression models. For instance, females had more MUD than males, while there was no different variation for PUD. Age was positively PUD, while older individuals seemed to have lower MUD. Persons with higher educational attainment, who were employed, married (vs. Separated, divorced, or widowed), and with one or zero chronic condition reported lower MUD and PUD. The predicted outcomes showed that individuals who were unable to work had highest MUD and PUD.
The results of ZINB regression models for the main effects of state-level predictors with adjustment of individual covariates are shown in Table 5. It was noted that the zero-inflated part was not considered for state level predictors as this was more of a concern for individual-level responses. In the negative binomial models, the state-level socioeconomic factors for the following groups had significantly higher numbers of adults’ MUD or PUD relative to the reference group: states with poverty rate ≥16.3%, unemployment rate ≥6.0%, and 0.459 ≥ Gini ≥0.471. States with median household income higher than $53,559 were associated with lower MUD or PUD than the reference group. For example, the count of MUD for the adults who resided in states between 16.3% and 20.8% below the national poverty line was 1.07 or 1.10 times the count of PUD or MUD for the adults who resided in states with poverty rates between 7.3% and 10.7%. Adults residing in states with a median household income between $67,739 and $78,945 were expected to have 0.94 or 0.91 times of the counts of PUD or MUD compared to those residing in states with a median household income between $41,754 and $49,501 (the reference group). Overall, the association patterns for MUD and PUD were similar across many state-level socioeconomic predictors. However, there were differences in certain comparisons. Unemployment rates between 4.4% and 5.3% (vs. 2.8% and 4.1%) were significantly related to higher PUD but not MUD. Gini between 0.472 and 0.481 and the reference group were significant related to higher MUD but not PUD. The predicted MUD and PUD are shown in Table 5. Higher median household income, lower poverty rate, lower unemployment rate, and lower-income inequity (Gini) were associated with a lower count of MUD and PUD.
Prevalence Ratio (PR) and 95% Confidence Interval for Mentally and Physically Unhealthy Days in Association with State-Level Socioeconomic Indicators and Predicted Outcomes. BRFSS 2016.
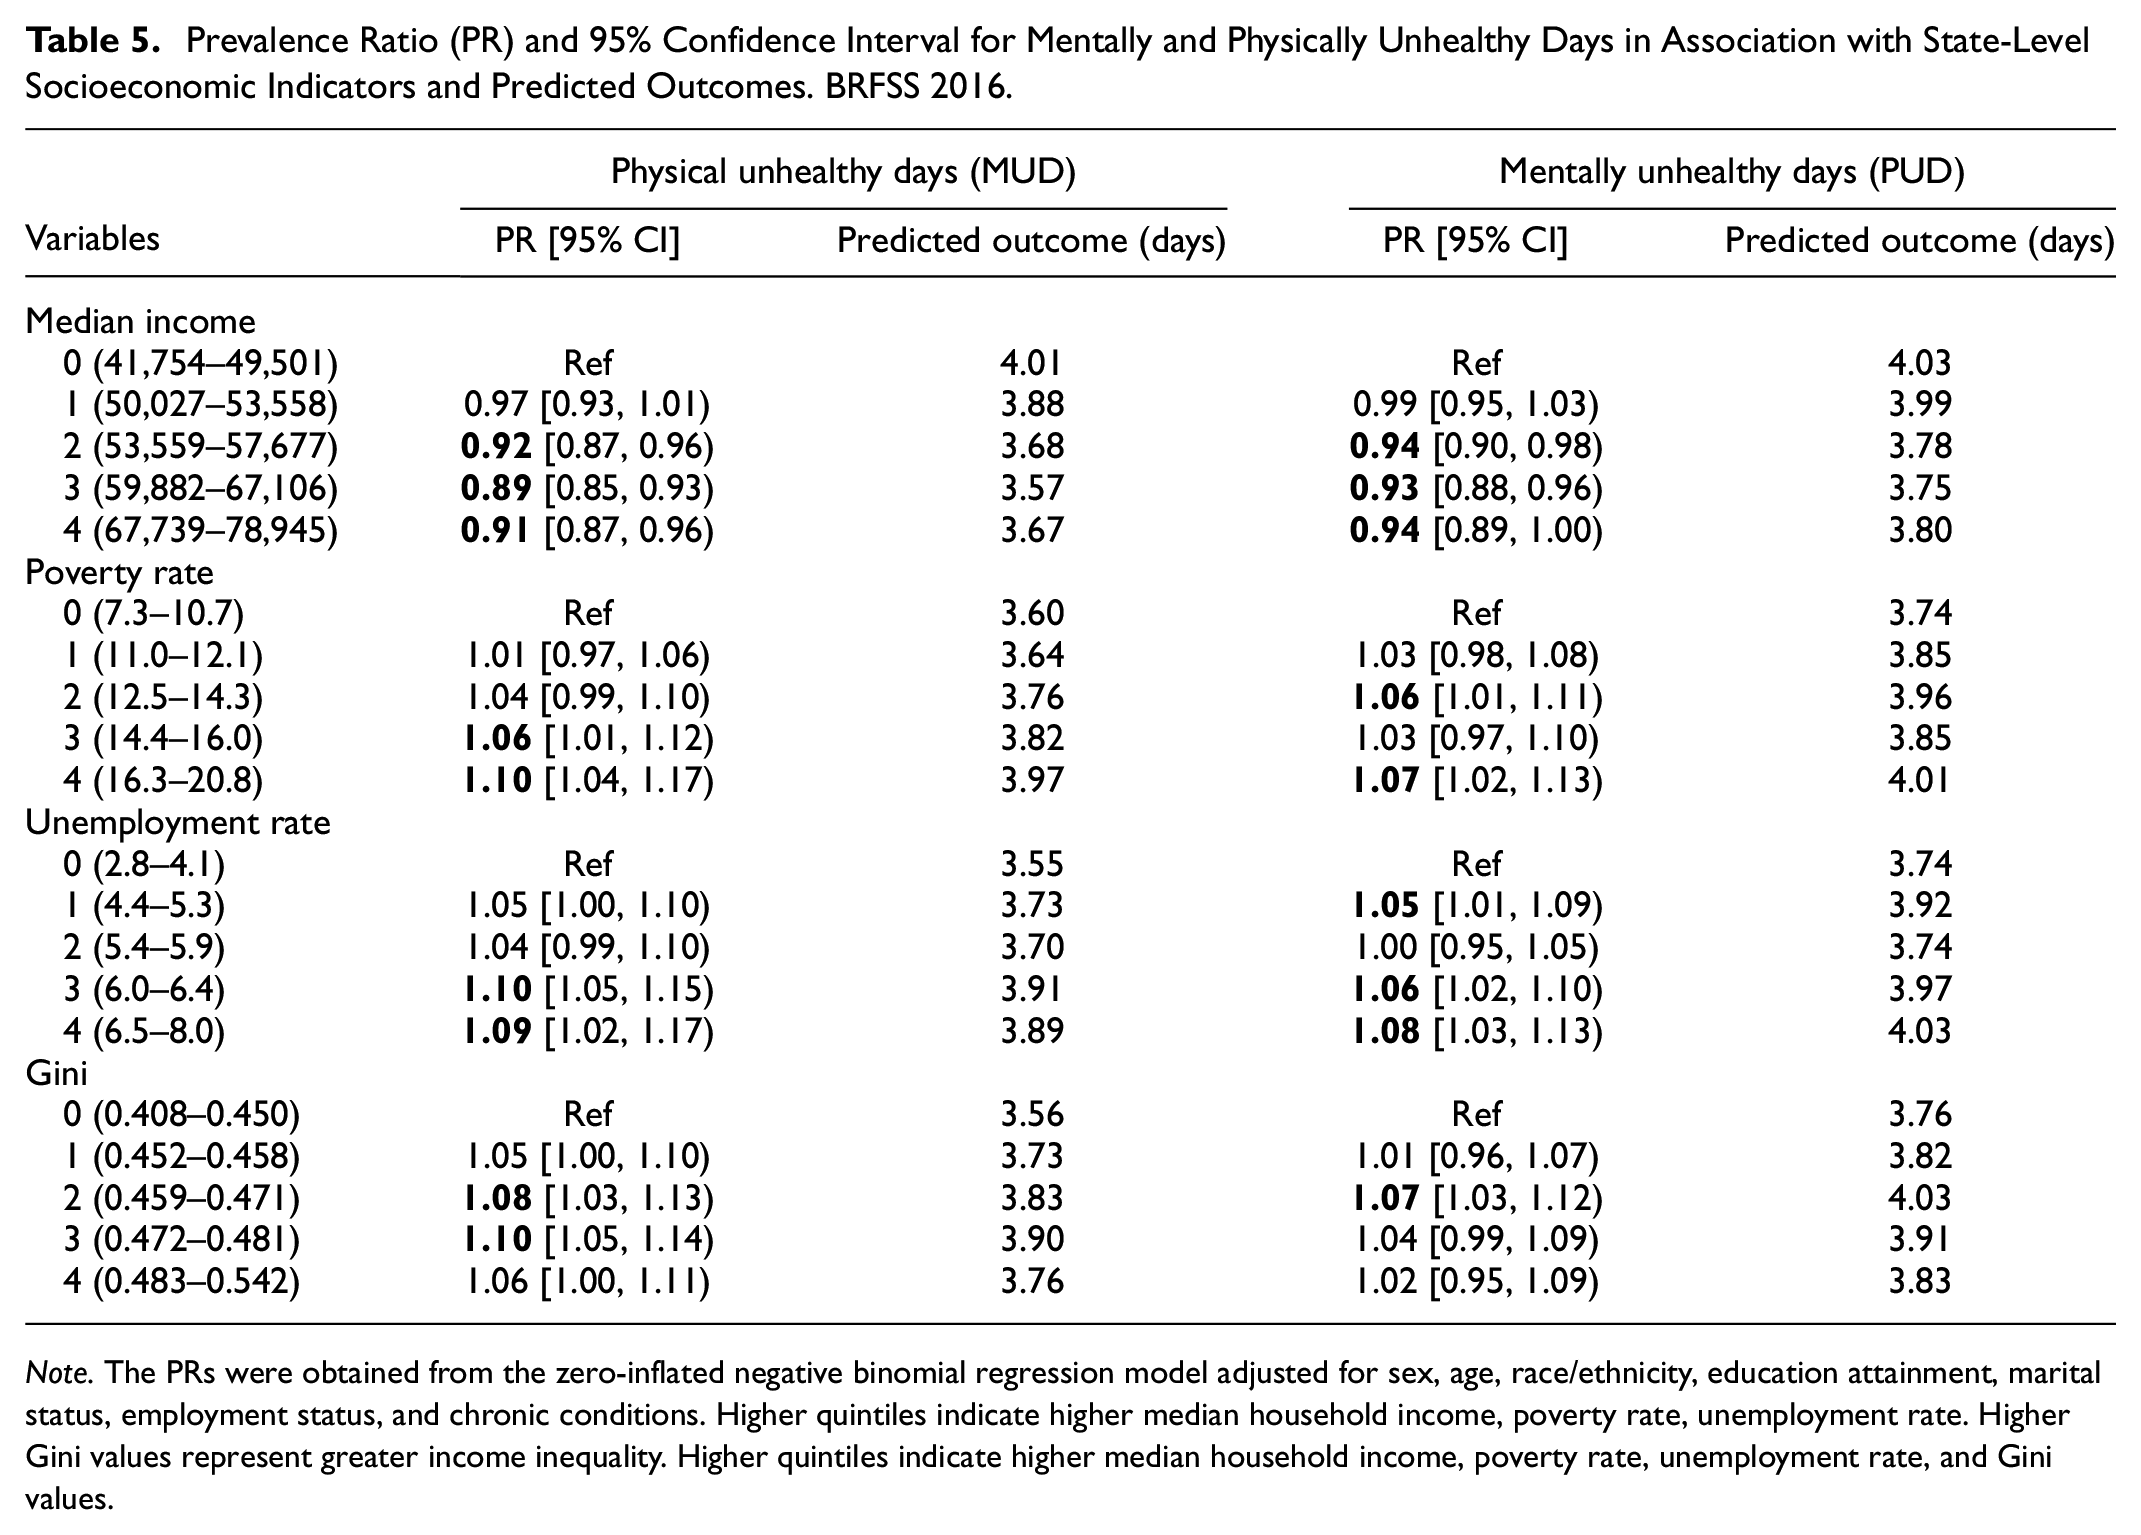
Note. The PRs were obtained from the zero-inflated negative binomial regression model adjusted for sex, age, race/ethnicity, education attainment, marital status, employment status, and chronic conditions. Higher quintiles indicate higher median household income, poverty rate, unemployment rate. Higher Gini values represent greater income inequality. Higher quintiles indicate higher median household income, poverty rate, unemployment rate, and Gini values.
Discussion
Physical and mental health outcomes continue to be a significant public health concern. Accumulating evidence indicated relationships between socioeconomic factors at various levels and physical (mental) health outcomes (Dube et al., 2019; Jia et al., 2004). The current study utilized zero-inflated negative binomial modeling to investigate how state-level and individual-level socioeconomic factors are associated with American adults’ self-reported general health complaints, in terms of mentally, and physically unhealthy days (Eric et al., 2020), by controlling for individual-level covariates.
First, results of the zero-inflated statistical models identified that individual-level demographic variables, such as sex and marital status, and individual-level socioeconomic variables, such as educational attainment, and median household income, were significantly associated with the likelihood of being in excessive zeros membership of MUD and PUD. Overall, this study found that the following groups were more likely to report excessive zero mentally and physically unhealthy days: Men, older individuals, minorities, persons with higher educational attainment levels, persons who were employed, persons who were married or with a partner, and persons with one or zero chronic condition. This finding was aligned with a recent study utilizing these factors for MUD (Eric et al., 2020). For instance, persons who were with less conditions may not pay close attention to their health status and underestimate the MUD or PUD compared to individuals with two or more chronic conditions.
The excessive zeros might represent the actual absence of unhealthy days if someone was indeed mentally healthy in the last 30 days in the zero-inflated models. However, certain individuals might have reported zero unhealthy days due to the subjective attitude/perception to this question, but the response may not represent an actual absence of sickness. In other words, two types of individuals might reach identical outcomes (zero) through two different processes. The first type of individual was sure to have zero unhealthy days. The second type of individual could indicate a higher than zero unhealthy days under a different circumstance other than this interview. Thus, the number of zeros might be inflated due to the second type of individual. Subgroups with higher incidence of selecting excessive zeros may have a higher level of influence on the survey quality and follow-ups may be needed to figure out the reasons and obtain actual number of mentally and physically unhealthy days from respondents.
It was not surprising that the results in the zero-inflated models show different association directions than those in the negative binomial part. The results from the negative binomial part should be used to interpret the main effects of the relevant predictors on true MUD or PUD. In contrast, the zero-inflated part should be used to identify factors that may underlie the presence of excessive zeros in responses. It is common to identify different patterns of associations when researchers employ the zero-inflated models (Eric et al., 2020; Lee et al., 2016; Zhou et al., 2014).
Concerning the effects of individual-level SES, previous studies also reported that persons with higher educational attainment levels and higher median household income were more likely to report poor mental and physical health (Dube et al., 2019; Matthews & Gallo, 2011). We expected most individual-level factors were statistically significant due to the large sample size.
Few studies have examined the association between MUD or PUD and state-level socioeconomic factors (Jia et al., 2004). Some studies examined the effects of socioeconomic factors at other macro-level (e.g., county or community) indicators. For example, lower county-level socioeconomic status, such as higher poverty rate, higher Gini values, lower median income, and higher unemployment rate, were all associated with higher number of MUD or PUD (Barile et al., 2015; Jia et al., 2009). Similar conclusions were reached using community-level poverty measures (Callahan et al., 2011). These findings also align with previous research relating state-level socioeconomic factors to certain health conditions (e.g., hypertension or current depression (Fan et al., 2011, 2015).
When comparing between the strengths of associations between state-level and individual-level factors based on predicted MUD or PUD, the relationships were stronger for individual-level predicators than state-level predicators. Such findings were consistent with prior literature that compared community-level (neighborhood-level) and individual-level SES (Robert, 1998; Ross & Mirowsky, 2008). The results were acceptable due to the small sample size at the state-level. The significance findings were meaningful to consider state-level SES an additional dimension that influences persons’ health.
Implications for Practices and Policies
Healthy People 2020 (Determinants of Health, n.d.) highlighted an ecological approach to address both individual-level and population-level determinants of health. Healthy People 2030 will continue to manage the significance of state-level support to achieve the Nation’s optimal health (What is the Healthy People 2030 framework?, n.d.). Social determinants of health, including conditions where people live, learn, work, and play, influence health outcomes (Social Determinants of Health, n.d.). These factors profoundly affect one person’s health (Williams et al., 2008) and have been investigated in research as they can be changed through intervention and policy (Andermann, 2016).
A critical aspect of the social determinant (Raphael, 2006) is economic stability. This study provides new evidence on the associations between state-level and individual-level socioeconomic factors are and adult population’s self-reported mental and physical health conditions. At the state-level, the significant associations support the idea of integrating state-level contextual factors when tracking and interpreting mental and physical health disparities in the target population. Collaborations across agencies at the state level with relevant policies and interventions based on contextual determinants of health are significant in reducing health disparities across socioeconomic classes. “Health in all policies” (Rudolph et al., 2013), a collaborative approach to improving the health of all people, adds health as a legitimate consideration for government agencies, including state legislatures, to consider the distribution of health impacts across population segments. In addition, policy and interventions should target the vulnerable groups (e.g., people who are unemployed and with chronic conditions) to eliminate SES disparities at the individual level.
Focus groups could be used to further explore responses by subgroups with excessive amount of zeros MUD or PUD to determine whether they respond differently to the questions after further probing. Then under-report of unhealthy conditions can be observed, and interventions may be provided to better serve individuals’ needs to improve their health conditions.
Limitations, Future Directions, and Conclusions
First, we included common individual and state-level socioeconomic factors. Other social determinants of health, including education, social, and community resources, health care, and neighborhood context (Ayón et al., 2010; Determinants of Health, n.d.; Social Determinants of Health (n.d.), may be considered in exploring their relationship with subjective health complaints in the future. Researchers may consider more local macro factors (e.g., county or census tract) with the state level factors simultaneously in the future. This study was conducted based on 2016 cross-sectional data. Future studies may employ BRFSS and ACS data in alternative or multiple years to cross-validate the results. The current research predominantly focused on the main effects of individual and state-level socioeconomic factors. Interactions between individual and state-level predictors may be investigated in the future. We pointed out potential reasons that may lead to a large number of zeros, and future research may focus on distinguishing fake zeros and true zeros. Finally, the survey is self-reported data with potential recall biases (Adams et al., 1999). Therefore, number of mentally and physically unhealthy days may suffer from potential inaccuracies. Measuring mental and physical health using one survey item respectively may not accurately represent the health status and a well-validated survey scale with similar purpose may be used in the future research. The current study is correlational, and we cannot build any causal relationships among variables.
A combination of BRFSS and ACS data enables us to investigate state-level and individual-level socioeconomic factors’ contribution to subjective mental and physical health complaints, controlling for the individual-level characteristics. While this investigation does not incorporate all likely predictors of physical and mental health, it includes a variety of potential state-level socioeconomic determinants in a single study. Counts of mentally and physically unhealthy days possess great utilities as a health outcome measure. Proper statistical models (i.e., zero-inflated models) should be used to facilitate the correct interpretation of the count data.
Supplemental Material
sj-docx-1-sgo-10.1177_21582440231194163 – Supplemental material for Investigating the Associations Between Socioeconomic Factors and Unhealthy Days among Adults Using Zero-inflated Negative Binomial Regression
Supplemental material, sj-docx-1-sgo-10.1177_21582440231194163 for Investigating the Associations Between Socioeconomic Factors and Unhealthy Days among Adults Using Zero-inflated Negative Binomial Regression by Jin Liu, Ning Jiang, Amy Z. Fan, William W. Thompson, Ruyi Ding and Shiguang Ni in SAGE Open
Footnotes
Declaration of Conflicting Interests
The author(s) declared no potential conflicts of interest with respect to the research, authorship, and/or publication of this article.
Funding
The author(s) disclosed receipt of the following financial support for the research, authorship, and/or publication of this article: This study was funded by the Shenzhen Key Laboratory of next generation interactive media innovative technology (Grant No. ZDSYS20210623092001004), the Shenzhen Key Research Base of Humanities and Social Sciences (Grant No. 202003), Shenzhen Education Science 2021 Annual Project (bskt21001).
Supplemental Material
Supplemental material for this article is available online.
References
Supplementary Material
Please find the following supplemental material available below.
For Open Access articles published under a Creative Commons License, all supplemental material carries the same license as the article it is associated with.
For non-Open Access articles published, all supplemental material carries a non-exclusive license, and permission requests for re-use of supplemental material or any part of supplemental material shall be sent directly to the copyright owner as specified in the copyright notice associated with the article.