
Abstract
Attention-deficit/hyperactivity disorder (ADHD) is a neurobiological disorder. Common symptoms are inattention, hyperactivity, impulsivity, and executive functions deficit, often with comorbidities. Main treatment involves pharmacological and non-pharmacological therapies (cognitive-behavioral therapy, psycho-pedagogical programs). Emerging non-pharmacological treatments include manual therapies (MTs) in mental health. Several MT techniques have shown effectiveness in ADHD. The objectives of this study are as follows: (a) to assess short-term effects and persistence of an MT program on neuropsychological (hyperactivity index through the Conners’ Global Index [CGI]) and neurophysiological (time–frequency domain parameters of heart rate variability [HRV]) variables in ADHD children, and (b) to test the feasibility of the design. This study was approved by the Parc Tauli Corporation Clinical Research Ethics Board (#2017311). Pilot, controlled, multidisciplinary study of eight children with ADHD randomly assigned to control group (CG; n = 4) and intervention group (IG; n = 4). Both followed multimodal treatment, and IG also received an MT program per week for 4 weeks. A physiotherapist and a psychologist analyzed short-term effects (1-week post-program) and persistence (36 weeks). Eight children (boys, 62.5%; girls, 37.5%) with an average age of 10.375 ± 0.74 years were included. Baseline HRV parameters showed basal sympathetic predominance. The MT program increased the parasympathetic activity, which was significantly maintained at 1 to 36 weeks; there were no changes in CG. One-week post-program IG showed significant CGI reduction (–7 points, p = .016*), CG without changes (p = .41), with significant differences CG – IG (p = .0097*), and very large effect size (d = 2.235); 36 weeks post-program showed no effects (IG, p = .293; CG, p = .247), without differences CG – IG (p = .369). The MT program reduced the hyperactivity index with a 1-week persistence and increased the parasympathetic activity with a 36-week persistence. More investigations are needed to generalize the outcomes. Additional research is planned to further explore the possibilities of MT in psychiatric disorders with autonomic imbalances.
Background
Attention-deficit/hyperactivity disorder (ADHD) is a neurobiological disorder (global prevalence: 5%–7%, boys: 2.5%–5.6%, girls: 1%) with a genetic substrate, and symptoms occur early in pediatric age. ADHD shows three main presentations: predominantly inattentive, hyperactive–impulsive, and combined inattentive and hyperactive–impulsive. Common symptoms are impaired attention development, hyperactivity, or inappropriate impulsivity showing executive functions deficit, information processing, behavior, familiar and academic adaptation difficulties, and psychosocial detrimental effects, often presented with other comorbidities. Health authorities describe recommendations to select the most appropriate diagnostic and therapeutic options for ADHD. Main treatment involves pharmacological (methylphenidate/atomoxetine/dexamfetamine) and non-pharmacological therapies (cognitive-behavioral, comorbidities treatment, and tailor-made educational psycho-pedagogical school programs; Diagnostic and Statistical Manual of Mental Disorders [5th ed.; DSM-5]; American Psychiatric Association [APA], 2013).
Physical therapy (PT) and manual therapy (MT) applications have been extended from traumatology and neurology to mental health (MH; Donaghy, 2003; Pliszka, 2007). Different PT and MT techniques have shown efficacy for certain mental disorders, offering non-pharmacological therapeutic options in a multidisciplinary approach for psychiatric conditions (Catalán Matamoros, 2009; Cazorla González & Cornellà i Canals, 2014; Everett et al., 2003; Moyer et al., 2014).
There is a growing interest in non-pharmacological therapeutic options, representing some PT and MT modalities in MH, an emerging opportunity in a multidisciplinary approach (Accorsi et al., 2014; Donaghy, 2003). The literature describes a clinical improvement of several MH disorders by applying some PT and MT as adjunctive therapies (Catalán Matamoros, 2009; Vancampfort et al., 2011).
Several techniques have shown improvement in the symptomatology of different mental disorders such as ADHD, stress, anxiety, eating disorders, or schizophrenia. Some of these techniques are MTs, guided physical exercise, basic body awareness therapy, psychomotricity, relaxation, and respiratory techniques. These techniques can improve independence, musculoskeletal symptoms, physical well-being, and quality of life (Bayo-Tallón et al., 2019; Catalán Matamoros, 2009; Cazorla González & Cornellà i Canals, 2014; Vancampfort et al., 2011).
MT investigations are focused on understanding their physio-psychological mechanisms and their clinical effects; currently, more researches investigate different MT modalities and their autonomic nervous system (ANS) effects. However, the current lack of knowledge of the neurophysiological mechanisms through which MTs act limits this approach. That is why there are more and more scientific studies investigating the relationship between different types of MTs and its effects on ANS. The theoretical basis on which the mechanisms of action of MT are based is focused on anatomical, physiological, and biomechanical changes, and these changes may cause an autonomic activation. For many years, MT was based on the biomechanical model, but this paradigm seemed not to be able to explain the clinical phenomena that patients experience after the application of MT techniques. Nowadays, the main mechanisms of action of MT are considered as neurophysiological. The purpose of this neurophysiological model is to explain the modulation of the central nervous system excitability, producing effects at three levels: peripheral, spinal, and supraspinal (Bialosky et al., 2018; Cook, 2011; Vigotsky & Bruhns, 2015).
The current literature has theorized about the functioning of MT through biomechanical and/or neurophysiological mechanisms but does not recognize a combined effect of both. The combined effects may be important to consider because the biomechanical parameters of MT can produce neurophysiological responses which may be dependent on dose, on the force generated by the specific MT intervention, or on the duration of application (Bialosky et al., 2018). Scientific literature also describes an association between psychological factors and muscle response (Williams et al., 2007).
Bialosky et al. proposed a model that integrated the neurophysiological, biomechanical, and psychological effects of MT. This model explained that when a mechanical stimulation (or a specific MT intervention) is applied to a part of the body produces a chain of neurophysiological effects. The immediate effect of the mechanical stimulation is a decrease in the muscles tone and an increase in the range of motion. This stimulus triggers a cascade of effects which start at the peripheral nervous system. Inflammatory mediators are delivered to the area of inflammation, and the information is sent to the spinal cord. Subsequently, different effects are produced, including the improvement of the muscular activity of the treated area and hypoalgesia. Consequently, it begins a feedback loop with the brain, including pain-related changes, ANS responses (modifications in cortisol levels, heart rate [HR], skin temperature, and conduction), changes in endocrine response, and non-specific responses (including patient expectations and the placebo effect, and psychological reactions to treatment). This model explains that there are different factors that may influence during and after a specific MT intervention, and these factors are involved in the positive effects of MT (Bialosky et al., 2018).
Heart rate variability (HRV) refers to HR beat-to-beat variations reflecting the interplay between sympathetic and parasympathetic influences on HR. It allows the heart to adapt to new circumstances by quickly detecting and responding to unpredictable stimuli. HRV is necessary to modulate the cardiac activity according to the changing situational demands and it is considered an indicator of the flexibility of the ANS, so it represents a biomarker of the ANS function (Pumprla et al., 2002; Appelhans & Luecken, 2006; Bayo-Tallón et al., 2019; Malik et al., 1996).
HRV has also been investigated in patients with psychiatric disorders, and it has also been defined a neurobiological marker of psychiatric illness (Servant et al., 2009). Decreases in HRV have been observed in executive function impairments and in psychiatric illnesses. Different psychiatric disorders are associated with reduction in baseline HRV (Alvares et al., 2016; Börger et al., 1999; Rash & Aguirre-Camacho, 2012; Rukmani et al., 2016). Considering HRV and many psychiatric disease clinical features relationship, new treatments effectiveness designed to increase HRV and improve symptoms in a concordant manner are being explored.
It has been theorized that many forms of manual medicine can act on ANS. Some studies have shown that MT can affect cardiac vagal control and modify neurovegetative variables. Cardiac vagal control has also been defined as vagal tone, vagal activity, or parasympathetic activity. In this sense, HRV has been determined as a good tool to assess changes in autonomic control of HR in a variety of conditions, but only recently in the context of MT, although a clear consensus on stimulatory or inhibitory effects has not yet been reached (Billman, 2013; Reyes del Paso et al., 2013). Few researchers have investigated neurophysiological effects of MT in the cranial field (Bayo-Tallón et al., 2019; Castro-Sanchez et al., 2010; Cutler et al., 2005; Milnes & Moran, 2007). Anatomical vagus nerve (VN) relations with musculoskeletal and myofascial structures in the suboccipital region, from its exit through the jugular foramen and along its pathway, support the hypothesis that MT treatments at this location might have effects on parasympathetic activity (Fernández-Pérez et al., 2008; Giles et al., 2013; Henley et al., 2008).
Donaghy defined PT and MT application in MH as a specialty that can offer a large arsenal of approaches aimed to improve symptoms and quality of life. The physiotherapist can also address autonomic imbalances through specific MT programs (Bayo-Tallón et al., 2019). PT and MT can provide excellent supports in mental patients’ evaluation and treatment, usually offered in conjunction with pharmacotherapy and psychotherapy in an interdisciplinary team (Donaghy, 2003). This is a pilot study that can offer preliminary information about a special MT program as adjuvant treatment of ADHD patients.
Primary Target
The primary target is to evaluate short-term effects of a MT program on neuropsychological (hyperactivity index) and neurophysiological (time and frequency domain parameters of HRV) variables in a group of school-age children diagnosed with ADHD (DSM-5 criteria) and under multimodal treatment (methylphenidate and cognitive-behavioral therapy), and to analyze the baseline values of the time and frequency domain parameters of HRV and the hyperactivity index and its evolution 36 weeks after receiving the MT program.
Secondary Target
The secondary target is to assess the feasibility, reliability, and validity of the proposed study design to plan a randomized controlled trial. Currently, a translation of the design is being carried out to specific populations of MH with autonomic imbalances.
Materials and Methods
Ethical Statement
This study was approved by the Parc Tauli Corporation Clinical Research Ethics Board (#2017311).
Criteria Selection of the Participants
Inclusion criteria
Children with psychiatric diagnosis of ADHD, aged between 6 and 12 years old, from a public pediatric health center service, under multimodal treatment over the course of the study, including methylphenidate (at least 3 months with the same pharmacologic treatment) and cognitive-behavioral therapy, were included.
Exclusion criteria
Children with organic chronic pathologies were excluded.
Withdrawal criteria
Children with non-compliance, premature abandonment, and adverse events were withdrawn from the study. Recommendations for intervention trials were followed (Chan et al., 2015).
Potential Confounding Variables
Potential confounding variables were tracked by an ad hoc questionnaire to allow exclusion of participants who did not meet the criteria, to change data collection dates, and to analyze outlier conditions. The following potential confounding variables that may influence HRV were considered: sleep routine on the day before the intervention (hours and quality of sleep were recorded), intense physical exercise was avoided on the same day of the assessment, and meals and caffeinated drinks were avoided at least 2 hr before the intervention. The participants were asked to empty their bladder before the experiment; medications and other simultaneous therapeutic treatments were recorded.
Enrollment
A meeting with parents was held. Explanation and information leaflet was given. Informed consent was obtained from patient’s parents following all bioethics procedures. Parents also received an information leaflet to proceed to a voluntary resignation sheet according to Spanish Data Protection Law, Good Clinical Practice (GCP) rules, and Helsinki Declaration.
Participants
Ten candidates were interested in participating, but two of them were not included due to their impossibility in completing the protocol. Finally, eight candidates fulfilled the requirements and were included (Figure 1). The final sample consisted of six boys (75%) and two girls (25%). They were randomized in two groups: control group (CG) and intervention group (IG). Each group was composed of three boys and one girl. Randomization was conducted using a random.org sequence (simple randomization). The mean age was 10.38 years (minimum 10–maximum 12, SD = 0.74), with a mean body mass index (BMI): 20.27 kg/m2. All participants finished the study.

Consolidated Standards of Reporting Trials (CONSORT) flow diagram.
Design and Scope of the Study
This is a pilot study in Phase II, which is controlled, multidisciplinary, randomized, and non-masked. It was specifically used to design a randomized controlled trial, and it is considered to be in Phase II (Collignon et al., 2018), because it allows to evaluate the consistency of the design, provides evidence on the feasibility of the design, and shows the clinical efficacy and safety of the MT intervention in a small sample with the specific condition of ADHD.
Both CG and IG were receiving multimodal therapy (methylphenidate and cognitive-behavioral therapy) at least for 3 months. In addition, IG received 1 weekly MT intervention for 4 consecutive weeks, performed by a physiotherapist, under controlled environment. All the actions were carried out on the same day of the week, at the same time, and in the same place to reduce bias.
MT Intervention
The basis to apply a 1-week MT intervention for 4 weeks was based on the study conducted by Bayo-Tallón et al. (2019). They studied the weekly evolution of the levels of low frequency (LF)/high frequency (HF) ratio after receiving the same MT program as the current study. They observed that the levels of the LF/HF ratio of the group who received the MT program displayed a weekly significant decrease until the fourth week. It meant a predominance of the parasympathetic activity during the process and reflected that the effects persisted for up to 4 weeks.
In the current study, the first follow-up was carried out 1 week after the last intervention, to study the short-term effects, trying to maintain the homogeneity regarding cadence, because treatment administrations were made every week. The long-term follow-up was carried out 36 weeks post-intervention, because all participants followed their academic year with normality, including the dates they had vacations, and therefore we tried to integrate the treatment program into daily life of the children.
The intervention program consisted of a 10-step sequence of a MT program which was applied in 30 min. The sequence consisted of 10 cranial techniques, which act on articular mobility, membranous structures relaxation and myofascial release, soft tissue and vascular and nervous structure stimulation. Clinical signs such as frontal transpiration, face and occipital region vasodilatation, decreased respiratory rhythm and muscular tone suggest intervention on the ANS (Bayo-Tallón et al., 2019; Botía Castillo, 2011; Downey et al., 2006; Harrison & Page, 2011; King et al., 2010; Upledger & Vredevoogd, 2004).
Theoretical basis of MT action focuses on the fact that the anatomical, physiological, and biomechanical changes generated by the different interventions of MT can activate the ANS. All VN branches with visceral efferent fibers contain afferent sensory fibers, making it a highly sensitive nerve (Howland, 2014). The anatomical relationship of the VN with the musculoskeletal and myofascial structures in the suboccipital region supports the theory that MT treatments at this location may have an effect on vagal functions (Giles et al., 2013).
Several psychiatric disorders coexisting with social cognition and executive functions deficit have been associated with reduction in baseline HRV (Alvares et al., 2016; Börger et al., 1999; Rash & Aguirre-Camacho, 2012; Rukmani et al., 2016).
Based on the anatomo-physiological relationships of the VN, the team conducted by Bayo-Tallón et al. investigated the effects of the 10-step sequence of an MT program, as each one of these techniques had a direct or indirect influence on the VN pathways after passing through the jugular foramen. The myofascial network in the cervical region is closely connected to the skeleton and to different organs of this region. The meninges are directly connected to fascial structures. The fascial system forms a set of compartments that envelop, separate, and support the muscles, bones, viscera, blood vessels, and nervous system. The phrenic nerve along its pathway anastomoses with the VN, innervating both the diaphragm. In addition, the VN is in contact with the spinal trigeminal nucleus by afferent connections. This means that a diaphragmatic dysfunction may produce symptoms that are observable in the cervical base region, mouth floor, dura, and eyes. Likewise, the reciprocal tension membranes are innervated by the trigeminal system, VN, and hypoglossal nerve (Bordoni & Zanier, 2015).
The techniques we applied were the same described by Bayo-Tallón et al. The techniques were the following: CV-4 technique or compression of the fourth ventricle, cranial base release or suboccipital technique, lumbo-sacral decompression (traction of the dural tube), release of the transverse diaphragms, frontal and parietal lift techniques, temporal techniques (temporal wobble, ear pull), myofascial release of temporo-mandibular joint, deep cervical fasciae technique, and CV-4 technique. These techniques have been reported to have relaxing effects, lower the tone of the sympathetic nervous system, change the diaphragm activity and the autonomic control of respiration, and increase the temperature in the suboccipital region (Bayo-Tallón et al., 2019; Botía Castillo, 2011; Downey et al., 2006; Harrison & Page, 2011; Upledger & Vredevoogd, 2004).
Variables and Source of Data
One week before the first MT session, the physiotherapist administered an ad hoc questionnaire to the subjects’ parents to collect data, including anthropometric variables: age, sex, weight, height, BMI, and pharmacological and psychological treatment regimen. Another ad hoc questionnaire, which collected potential confounding variables related to HRV, was administered by the psychologist before each MT intervention. Following all bioethics procedures, parents received the information leaflet to proceed to an informed consent and a voluntary resignation sheet according to the law, GCP, and Helsinki Declaration. The psychologist assessed the hyperactivity index (main neuropsychological variable) through the 10-item Conners’ Global Index (CGI) Spanish version for parents (Conners’ Parent Rating Scale–Revised [CPRS-R]; Conners et al., 1998) in both groups at the beginning, 1 week after the last intervention, and 36 weeks after the treatment.
The CPRS is a clinical tool for obtaining parental reports of childhood behavior problems. It is commonly used for diagnosing ADHD in children and adolescents (Conners et al., 1998). It is composed of four subscales: Oppositionism, Inattention, Hyperactivity, and Hyperactivity Index (CGI). This scale assesses behavioral problems, learning problems, somatization, hyperactivity–impulsivity, and anxiety, and provides a hyperactivity index (CGI).
Time and frequency domain parameters were used to analyze HRV, with a particular focus on the variables depicting vagal tone: the root mean square of successive differences (RMSSD) as a time domain parameter and the HF component as a frequency domain measure (Laborde et al., 2017). The LF component and LF/HF ratio were also considered because although a clear consensus has not been achieved (Billman, 2013; Reyes del Paso et al., 2013), both variables reflect a mixture of sympathetic and vagal influences, and the LF/HF ratio is classically considered to represent sympathetic-vagal equilibrium. Time and frequency domain parameters were collected by the physiotherapist using wireless monitoring and a Polar® thoracic chest strap H7 (Polar Electro, Inc., Bethpage, NY, USA; Capdevila et al., 2008) according to the recommendations for psychophysiological research related to HRV (Laborde et al., 2017; Quintana et al., 2016). Participants remained 10 min resting in the supine position in a relaxed state before collecting this variable. Time and frequency domain parameters of HRV were collected by the physiotherapist in the IG before and 10 min after receiving each one of the four interventions to assess the short-term effects of the MT intervention and its evolution throughout the study. Subsequently, the physiotherapist collected the same HRV parameters 1 week after the last intervention and 36 weeks after the treatment to assess the persistence of the effects and to determine whether the variables related to HRV returned to the baseline values. The HRV parameters of the CG were also collected by the physiotherapist at the beginning, 1 week, and 36 weeks after the program, so as to compare the values of HRV parameters between both groups. There is a description of all variables in Table 1.
Variables and Measuring Instruments.

Note. Typology of the variables and their instruments of measurement. BMI = body mass index; CGI = Conners’ Global Index; CPRS-R = Conners’ Parent Rating Scale–Revised; HRV = heart rate variability.
The safety of interventions was assessed with an ad hoc questionnaire which was administered by the psychologist before receiving each intervention, 1 week after the last session, and 36 weeks after. It recorded attendance at scheduled appointments, the reasons why they did not attend any appointments, and any adverse effects.
Procedures
The physiotherapist applied 1 weekly intervention of the MT program for 4 weeks to the IG in addition to the multimodal therapy they were receiving, whereas CG only received the multimodal treatment. The psychologist collected the neuropsychological variable hyperactivity index through CGI questionnaire and the physiotherapist collected the neurophysiological variable (time and frequency domain parameters of HRV) as scheduled. The persistence of the effects of the MT program was measured 1 week after the last intervention, and 36 weeks after through the CGI questionnaire and through time and frequency domain parameters of HRV.
Statistical Analysis
Results were analyzed using MS® Excel® software and IBM® SPSS® v.26.0. Datasets were initially tested for normality using the Shapiro–Wilk test, and homoscedasticity was measured using Bartlett’s test for normally distributed data. A p value >.05 indicated a normal distribution, and Bartlett’s test with a p value >.05 indicated equality of variances. All variables were normally distributed with equality of variances, showing the variable CGI, p = .686; RMSSD, p = .464; LF, p = .678; HF, p = .469; and LF/HF ratio, p = .359, in the Shapiro–Wilk test. Bartlett’s test for all variables studied showed that variances were equal for all groups with a p value = .417 in the case of CGI, p value = .446 for the RMSSD variable, p value = .912 for the LF, p value = .67 for the HF component, and a p value = .66 for the LF/HF ratio.
Descriptive, univariate and bivariate analysis was performed related to objectives. Study groups were compared according to variable’s normality distribution (the t test as a parametric test for normally distributed variables). Initially, the HRV data from IG, before receiving each intervention, were compared with the same HRV data collected after each MT intervention within IG, to assess the immediate effects of each intervention and also the evolution of the HRV parameters. These data were compared between groups to determine the short-term effects of the intervention. The hyperactivity index (CGI) and HRV parameters were also collected at 1 and 36 weeks after the last intervention in both groups; they were compared within each group and between groups to study the persistence of the effects of each program and to determine differences between both programs.
For all analyses, significance was set at an alpha level of .05, and significance was defined as a p value <.05. Data were reported as means, standard deviations, minima, and maxima.
The effect size was measured using Cohen’s d for t tests (independent samples), where d ≤ 0.20 represented a small effect size, 0.20 < d ≤ 0.50 represented a medium effect size, 0.50 < d ≤ 0.80 represented a large effect size, and 0.80 < d > 1.30 represented a very large effect size.
To assess the statistical significance of the individual change of each subject, the reliable change index (RCI) was calculated as established by Jacobson and Truax (1991). RCI is a concept in measurement which represents a psychometric criterion used to evaluate whether a change over time of an individual score (i.e., the difference score between two measurements in time) is considered statistically significant. RCI represents a ratio, in which the numerator represents an actual observed difference score between two measurements, and the denominator is some form of standard error of measurement of the difference. An RCI indicates whether an individual change score (e.g., between a patient’s pre-intervention and post-intervention assessment) is statistically significantly greater than a difference that could have occurred due to random measurement error alone.

where Sdiff is the standard error of the difference of the measures [Sdiff = SD · √ (1 – Rxx) · √2]; SD being the standard deviation in the clinical sample and Rxx represents the reliability of the measurement.
X2 is the post-test score for each patient, X1 is the pre-test score for the same patient, and Sdiff describes the spread of the distribution of change scores that would be expected if no actual change occurred.
It is considered statistically significant if RCI ≥ 1.96 (represents improvement) or RCI ≤ –1.96 (deterioration) (z value corresponding to the point on a normal curve of 95% confidence levels). It follows from this algorithm that a significant change occurs when X2 post-test – X1 pre-test ≥ 1.96 × Sdiff or (X1 post-test – X1 pre-test) ≤ –1.96 × Sdiff.
Outcomes
Characteristics of the Participants
Eight children were included (62.5% boys, 37.5% girls), with an average age of 10.375 ± 0.74 years (minimum 10 years–maximum 12 years). The average BMI was 20.238 ± 2.96 kg/m2 (16.64–24.49). The average of the baseline CGI was 17.25 ± 5.675 points (8–24). The average of the basal RMSSD parameter was 60.88 ± 24.885 ms (29–94), the initial LF parameter showed an average of 1,209.75 ± 583.101 ms2/Hz (318–2,501), the initial average of the HF component was 801.75 ± 201.297 ms2/Hz (209.073–228.053), and the baseline average of LF/HF ratio was 1.45 ± 0.535 (0.573–0.59). All participants met the inclusion criteria, and the psychologist tracked the potential confounding variables related to HRV.
CGI at Pre-Intervention, at 1 and 36 Weeks Post-Program Within Groups and Differences Between Groups
Pre-intervention CGI
IG: CGI(average) = 14 points (SD = 5.89) (see Table 2). CG: CGI(average) = 20.50 points (SD = 3.51) (see Table 3). Initial differences between groups were not significant (p = .13), so groups could be considered homogeneous and comparable.
Intervention Group: Means, Standard Deviations, and Modifications of CGI and Heart Rate Variability Parameters at 1 and 36 Weeks Post-Program (Methylphenidate and Cognitive-Behavioral Therapy Plus Manual Therapy Program).

Note. Statistical analysis of baseline, 1 week, and 36 weeks post-intervention changes in intervention group using a t test for dependent variable means (parametric test for normally distributed variables). CGI = Conners’ Global Index; RMSSD = root mean square of successive difference between consecutive normal-to-normal (NN) intervals; LF = low frequency power; HF = high frequency power; LF/HF ratio = ratio of low frequency power/high frequency power; post = post-intervention.
p values with statistical significance.
Control Group: Means, Standard Deviations, and Modifications of CGI and Heart Rate Variability Parameters at 1 and 36 Weeks Post-Program (Methylphenidate and Cognitive-Behavioral Therapy).

Note. Statistical analysis of baseline, 1 week, and 36 weeks post-intervention changes in control group using a t test for dependent variable means (parametric test for normally distributed variables). CGI = Conners’ Global Index; RMSSD = root mean square of successive difference between consecutive NN intervals; LF = low frequency power; HF = high frequency power; LF/HF ratio = ratio of low frequency power/high frequency power; post = post-intervention.
p value with statistical significance.
CGI a week after the fourth intervention
IG: CGI(average) = 7 points (SD = 2.94); p = .016* (see Table 2). There was a significant CGI reduction of 7 points in the IG. CG: CGI(average) = 20.25 points (SD = 2.50); p = .41 (see Table 3). IG reduced their symptoms, whereas CG remained without changes. Differences between baseline and 1 week post-MT program between groups were significant (p = .0097*) with a Cohen’s effect size d = 2.235*, so MT program reduced the hyperactivity index with a very large effect size (greater than 0.80; see Table 4).
Comparisons between CG and IG and effect sizes at 1 and 36 weeks post-intervention.

Note. Statistical analysis of changes at 1 and 36 weeks post-intervention between CG and IG using t tests for the independent variable means (parametric test for normally distributed variables). The effect size was measured using Cohen’s d for t tests (independent samples), where d ≤ 0.20 represented a small effect size, 0.20 < d ≤ 0.50 represented a medium effect size, 0.50 < d ≤ 0.80 represented a large effect size, and 0.80 < d > 1.30 represented a very large effect size. CG = control group; IG = intervention group; CGI = Conners’ Global Index; RMSSD = root mean square of successive difference between consecutive NN intervals; LF = low frequency power; HF = high frequency power; LF/HF ratio = ratio of low frequency power/high frequency power.
p values with statistical significance.
CGI 36 weeks after
CGI reached approximately its initial score in both groups. IG: CGI(average) = 15.25 points (SD = 2.21), p = .293 (see Table 2). CG: CGI(average) = 21 points (SD = 2.449), p = .247 (see Table 3).
After 36 weeks post-intervention, differences between groups were not significant (p =.369; see Table 4). The effects did not remain after 36 weeks.
Pre-intervention time and frequency domain parameters of HRV
IG: RMSSD(average) = 70.50 ms (SD = 18.156) (see Table 2). CG: RMSSD(average) = 51.25 ms (SD = 29.466) (see Table 3). Initial differences between groups were not significant (p = .154). The initial LF average in the IG was 1,477.5 ms2/Hz (SD = 529.508; see Table 2) and in the CG was 9,425 ms2/Hz (SD = 567.271; see Table 3). Initial differences between groups were not significant (p = .108). HF component(average) = 921 ms2/Hz (SD = 144.67; see Table 2). CG: HF component(average) = 682.50 ms2/Hz (SD = 188.929; see Table 3). Initial differences between groups were not significant (p = .091). The initial LF/HF ratio average in the IG was 1.59 (SD = 0.474; see Table 2) and in the CG was 1.32 (SD = 0.625; see Table 3). Initial differences between groups were not significant (p = .253). In all cases, initial differences between groups showed a p value >.05, so groups could be considered homogeneous and comparable.
Time and frequency domain parameters of HRV 1 week post-program
RMSSD
IG: RMSSD(average) = 77.75 ms (SD = 7.804), p = .13 (see Table 2). There was an increase of +7.25 ms in the IG (p = .13). CG: RMSSD(average) = 51.50 ms (SD = 26.134), p = .486 (see Table 3). The IG showed a tendency to increase the RMSSD parameter, which is related to parasympathetic activity, although there were no significant changes. Differences between baseline and 1 week post-MT intervention between both groups were not significant (p = .224; see Table 4).
LF
IG: LF(average) = 981.75 ms2/Hz (SD = 524.367), p = .018* (see Table 2). There was a significant decrease of –495.75 ms2/Hz in the IG. CG: LF(average) = 758.75 ms2/Hz (SD = 398.661), p = .162 (see Table 3). IG significantly reduced the LF component, which is the component with more influence on sympathetic activity, whereas CG remained without changes. Differences between baseline and 1 week post-MT intervention between groups were not significant (p = .261; see Table 4).
HF
IG: HF(average) = 1,109.25 ms2/Hz (SD = 232.462), p = .012* (see Table 2). There was a significant increase of +188.25 ms2/Hz. CG: HF(average) = 727.25 ms2/Hz (SD = 489.609), p = .413 (see Table 3). IG significantly increased the HF component, showing a clear influence on parasympathetic activity, whereas CG remained without changes. Differences between baseline and 1 week post-MT intervention between groups were not significant (p = .241; see Table 4).
LF/HF ratio
IG: LF/HF ratio(average) = 0.82 (SD = 0.264), p = .011* (see Table 2). There was a significant reduction of –0.75. CG: LF/HF ratio(average) = 1.40 (SD = 0.80), p = .429 (see Table 3). IG significantly decreased the LF/HF ratio showing a clear influence on parasympathetic activity, whereas CG remained without changes. Differences between baseline and 1 week post-MT intervention between groups were not significant (p = .063), but there was a tendency to significant changes (see Table 4).
Time and frequency domain parameters of HRV 36 weeks post-program
The variable RMSSD reached approximately its initial score in both groups. IG: RMSSD(average) = 72.25 ms (SD = 10.144), p = .372 (see Table 2). CG: RMSSD(average) = 50.50 ms (SD = 28.301), p = .457 (see Table 3).
After 36 weeks post-intervention, differences between groups were not significant (p = .383; Table 4). The effects did not remain after 36 weeks.
The variable LF showed the following values. IG: average of the LF component = 1,000 ms2/Hz (SD = 499.524), p = .032* (see Table 2). There was a significant decrease of –477.50 ms2/Hz with respect to baseline values. CG: LF(average) = 658.75 ms2/Hz (SD = 454.01), p = .011*, with a significant reduction of –283.25 ms2/Hz (see Table 3). Both groups showed a decrease in the sympathetic activity.
After 36 weeks, differences between groups were not significant (p = .383; Table 4). The effects did not remain after 36 weeks.
The variable HF showed an average of 1,087.25 ms2/Hz (SD = 316.58), p = .081 (see Table 2) in the IG. There was a tendency to increase the HF component (+166.25 ms2/Hz) with respect to baseline values, which meant the predominance of the parasympathetic activity. CG: HF(average) = 663.75 ms2/Hz (SD = 411.563), p = .447 (see Table 3).
After 36 weeks, differences between groups were not significant (p = .143; Table 4). The effects did not remain after 36 weeks.
The LF/HF ratio showed an average of 0.89 (SD = 0.158), p = .023* (see Table 2) in the IG. Results showed a significant decrease of –0.71 with respect to baseline values. Outcomes meant that parasympathetic activation persisted for up to 36 weeks in the IG. CG: LF(average) = 1.07 (SD = 0.49), p = .18 (see Table 3).
After 36 weeks, differences between groups were not significant (p = .0984; Table 4), so the effects did not remain after 36 weeks, but there was a tendency to significant changes between groups (see Table 4).
Evolution of HRV parameters in IG
Although no statistically significant variations were observed in the RMSSD component, the baseline value was 70.5 ms (SD = 18.15), which significantly increased +22.75 ms after the first session of MT (p = .0244*). Before receiving the second session, it decreased to 61.75 ms (SD = 74.33), and before the third and fourth sessions, the values were 74 and 67.5 ms, respectively (Table 5 and Figure 2). The RMSSD showed a tendency to increase after all the MT interventions (pre–post differences) and the levels of RMSSD after 1 and 36 weeks post-program remained over the baseline value (showing the predominance of the parasympathetic activity after the program; Figure 2).
Modifications of the Time and Frequency Domain Parameters of HRV in the IG: Before and After Each Intervention, at 1 and at 36 Weeks Post-Intervention.
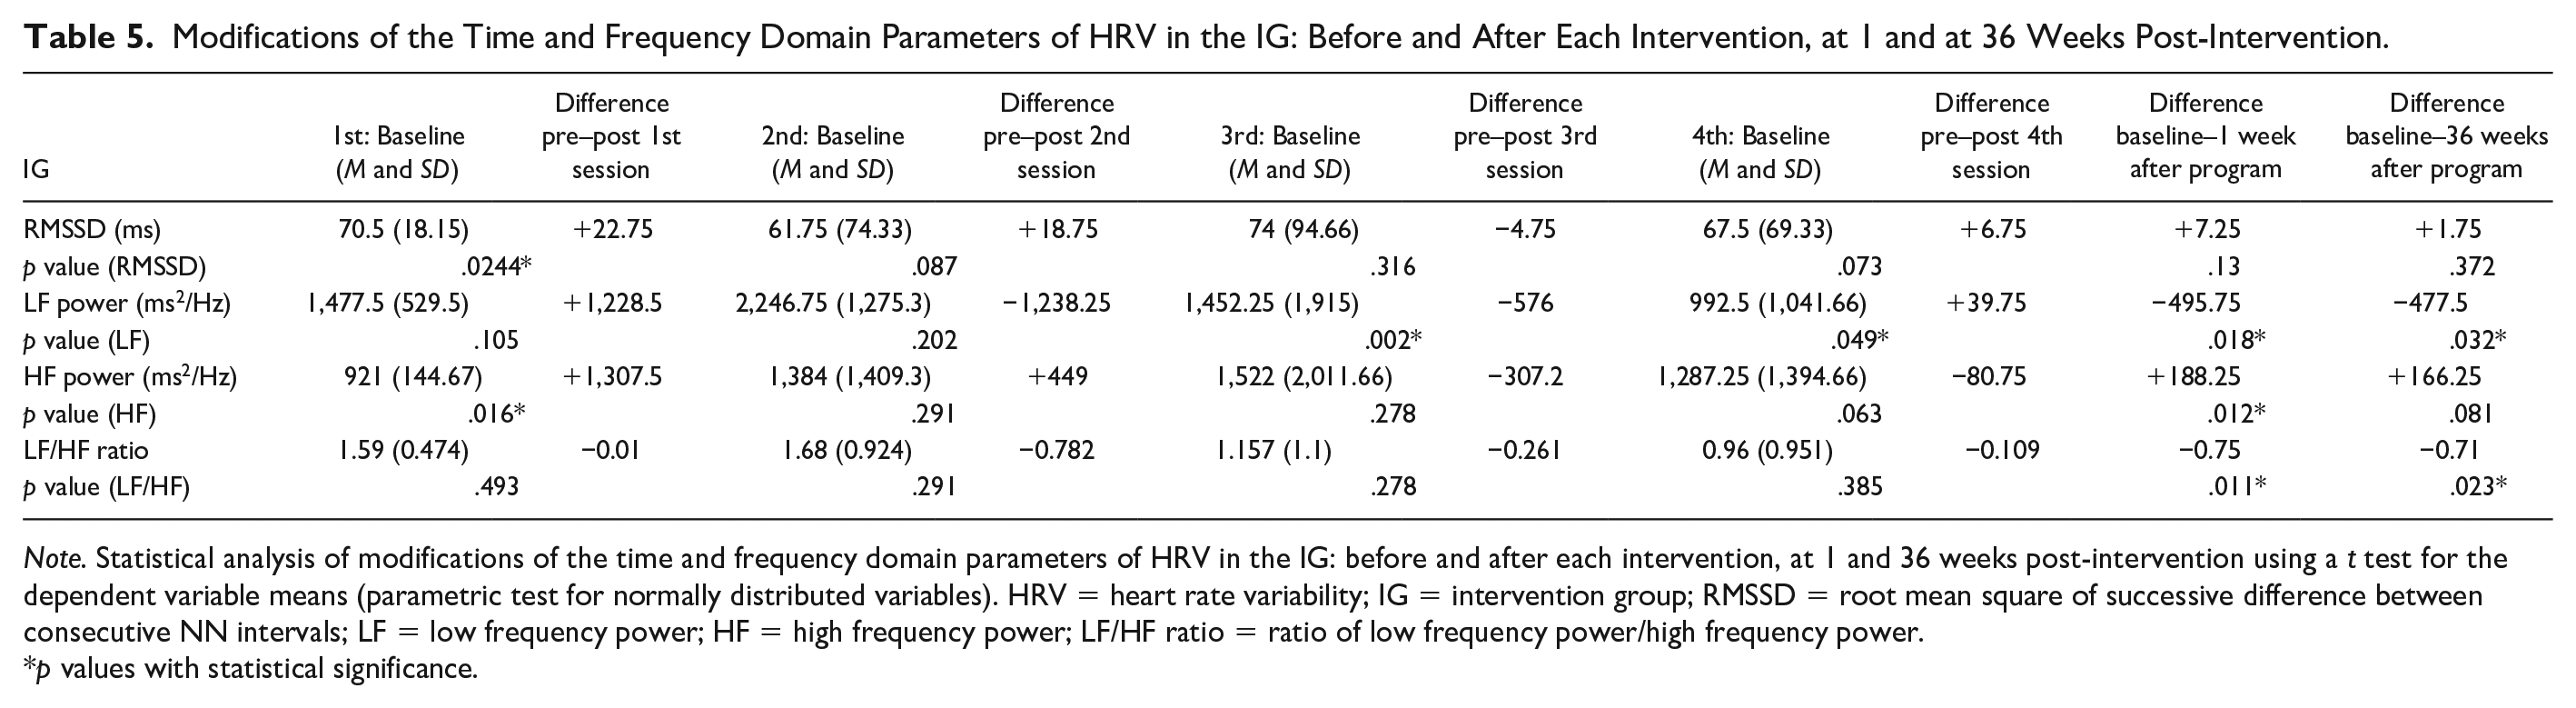
Note. Statistical analysis of modifications of the time and frequency domain parameters of HRV in the IG: before and after each intervention, at 1 and 36 weeks post-intervention using a t test for the dependent variable means (parametric test for normally distributed variables). HRV = heart rate variability; IG = intervention group; RMSSD = root mean square of successive difference between consecutive NN intervals; LF = low frequency power; HF = high frequency power; LF/HF ratio = ratio of low frequency power/high frequency power.
p values with statistical significance.
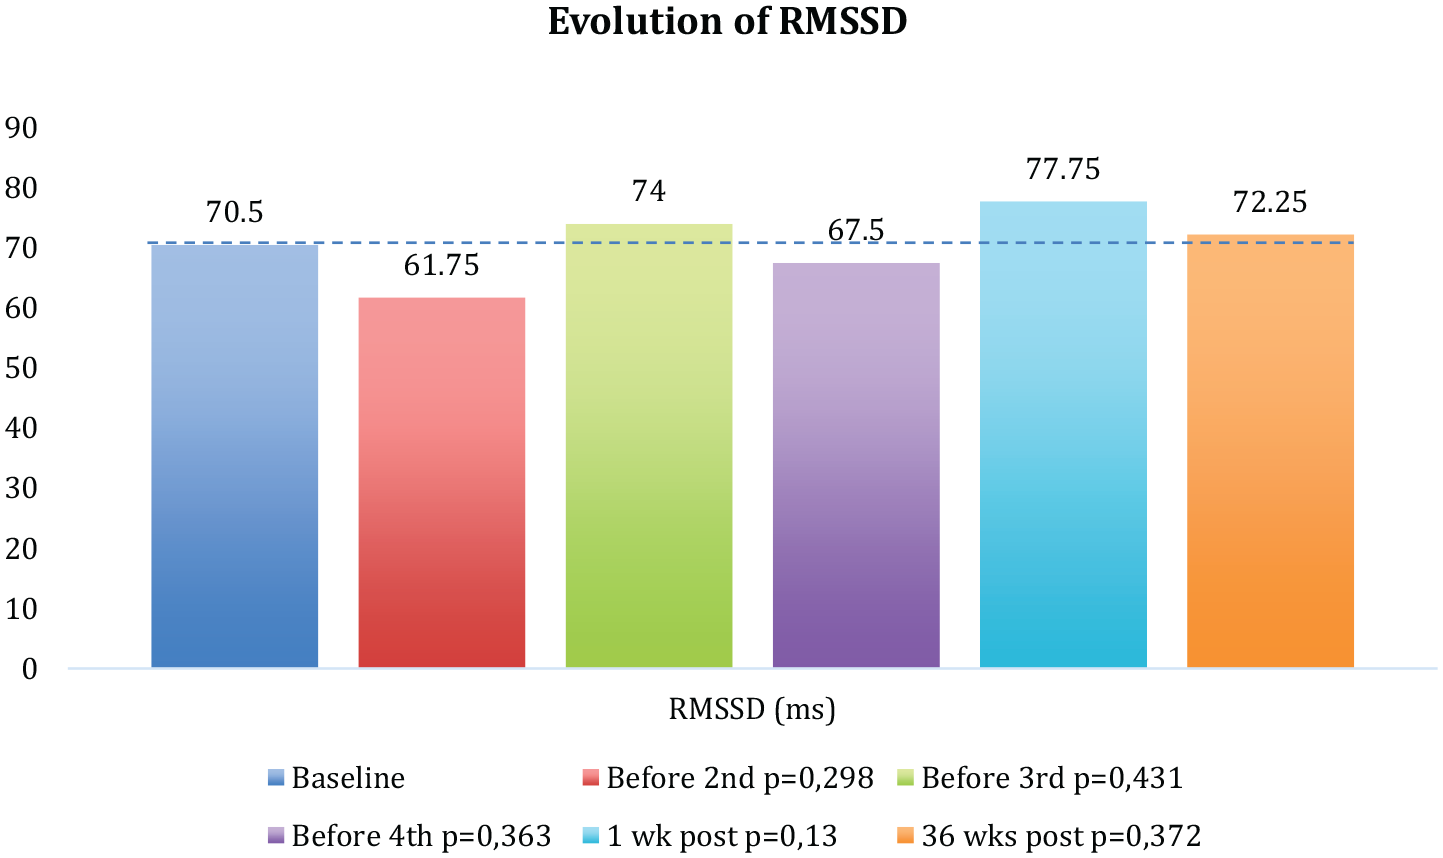
Evolution of the RMSSD component since baseline up to 36 weeks post-program in the intervention group.
The baseline value of the LF component was 1,477.5 ms2/Hz (SD = 529.5), which increased +1,228.5 ms2/Hz after the first session of MT (p = .105). Before receiving the second session, it increased to 2,246.75 (SD = 1,275.3), and before the third and fourth sessions, the values were 1,452.25 and 992.5 ms2/Hz, respectively (Table 5 and Figure 3). After the third session, the LF component significantly decreased (pre–post differences), and the levels of LF after 1 and 36 weeks post-program remained under the baseline values (Table 5; showing the decrease of the sympathetic activity after the program with respect to the baseline values—Figure 3).

Evolution of the LF component since baseline up to 36 weeks post-program in the intervention group.
The baseline value of the HF component was 921 ms2/Hz (SD = 144.67), which significantly increased +1,307.5 ms2/Hz after the first session of MT (p = .016*; Table 5). Before receiving the second session, it increased to 1,384 ms2/Hz (SD = 1,409.3) with a p value of .0005*, and before the third and fourth sessions, the values were 1,522 and 1,287.25 ms2/Hz, respectively (Table 5 and Figure 4). The values of the HF component always remained over the initial score (showing the increase of the parasympathetic activity after the program; Figure 4).
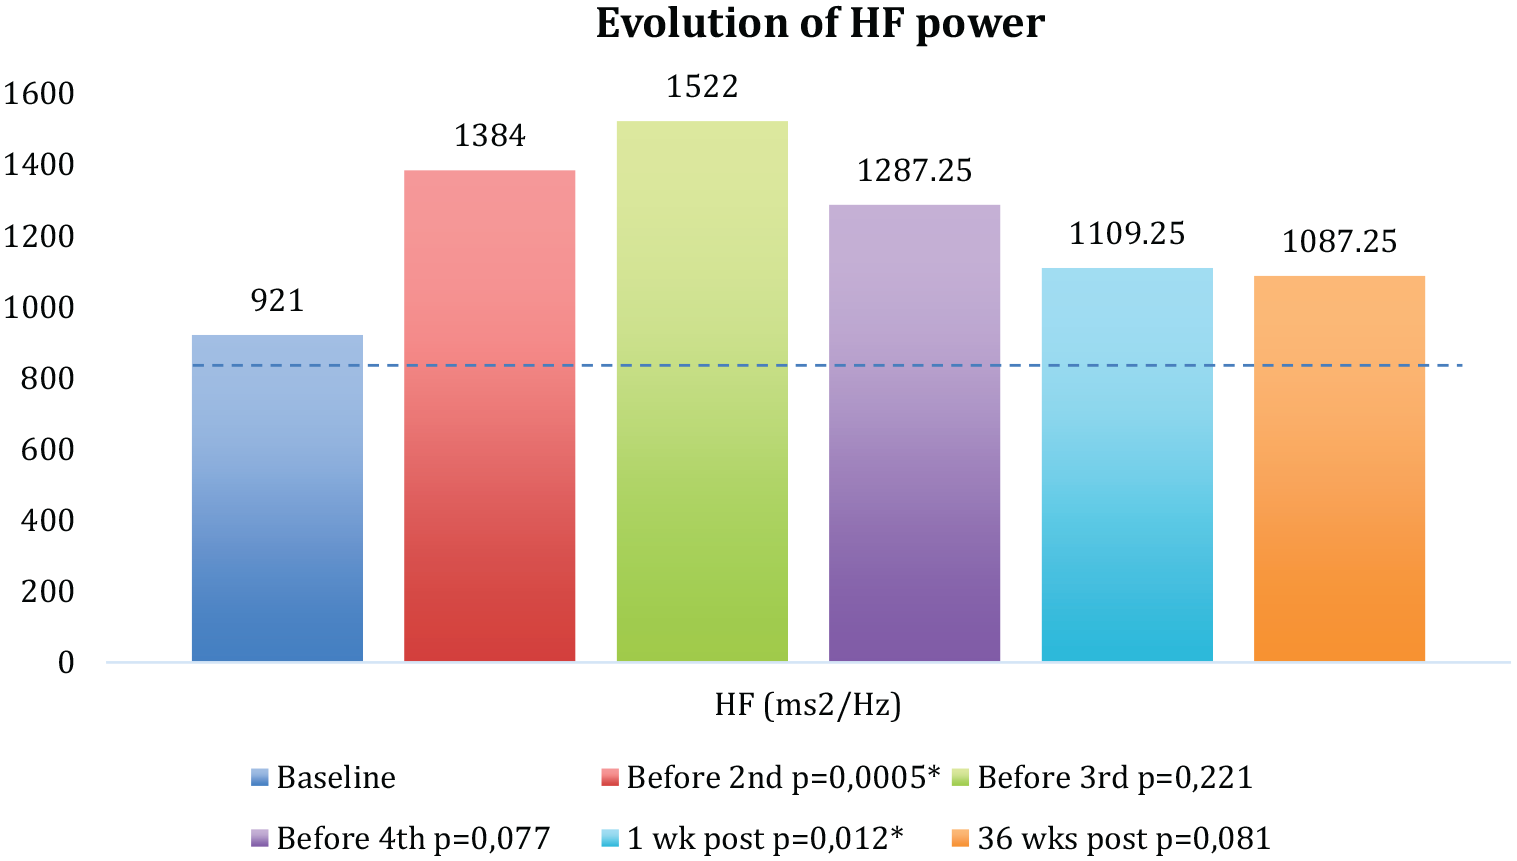
Evolution of the HF component since baseline up to 36 weeks post-program in the intervention group.
The initial value of the LF/HF ratio was 1.59 (SD = 0.474), which decreased –0.01 ms2/Hz after the first session of MT (p = .493; Table 5). Before receiving the second session, it increased to 1.68 (SD = 0.924), and before the third and fourth sessions, the values were 1.157 and 0.96 (p = .04*), respectively (Table 5 and Figure 5). The values of the LF/HF ratio always remained under the baseline values with statistical significant results (showing the increase of the parasympathetic activity and/or the decrease of the sympathetic activity after the program; Figure 5).

Evolution of the LF/HF ratio since baseline up to 36 weeks post-program in the intervention group.
Reliable clinical index including absolute values and percentages of deterioration, stability, and improvement 1 and 36 weeks post-program
Table 6 shows the standard deviation of the difference (SDdiff) and the reliable change criterion (RCcrit) at 1 and 36 weeks follow-up of both groups and the reliable improvement or deterioration of each variable in CG and IG. The outcomes with respect to reliable change of each variable were expressed in absolute values and percentages between a patient’s pre-intervention and 1 and 36 weeks follow-up assessment. The reliable improvement or deterioration of each variable between baseline and 1 and 36 weeks follow-up was defined as a decrease or an increase, up or down, greater than RCcrit.
SDdiff Between Baseline–1 Week Post-Program and Baseline–36 Weeks Post-Program and RCcrit of CG and IG at 1 and 36 Weeks Post-Program.

Note. Statistical analysis of the reliable clinical index including absolute values and percentages of deterioration, stability, and improvement 1 and 36 weeks post-program. The RCI score was calculated according to the outcomes on baseline and a follow-up of 1 and 36 weeks post-program. It was considered statistically significant if RCI ≥ 1.96 (represents improvement) or RCI ≤ –1.96 (deterioration) (Jacobson & Truax, 1991). The criterion used is the 95% criterion. This means that a greater change in this value, which indicates improvement or deterioration, would only occur by unreliability of measurement alone in less than 5% of times that two measurements are made on the same person. SDdiff = standard deviation of the difference; RCcrit = the reliable change criterion; CG = control group; IG = intervention group; RCI = reliable change index; CGI = Conners’ Global Index; RMSSD = root mean square of successive difference between consecutive NN intervals; LF = low frequency power; HF = high frequency power; LF/HF ratio = ratio of low frequency power/high frequency power.
*p-values with statistical significance.
The SDdiff of the variable CGI (1 week post-program) of the CG was 1.25 with an RCcrit of 2.45, while the IG showed an SDdiff of 2.08 and an RCcrit of 4.07 (Table 6). This means that any change, up or down, greater than the value of the RCcrit should be regarded as reliable. Based on an RCI score of 1.96 or higher, after 1 week post-program, in the IG three participants (75%) improved versus one (25%) in the CG. In addition, no participants showed a deterioration in any group. The other participants remained stable (Table 6). After 36 weeks, the SDdiff of the CG was 0.32 with an RCcrit of 0.63, while the IG showed an SDdiff of 2.11 and an RCcrit of 4.14 (Table 6). Based on an RCI score of –1.96 or lower, two participants (50%) showed a deterioration while all participants of the IG remained stable (Table 6).
Regarding the variable RMSSD, the SDdiff (1 week post-program) of the CG was 6.59 with an RCcrit of 12.92, while the IG showed an SDdiff of 1.37 and an RCcrit of 2.68 (Table 6). After 1 week post-program, based on an RCI score of 1.96 or higher, three participants (75%) improved in the IG versus one (25%) in the CG. In addition, one participant (25%) deteriorated both in the IG and in the CG (RCI score of –1.96 or lower). The other participants remained stable (Table 6). After 36 weeks, the SDdiff of the CG was 5.69 with an RCcrit of 11.14, while the IG showed an SDdiff of 4.09 and an RCcrit of 8.02 (Table 6). Based on an RCI score of 1.96 or higher, two participants (50%) showed an improvement in the IG versus one (25%) in the CG. In addition, no participants showed a deterioration after 36 weeks in any group and the other remained stable (Table 6).
The values of the rest of the variables (SDdiff and the RCcrit) and the absolute values and percentages indicating the improvement, deterioration, or stability are shown in Table 6. The reliable changes obtained in the HF parameter were especially significant, because the 100% of the participants showed a reliable improvement 1 week after receiving the MT program, and, 36 weeks after the program, these results were maintained in the 75% of the cases. No clinical deterioration was observed in any of the groups.
Comparison of baseline values of time and frequency domain parameters of HRV of children with ADHD (current phase) with children without associated disorders (previous phase)
Regarding indicators of HRV, the baseline values of HRV parameters showed a predominance of the baseline sympathetic activity in those children with ADHD compared with those without associated disorders (studied in the previous phase; Table 7).
Comparison of Baseline Values of Time and Frequency Domain Parameters of HRV of Children With ADHD (Current Phase) With Children Without Associated Disorders (Previous Phase).

Note. Baseline values including mean and standard deviation of time and frequency domain parameters of HRV of children with ADHD (current study) and children without associated disorders (previous phase of the study, already published, Bayo-Tallón et al., 2019). Statistical analysis using t tests for independent variable means (parametric test for normally distributed variables). HRV = heart rate variability; ADHD = attention-deficit/hyperactivity disorder; RMSSD = root mean square of successive difference between consecutive NN intervals; LF = low frequency power; HF = high frequency power; LF/HF ratio = ratio of low frequency power/high frequency power.
Discussion
Evidences recommend multimodal treatment, including pharmacological, psychological, and psycho-pedagogical therapies in ADHD children and moderate–severe impairment (APA, 2013); nevertheless, physical treatments, including MT programs, could have a role as an adjuvant treatment in MH due to its effect on musculoskeletal system, motor function, biochemical parameters, and ANS (Accorsi et al., 2014; Castro-Sanchez et al., 2010; King et al., 2010; Milnes & Moran, 2007; Pickar & Bolton, 2012; Rash & Aguirre-Camacho, 2012; Rukmani et al., 2016).
Our outcomes suggested that the proposed MT program reduced significantly the hyperactivity index in ADHD children, although this improvement did not persist as long as 36 weeks, with a very large effect size, whereas no changes were observed in the CG. These results were supported by the RCI, showing that 75% of the children of the IG showed an improvement in the hyperactivity index that remained until 1 week after the last session.
In the current study, our results showed that children with ADHD had a reduction in baseline HRV reflected on a decrease in baseline values of RMSSD and HF component, and a baseline increase in the LF component and LF/HF ratio compared with those children without associated disorders of the previous phase. This fact provides evidence for the basal sympathetic predominance in the sample of ADHD children, and reflects an underlying deficiency in self-regulation, which initially predicted a worse vagal heart control in the ADHD children. Nevertheless, after each one of the four interventions, the time (RMSSD) and frequency domain parameters of HRV (LF, HF, LF/HF ratio) showed an increase in the parasympathetic activity which was maintained at 1 and 36 weeks, reflecting the increase in the cardiac vagal control. As cardiac vagal control remained above baseline levels of each parameter of HRV, this meant a better self-regulation (better cardiac vagal control) in the children who received the MT interventions, which was represented by a predominance of parasympathetic activity.
Based on these findings, better self-regulation was induced in IG because after 1 and 36 weeks, the values of all HRV parameters did not return to its baseline values, reflecting a predominance of vagal cardiac control. The MT program induced a predominance of parasympathetic activity after each intervention, and the neurophysiological effects of the MT program persisted for up to 36 weeks.
These findings were confirmed from the reliable clinical index that showed that 75% of the children of the IG displayed an increase in parasympathetic activity after the MT program, which was maintained after 1 week.
We can also add that 50% of the IG maintained these results after 36 weeks. On the contrary, no changes were observed in any of these HRV parameters in the CG after 1 or 36 weeks post-program, revealing the stability of the symptoms of the CG, without any deterioration or improvement. The reliable changes obtained in the HF parameter were especially significant, because 100% of the participants showed a reliable improvement 1 week after receiving the MT program, and, 36 weeks post-program, these results were maintained in the 75% of the cases. No clinical deterioration was observed in any of the groups.
The core behavioral deficits of ADHD (attentional deficit, hyperactivity, and impulsivity) derive from a dysfunction of the executive system, and they also reflect an underlying deficiency in emotional self-regulation (Barkley, 2010). Self-regulation refers to automatic regulatory processes, and research has focused on identifying underlying correlates of self-regulation and reflecting self-regulation capacity at a physiological level, suggesting HRV as a marker of self-regulation (Reynard et al., 2011).
According to the “vagal tank theory,” higher resting cardiac vagal control is associated with better self-regulation (Laborde et al., 2018). Regarding the change between baseline and the effects produced after a specific MT intervention, higher resting cardiac vagal control predicts better self-regulation during this process (Laborde et al., 2018). Recovery is defined as the process of restoration to the initial condition (a change between weekly values and baseline values). This theory interprets the values obtained during the recovery process as follows: If cardiac vagal control increases during the intervention, better self-regulation occurs as the time during which the cardiac vagal tone remains above baseline level increases (Laborde et al., 2018).
Current landscape around physiological and neurovegetative MT effects shows heterogeneity in scientific evidences, but many of them show promising results in MH, and particularly in ADHD, describing that MT could modify the ANS’s activity, shifting the neurovegetative balance toward a parasympathetic predominance (Accorsi et al., 2014; Börger et al., 1999; Rash & Aguirre-Camacho, 2012; Rukmani et al., 2016). Several factors can cause variability in HR, and can be quantified through HRV analysis, a technique that allows obtaining non-invasively health indicators. HRV can provide information on the regulatory role of the autonomic activity (relaxation–activation states). Evidence indicates that HRV seems to be sensitive to MT (Castro-Sanchez et al., 2010; Giles et al., 2013; King et al., 2010; Milnes & Moran, 2007; Pickar & Bolton, 2012).
Our results are in accordance with the literature, which states that some psychiatric disorders with alteration in the executive functions, such as ADHD, have been associated with a reduction in baseline HRV, showing an autonomic dysregulation with a decreased baseline vagal tone (Alvares et al., 2016; Rash & Aguirre-Camacho, 2012; Rukmani et al., 2016). Some manipulative medicine techniques have been postulated to affect the ANS, including stimulatory and inhibitory effects without reaching a clear consensus. Our results are according to the outcomes of some publications such as Giles et al., Bayo-Tallón et al., or Cutler et al. They suggested that an increase in parasympathetic activity and a decrease in the magnitude of some vital signs were observed after the application of some techniques of MT. Giles et al. concluded that upper cervical spine manipulation and suboccipital decompression may affect HRV measures in healthy individuals, with increases in the Standard deviation from normal-to-normal (NN) intervals (SDNN) in heartbeats and HF components and a decrease in the LF/HF ratio (Giles et al., 2013). Milnes and Moran investigated the physiological effects of the cranial manipulation technique on healthy individuals without reaching physiological changes in the autonomic measures (Milnes & Moran, 2007). Budgell and Polus studied the effects of thoracic manipulation on HRV and observed short-term changes in HRV by identifying significant increases in the LF component and LF/HF ratio and decreases in the HF component (Budgell & Polus, 2006). Bayo-Tallón et al. (2019) concluded that a single intervention of a cranial therapy program induced a state of relaxation plausible based on the modifications in variables linked to parasympathetic activity and decreases in some vital signs, with a persistence of 3 weeks. Other investigations concluded that the effects produced by different MT applications were compatible with a decrease in the magnitude of some vital signs (blood pressure, heart and respiratory rate), a decrease in the muscle tone, and an increase in HRV (Castro-Sanchez et al., 2010; Cutler et al., 2005; Giles et al., 2013; Milnes & Moran, 2007).
Each of the MT techniques studied was based on the anatomo-physiological relationships of the VN and had a direct or indirect influence on the VN pathways after passing through the jugular foramen, so the proposed MT program could have an effect on vagal functions, because some psychiatric disorders with alteration in the executive functions, such as ADHD, have been associated with a reduction in baseline HRV.
The MT program showed effectiveness on the hyperactivity index and on HRV (which represents a marker of autonomic nervous function activity, self-regulation, and psychiatric illness); in addition, it did not show adverse effects. The methodological design was feasible, which confirmed the translation of the design to a sample of children with ADHD, improving the following limitations.
More exhaustive investigations are needed to generalize the results due to some limitations. Because this was a pilot study, its design was non-masked, with a small sample and for a short period of time. This pilot study was planned to design a randomized controlled trial and therefore may increase the likelihood of success. It was considered to be in Phase II because it allows to evaluate the consistency of the design, provides evidence on the feasibility, and shows the clinical efficacy and the safety of the proposed MT program in ADHD children. When controlling for the confounding factors, some children’s appointments were changed to another day in the same week because they did not meet the criteria mentioned above. Ideally, in the present study, there should have been follow-ups in between 1 and 36 weeks, to track the 1 week effect and to know how long that effect was sustained for, and when the effect began to wear off or when it disappeared. Finally, we recommend that further investigations include other possible psychopathological manifestations which may occur in the presence of ADHD (Baeza-Velasco et al., 2018). Only one neuropsychological variable was measured (hyperactivity index), so in future research studies, other physiological, neurophysiological, and neuropsychological variables might be included. We also recommend to make monthly follow-ups to refine the appropriate treatment cadence and to explore the effects of MT programs in the different presentations of ADHD. It would also be interesting to study the interrelation among neuropsychological and neurophysiological variables to determine whether neurovegetative changes may have an influence on behavior.
Conclusion
This study provides preliminary evidence on the feasibility of the design and shows the clinical efficacy and safety of the proposed MT program. It is the pilot approximation of a higher quality randomized controlled trial, including a larger sample, improving design’s reliability, including other neurophysiologic and neuropsychological variables, and considering an appropriate handling of confounding factors.
Our results showed that the MT program reduced the hyperactivity index 1 week after the program, although this improvement did not persist 36 weeks after.
Regarding baseline vagal tone, our results showed that ADHD children presented a reduction in baseline HRV with a predominance of basal sympathetic activity, reflecting a worse cardiac vagal control and an underlying deficiency in self-regulation. The neurophysiological effects of the MT program induced a state of relaxation after each intervention, based on the increases in RMSSD and HF, and decreases in LF and LF/HF ratio, and these effects persisted for up to 36 weeks. The predominance of the parasympathetic activity throughout the process may explain the state of relaxation after the interventions, the better cardiac vagal control and the better self-regulation of the group that received the MT program.
These findings support the theory that the proposed MT program may exert effects on vagal functions because the applied techniques had a direct or indirect influence on the VN pathways. Our findings could have an impact on improving health care of children with ADHD because MT, added to the multimodal treatment, is an economic technique that may improve the symptomatology of ADHD.
Footnotes
Acknowledgements
We acknowledge the collaboration of people and institutions in this project. We express our thanks to Escuelas Universitarias Gimbernat (Universitat Autònoma de Barcelona, UAB), both director and research team; to the head of the mental health service of the Hospital Universitario Parc Taulí (Universitat Autònoma de Barcelona, UAB); and to the managers of the public primary health center of Serraparera (Cerdanyola del Vallès).
Declaration of Conflicting Interests
The author(s) declared no potential conflicts of interest with respect to the research, authorship, and/or publication of this article.
Funding
The author(s) received no financial support for the research, authorship, and/or publication of this article.