
Abstract
This study is designed with the data of Interbrand for ranking top 100 global brands. In this study, the linkage between brand values and financial performance was estimated using different performance measures that include both stock market and operating performance using Fuzzy Set Qualitative Comparative Analysis (fsQCA) technique. The study investigates the effect of brand value on profitability and shareholder. It is observed that the firms that have superior operating performance result in greater brand valuation. Performance of firms measured through profitability is found to be a significant factor in brand valuation. Brand valuation is also found to be significant determinant of profitability. Thus, higher brand quality improves the likelihood of repurchases and in turn improved cash flows. Firms with high agency conflicts tend to have lower brand value. Higher market valuation positively impacts brand valuation in the context of lower leverage and agency costs. The linkage of brand value to firm performance is the justification for marketer’s investments toward branding initiatives as a mechanism that creates value. This study is the first of its kind to examine the impact of agency costs on brand value using fsQCA technique to understand valuation impact of brands. To measure the effect of branding and marketing initiatives of the firms on financial performance, this study integrated both econometric and financial modeling.
Introduction
Long term investments in marketing activities like advertising, customer services, new product development, new channel development, marketing research initiatives are considered as value creating activities for a firm. Investments in brand are strategic decisions aimed at wealth creation for firms. The efficient market hypothesis (EMH) highlights the importance of the reflection of value of firms in capital market (Kirk et al., 2013). The basic determinant of stock price is the current and future perception of investors about the earning potential of assets which are both tangible and intangible in nature. Brand value is a classic example of intangible asset for a firm as reflected by the market value of a firm (Bharadwaj et al., 2011). Market valuation of firms signify investors’ perception with respect to the earning potential of firms. Brand investments ought to result in the creation of both brand value and market value (Barth et al., 1998). Investments in brands must lead to payoffs in terms of shareholder wealth maximization (Yeung & Ramasamy, 2008). This outcome provides scope for marketing managers to emphasize on brand investments. Brand value is viewed as a significant intangible corporate asset. A survey by Fortune magazine based on top 3,500 firms in US observed that approximately 72% of the firm’s market value is due to the intangible assets and about 40% to 75% of the firm’s intangible assets is attributed to brands (Yeung & Ramasamy, 2008). The economic value attributed to the brand should lead to enhanced wealth creation for shareholders (Barth et al., 1998). Firms with strong brands are able to reap higher profit margins on account of premium pricing for customers. Strong brands on account of decreasing costs and increased profitability result in value creation for shareholder (Fischer & Himme, 2017).
The significance of brand investments in terms of strategic implications can be analyzed by comparing the financial performance of firms with highly valued branded products vis-a-vis firms with generic products. From an investor’s perspective, investments in brands can be viewed as an alternate investment option which leads to value creation for stockholders in the market (Joshi & Hanssens, 2010). The linkage of brand value to profit generation is a test to examine the ability of marketing initiatives to enhance profitability. In the long run, brand investments as intangible assets must generate adequate returns to emerge as a viable net present value (NPV) positive investment avenue.
The modern marketing managers face the challenge of quantifying returns to marketing activities in financial terms (Mizik & Jacobson, 2008). The benefits of intangible assets are not accurately depicted in accounting valuation of firm assets (Srivastava et al., 1998). Different brand initiatives may generate different financial returns (Pauwels et al., 2004). Many studies have attempted to link brand asset measure to stock market performance (Aaker & Jacobson, 1994, 2001; Barth et al., 1998). Research studies on the influence of marketing activities on value creation have examined the linkage with stock returns (Bharadwaj et al., 2011; Joshi & Hanssens, 2010) and market capitalization (Barth et al., 1998). Malshe and Agarwal (2015) document positive linkage between brand value and market capitalization. The major determinants of brand value are stock market returns, size measured by market share, discretionary spending such as advertisement, and profitability measures such as operating margin (Barth et al., 1998).
Motivation for the Study
According to the efficient market hypothesis, the perceived earning capability of a firm’s assets are reflected by its stock price (Kumar et al., 2021). In financial architecture, the assets of firms can be segregated as tangible, and intangible assets. Brand value is an integral component of assets which are intangible in nature. The present study focusses on the role of intangible assets such as brand value on value creation for firms in capital market. The study explores broad research questions like whether strong brands with high brand value generate greater profitability? What is the linkage between brand value and profitability? Do certain brands create more market value than others in the stock market? The paper examines the linkage between brand valuation and financial performance of a firm characterized by different accounting and market related performance variables. We investigate the linkage brand value and financial performance of firms using the fuzzy set qualitative comparative analysis (fsQCA) technique. The findings of this study highlight the significance of strategic initiatives of marketing managers in enhancing brand value of firms which leads to value creation for firms. The study has strategic implications for policy makers to understand the role of brand investments as a value enhancing marketing activity for firms in terms of profit potential.
Brands have become a distinctive differentiator for firms. Research studies in the past have established the superior financial and market performance of firms with well-known branded in comparison with firms with generic products. Hence, it is important to examine if brand value contributes toward improved firm performance. Firms with high brand value are characterized by higher revenues, stable earnings, and capital market performance. Firms with premium brand value are also blue-chip large market cap firms with wide share ownership distribution. Such firms are covered extensively by the analysts in the stock market. For example, General Electric with strong brands has over 5 million shareholders. Brand management through variety of marketing initiatives plays a vital role in improving firm performance. Brand value is a major contributor to firm’s performance in terms of shareholder wealth creation. Big global brands such as BMW and Ford are able to charge a premium price for their vehicles compared to other manufacturers. The price premium represented a benefit to firm’s stockholders. Firms derive higher profitability through the competitive advantage gained by their strong brand value (Aaker, 1991). According to Krasnikov et al. (2009), the branding “increases cash flow of firms, Tobin Q, return on assets and stock returns.” A study by Yeung and Ramasamy (2008) suggests that the stock prices of a firm increase consequent to the increase in its brand value. Thus, brand value is a significant contributor to firm performance. We reexamine this proposition in the paper. We have also examined the impact of brand value on market capitalization and financial leverage. In addition, we have also investigated the antecedents of brand value and firm performance. The impact of brand value on firm performance has strategic implications for stakeholders such as managers, investors, and marketing research.
Marketing Events and Stock Market Reaction
The events related to marketing that influence the brand value can be of positive or negative in nature. Broadly, the new product announcement events would boost the image of the brand. On Sep 12, 2018, Apple Inc. announced the launch of its new models of smartphone namely the iPhone XS, the iPhone XS Max, and its Apple Watch Series 4 (Stevens, 2018). Similarly, a well-known ingredient brand, Intel launched Intel® Core™ i7 processor Extreme Edition on Computex 2016 in Taipei, Taiwan, on May 30, 2016, which would positively enhance the brand value of Intel (Punjabi, 2016). In automobile industry, the new product announcements are major marketing events that would help in building the brand value. For example, Toyota introduced new products such as Reach Truck, 80-Volt Electric and a High-Capacity IC forklift on Sep 28, 2015, for its industrial customers (Toyota forklift, 2016). In consumer automobiles sector, the German automaker, BMW announced the launch of New 8 series on May 11, 2017, with the intent of refreshing product portfolio and also refocus its core luxury segment (Krok, 2017). Similarly, another German luxury car manufacturer, Mercedes, announced the launch of its new electric car EQC 400 SUV on Sep 4, 2018. This product launch would help enhance its image as a firm promoting product innovation in the target market. Furthermore, a major consumer products firm and also a soft drink giant, Coca Cola announced its acquisition of a popular coffee retail brand, Costa, on August 31, 2018, and expanded its product line directly into retail sector and also in hot beverages segment.
There are also some marketing decisions of a firm that would negatively affect the brand value of a firm. For example, in October 2017, Nissan announced that it will recall the new passenger cars sold for the past 3 years in Japan as it discovered that these vehicles were not inspected by its authorized technicians (Shiraki & Tajitsu, 2017). In the short run, this event can be perceived as a big revenue loss to the firm, however in the long run, it may also be perceived as a good move by the firm. Another marketing decision that pertains to price cuts in the product lines would also possibly hamper a premium priced product. For example, Google has announced a significant price cut of its Pixel 2 brand of smart phone on Nov 16, 2018 (Carey, 2018). As this product was perceived to be a premium one, the price cut may negatively impact the brand value of Google. Sometimes, controversial advertisement campaigns may also potentially affect the brand value. For example, soft drink giant, Pepsi launched its new advertisement campaign on April 4, 2017, starring a popular model, and television personality in the US, Kendall Jenner, and this advertisement campaign created huge controversy over social media (Victor, 2017).
Review of Literature
Traditional theories on brand value advocate positive association between brand value and firm performance. The four dimensions of brand equity namely “awareness, associations, perceived quality, and brand loyalty are determinants of business performance” (Aaker, 1991). The studies measuring brand value performance can be categorized into studies that rely on primary data collection through surveys and studies using the accounting and firm value measures and proxy measures that indicate brand value. Studies of Joachimsthaler and Aaker (1997), Kerin and Sethuraman (1998) and Kim et al. (2003) examine the linkage between brand value and firm performance. Yeung and Ramasamy (2008) also establish the linkage between brand value and firm performance.
Firms with strong brands exhibited superior stock market performance than firms with weak brands in the long run (Siegel, 2005). The shareholder returns increase on the basis of increase in the marketing initiatives (Srivastava et al., 1998). Empirical research has suggested that brand value is an intangible asset which is a source of value creation for firms (Barth et al., 1998; Hupp & Powaga, 2004; Kerin & Sethuraman, 1998; Lev, 2001; Mizik & Jacobson, 2008; Shankar et al., 2008; Siegel, 2005; Sjödin, 2007; Treynor, 1999). Marketing actions can lead to added value for the brand (Keller, 1997). The major brand value assets which are the sources for value creation in a firm are “brand loyalty, brand name awareness, brand quality, brand associations, distribution channels, trademarks, or copyrights” (Aaker, 1992). Brand value in terms of brand energy relates the firm to be innovative and dynamic in nature (Mizik & Jacobson, 2008).
Measurement of brand valuation is an important step in merger and acquisition process (Bahadir et al., 2008). Brand value measurements can be categorized based on customer mindsets, product market outcomes, and financial market outcomes (Ailawadi et al., 2003). Research studies have examined the linkage between brand value changes and stock returns (Barth et al., 1998; Kapareliotis & Panopoulos, 2010; Wang et al., 2009).
The efficient market hypothesis (Fama, 1970, 1991) states that, “a firm’s stock price always reflects all the information about a firm currently available to the investors.” This means that the price of the stock is dependent on how well investor perceives the firm’s tangible and intangible assets could earn. Brand equity, patents and trademark, research, and development initiatives are all investments in intangible assets (Simon & Sullivan, 1993). Marketing events have an impact on the stock price of a firm.
Researchers have attempted to examine the specific components of brand value which influences firm’s stock market valuation. Fornell et al. (2006) find that customer satisfaction is an important determinant of a firm’s valuation. Perceived quality is a factor influencing firm performance (Aaker & Jacobson, 1994). Brand attitude enhances stock performance of firms (Aaker & Jacobson, 2001). Higher the advertising expenditure, greater is the intangible value created for firms (Sahay & Pillai, 2009). Initiatives like new product introductions are positively related to firm valuation (Pauwels et al., 2004). Brand orientation and firm profitability have a positive association (Gromark & Melin, 2011). Mizik and Jacobson (2008) found that, “there exists a time lagged impact of brand differentiation on stock returns.” Brand equity is the “net present value of future earnings of a brand” (Simon & Sullivan, 1993). The association of brand value and stock prices is significant for firms producing consumer products, but not as significant for firms into industrial products (Kirk et al., 2013). Brand valuation estimates are significantly associated with share prices and are moderated by firm types. There is a positive linkage between trademarks and firm value (Greenhalgh & Rogers, 2007; Sandner & Block, 2011). Branding in firms that are into industrial products is an important factor for corporate success (Shipley & Howard, 1993). Well known branded firms are able to create more value for stockholders on account of increased profitability attributed to brand value and decreased costs (Yoo & Donthu, 2001; Yovovich, 1988).
The assumption of stock price model is that stock prices reflect not just the information content of earnings and book values, but also reflects other information which is released to the stock market (Barth et al., 2001; Chen & Wang, 2004; Z. J. Lin & Chen, 2005; Ohlson & Shroff, 1992). Brand equity is viewed as “the capitalized value of the profits which results from the association of a brand’s name with specific products and services” (Simon & Sullivan, 1993). Thus, it can be interpreted that any change in investor perception toward the brand value would result in either a positive or negative impact on stock price. Positive marketing initiatives by a firm may be positively perceived by investors which might result in increased stock price of the firm. According to semi strong efficient markets/rational expectation hypothesis of Brown and Warner (1985), on the basis of information available publicly the stock price of a firm is decided in the market.
Interbrand’s measure for brand valuation has been widely used by several previous research studies (Barth et al., 1998; Fehle et al., 2008; Kerin & Sethuraman, 1998; Madden et al., 2006). A study by Tajvidi et al. (2021) proposes a model for brand value co-creation in social commerce and suggest that brand interactivity in social commerce positively affects social support. This study observes that brand value can be created by social support and relationship quality. A research study by W. L. Lin et al. (2021) investigates the moderating roles of marketing capability and R&D intensity in the influence of green innovation strategy (GIS) on brand value. The findings of this study suggest a positive link between GIS and brand value. This study points that marketing capability and R&D intensity positively moderate the GIS-brand value link. Intellectual, behavioral, affective, and sensory experiences positively influence brand authenticity which in turn have substantial positive impacts on brand love (Safeer et al., 2021). The study by Safeer et al. (2021) investigated the impacts of perceived brand authenticity dimensions on brand love to predict Generation Y’s behavior from the Asian context and documents that perceived brand authenticity dimensions significantly impacted brand love, which positively affected Asian millennials’ behavioral outcomes. Safeer et al. (2022) find that the perceived brand localness and perceived brand globalness positively influenced consumers’ perceptions of brand authenticity which have a significant impact on consumers’ brand attitudes toward both local and global brands in Asian markets.
Hypothesis Development
Stock prices are dependent on expectation of the investor in terms of their cash flows in the future. Classical valuation models suggest that the value of an asset is determined by the present value of future cash flows. Brand quality is a determinant of future cash flows. The resultant repurchases lead to increased cash flows for a firm. Customers are willing to pay higher premium prices in lieu of introduction of higher quality brands (Dubé et al., 2008; Sullivan, 1998). As a result of premium prices, cash flows of firms tend to be higher. A strong brand name contributes to benefits such as greater loyalty from customers, larger margins, more elastic consumer response to price decreases. The net effect of such benefits for a branded product provides a firm with a higher level of operating earnings over time compared to an unbranded product (Barth et al., 1998; Keller, 1997). This study hypothesizes that there exists a link between brand value and firm performance. Investments in brand value ought to lead into improved operating performance (Esch et al., 2006). In summary, it can be stated that strong theory and empirical evidence suggest that brand value improves cash flow through higher revenues and lower costs.
H1: Higher brand values lead to higher firm performance in terms of higher operating returns for the firms. A stronger brand generates more cash flow and thereby directly increases financial resources and thereby increases operating performance in terms of profitability.
Many studies show positive relationship between brand value and market capitalization of firms (Aaker & Jacobson, 2001; Barth et al., 1998; Malshe & Agarwal, 2015). Advertising expenditures and brand are value relevant and contribute to the market capitalization of firm (Srinivasan & Hanssens, 2009). Chehab et al. (2016) observes positive linkage between brand values and market capitalization.
H2: Higher brand value leads to superior financial performance in terms of higher market capitalization
Brands can be a signal for the credit worthiness of firm. Discretionary expenditures like advertising expenditures can increase brand equity which in turn impacts financial leverage and finally elevates the level of financial resources (Fischer & Himme, 2017). From financial perspective, firms with relatively more tangible assets like property, plant, and equipment issue more debt as these assets serve as collateral (Titman & Wessels, 1988). Firms with high intensity of intangible assets tend to have lower leverage measured by debt equity ratios.
H3: There exists a negative association between brand value and financial leverage
The primary objective of marketers is to maximize sales impact by focusing on customers, products and distributors (Fischer & Himme, 2017). When the quality of brand is enhanced, its initial sales and repeated sales increases. Furthermore, the brand quality improves brand credibility and reduces the perceived risk and the costs associated with searching for information (Erdem et al., 2008). Brand value is positively related to sales growth of the firm (Barth et al., 1998).
H4: Firms with higher sales growth potential tends to have higher brand value
The study hypothesizes that brand value is positively influenced by R&D intensity and consequently affect wealth creation of the shareholders. Firm specific factors such as discretionary expenditures including R&D and advertising tends to have positive impact on firm value (Chan et al., 2001; Erickson & Jacobson, 1992; Joshi & Hanssens, 2010).
H5: R&D Investments have a positive impact on brand value and firm performance
Prior research has documented a linkage between size (proxied by sales) and brand value (Gabay et al., 2009; Kim et al., 2003). Brands with high values tend to have high market shares and have competitive advantage in terms of economy of scales. Bigger firms have the strength to launch high quality brands. .
H6: There exists a strong linkage between size of the firm and brand value
Our study investigates the impact of agency costs across firms on brand investment. The study by Kumar et al. (2021) establishes the negative linkage between agency costs and brand value. The measures of profitability are captured by proxies like Return on Assets (ROA), Return on Equity (ROE), Return on Invested Capital (ROIC), and Net Profit Margin (NPM). Agency costs are measured by the variable of sales and administration expenses to total revenues.
Data Sources
The brand data was sourced from Interbrand and financial data from Thomson Reuters Eikon database. Interbrand publishes a list of top 100 global brands in terms of financial value from the year 1992. This study includes the 5-year period of 2015 to 2019. Five new firms were added to the list in the year 2015. One new firm was added in year 2016. Overall, the list remained stable during the period 2015 to 2019 and hence the study assumed to be stable for 2020 to 2021 period as well. Academic research considers Interbrand data to be highly reliable (Chehab et al., 2016; Johansson et al., 2012). Firms are included in the Interbrand list based on certain selection criteria. One of the criteria for inclusion is that at least 30% of brand revenues for the listed brand must be accounted from overseas revenues. The listed brand must have significant presence in the developed markets of North America, Europe, and other emerging markets in Asia. Only brands with long term economic profitability are included in the list. The three major pillars of financial evaluation criteria are the financial performance analysis, examination of the role of brands in purchase decisions and competitive strength of the brands. Private non trading firms are excluded from the study.
Methodology
The framework for configurational model used for this study is as follows. The first model takes brand value of the firm as the outcome of the various initiatives toward brand development and it is determined through antecedents such as sales growth, leverage, value, stock market performance, agency cost, R&D intensity, and size of the firm. The second configurational model takes return on assets as the outcome and the antecedents are brand value of the firm, sales growth, leverage, value, stock market performance, agency cost, R&D intensity, and size of the firm. Both the frameworks are shown in Figure 1 as a pictorial representation.
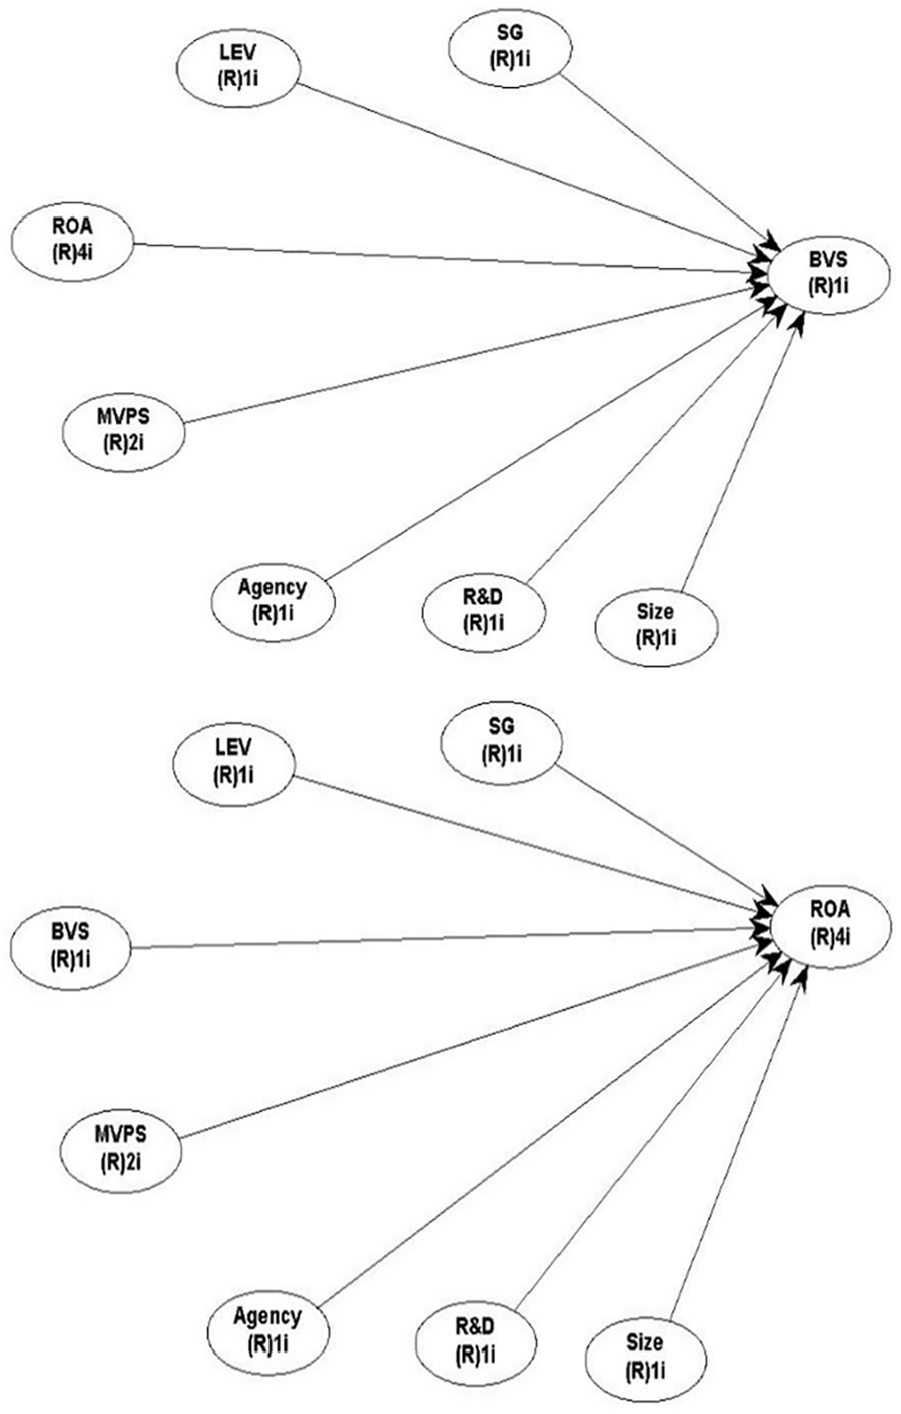
Configurational model with brand value (BVS) and return on assets (ROA) as outcome.
For this study, the Fuzzy Set Qualitative Comparative Analysis (fsQCA) is applied in order to assess the configurational impact of these antecedents on the outcomes. The methodology involves transformation of variables into sets, followed by the analysis of the grouping of causal sets which is in fact a subset of the outcome set. Regression method is based on symmetric variable analysis (SVH) which tests two directional hypotheses of high versus low scores of independent variables association with high versus low scores of dependent variables (Woodside, 2019a). This often ignores contrarian cases. For example, in a typical regression analysis with brand value as dependent variable (Y) and size of the firm (X) as independent variable. Let us assume that the estimated regression result shows that the size is positive and significantly related to brand value. This means the bigger size firms are associated with higher brand value as the main dominating effect. However, this on the other hand ignores all other contrarian cases which are also useful. There must be some firms which are small with high brand value or some big firm with low brand value. The presence of these contrarian cases results in lower correlation between dependent and independent variables. Identifying these cases with high scores on outcome conditions using asymmetric tests is important to understand the whole story the researcher wants to uncover. Case identification hypothesis (CIH) takes all the contrarian cases.

Most researchers formulate theory by focusing on creating case identification hypothesis (CIH) to describe, explain and then empirically test by taking Symmetric Variable Hypothesis (SVH) ignoring the contrarian cases. In the process, only dominant impact get captured and often ignores other important causal relationships leading to shallow data analysis and frequently inaccurate contributions to the theory (Woodside, 2016). Asymmetric, configurational-focused case–outcome theory construction provides accurate point or interval estimates of case-outcomes (Woodside, 2019b). The asymmetric modeling enables researchers to better match data analytics with their theories than the current pervasive theory–analysis mismatch. The majority of articles in the leading journals on general management, marketing, finance, and the additional management sub-disciplines are examples of the mismatch (Woodside, 2017).
The technique of fsQCA presents multiple solutions which are complex and allows to deal with causal complexities (Ragin, 2008). This technique allows evaluation of cases as configurations of conditions, rather than the net effect of each variable on outcomes. It also enables the researcher to conduct context-specific assessments with the possibility of multiple causal relationships that can be linked to a particular outcome (Paykani et al., 2018).
The first step of this analysis is to check for highly correlated variables which are similar in nature. As shown in Figure 1, value of the firm represented by two variables, that is, book value per share and market value per share (MVPS), both are highly correlated (0.95). So, the study has used market value per share for the model to represent the stock market performance. Sales growth (SG) and net profit margin (NPM) are highly correlated (0.99) and hence NPM was removed from the model. Sales growth (SG) is also highly correlated with agency costs (0.99), hence both the variables were not included at the same time.
Performance of the firm as well as brand value are both taken as the outcome of the model. To assess the performance of a firm, return on assets (ROA) is taken as a proxy for the outcome. To determine the brand value, brand value per share is taken as a proxy for the outcome. The list of outcomes and antecedents of our configurational model is presented in Table 1. Brand value (BVS) and Return on Assets (ROA) are outcomes depended on various antecedents. The complete list with definition is presented in the Table 1.
List of Outcomes and Antecedents.

Analysis and Results
The fuzzy set qualitative comparative analysis (fsQCA) is an analysis of set relations. In this technique, the variables are transformed into sets, and then compares the combination of causal sets that constitute as a subset of the outcome set. In other words, this method explains the conditions that lead to a given outcome. This method is based on configurational modeling which is based on the asymmetrical relationships. This method explores multiple paths to reach a particular outcome and focuses on combined impact of all the antecedents. The antecedents are like the independent variables used in regression. The fsQCA uses both qualitative and quantitative assessments and computes the degree in which a case belongs to a set (Pappas & Woodside, 2021). The qualitative assessments focus on the logic that are rich in contextual information whereas quantitative assessment deals with large numbers of cases that can be generalized (Ragin, 1987). Firms with missing data were not considered for the study to avoid misinterpretation of the information since fsQCA requires an in-depth examination of each case.
Converting Variables Into Sets: Calibration
There are two types of sets, that is, crisp and fuzzy. The crisp sets are those where membership is either on or off. For example, whether the firms are spending on advertisement or not. The firms are well defined in a crisp set. On the other hand, fuzzy set membership is explained in terms of the degree of membership, for example firms spending high on advertisement, low on advertisement, or not spending on advertisement. The firms can be clubbed into three groups based on their spending on advertisement intensity. To do so, a cutoff point needs to be identified to qualify a firm as member of these three groups. The cutoff point for membership, that is, full membership or no full membership is defined by the researcher based on theory or experience. For example, one can choose a certain percentile (80) and above to be qualified as full member (firms with high advertisement intensity) and a certain percentile (5) and below as non-member based on their advertisement intensity. Firms with less than 80 percentile and more than 5 percentiles are neither in as member nor out. This is known as crossover point which represents neither in nor out in fuzzy set.
To convert any variable into set, a calibration process is required where the researcher defines the membership in the set based on the cases understudy. For this study, fuzzy set is calibrated from the variables based on three degrees of membership. The three-value scheme uses the numerical values 1.0, 0.5, and 0.0 to indicate “fully in,”“neither in nor out,” and “fully out,” respectively (Ragin, 2018). The fuzzy set membership scores range between 1 and 0 help in indicating whether the cases fall in the above-mentioned groups.
After deciding on the three degrees of membership, the data is transformed into fuzzy sets through calibration. There are different ways calibrations can be applied for creating fuzzy sets. The study uses a direct method of calibration by specifying three qualitative anchors, that is, score of 95 percentiles for full membership, the threshold for full non-membership is 5 percentiles fuzzy score, and the crossover point score is 50 percentiles. These three cutoffs are applied to convert the raw data into fuzzy membership scores. The threshold values (95, 50, and 5 percentile) for the variables are presented in Table 2. For example, a firm with brand value of 11.21 and above has full membership and a value of 8.50 and lower is a non-member. Any number above 8.50 to 11.21 is neither in nor out, which means it is in the crossover point.
Threshold values for calibration.
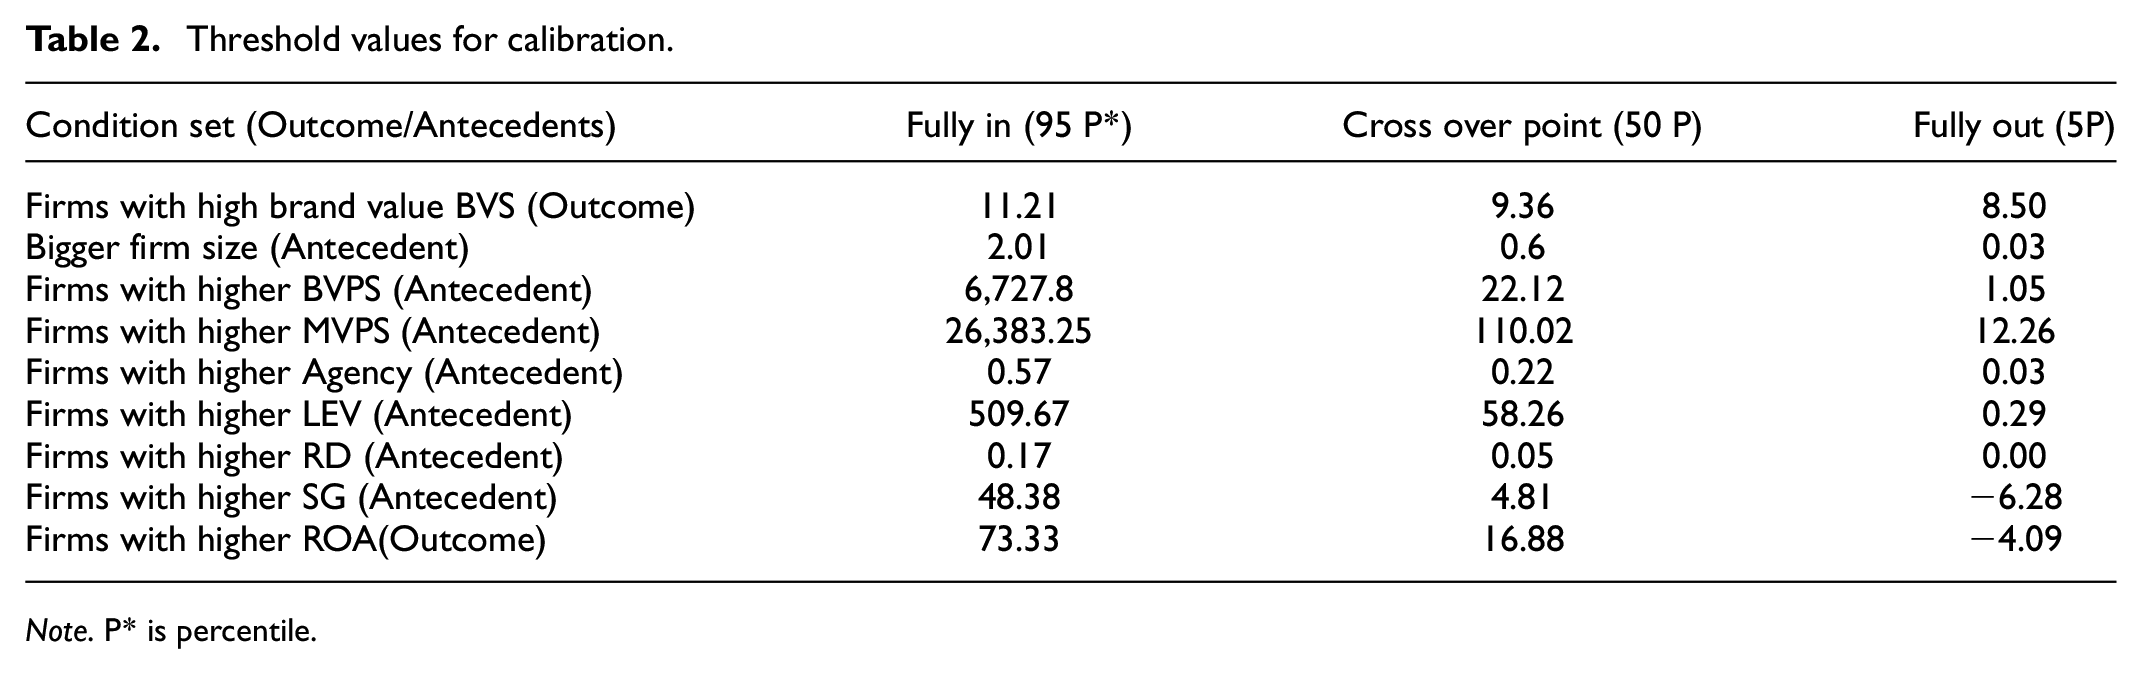
Note. P* is percentile.
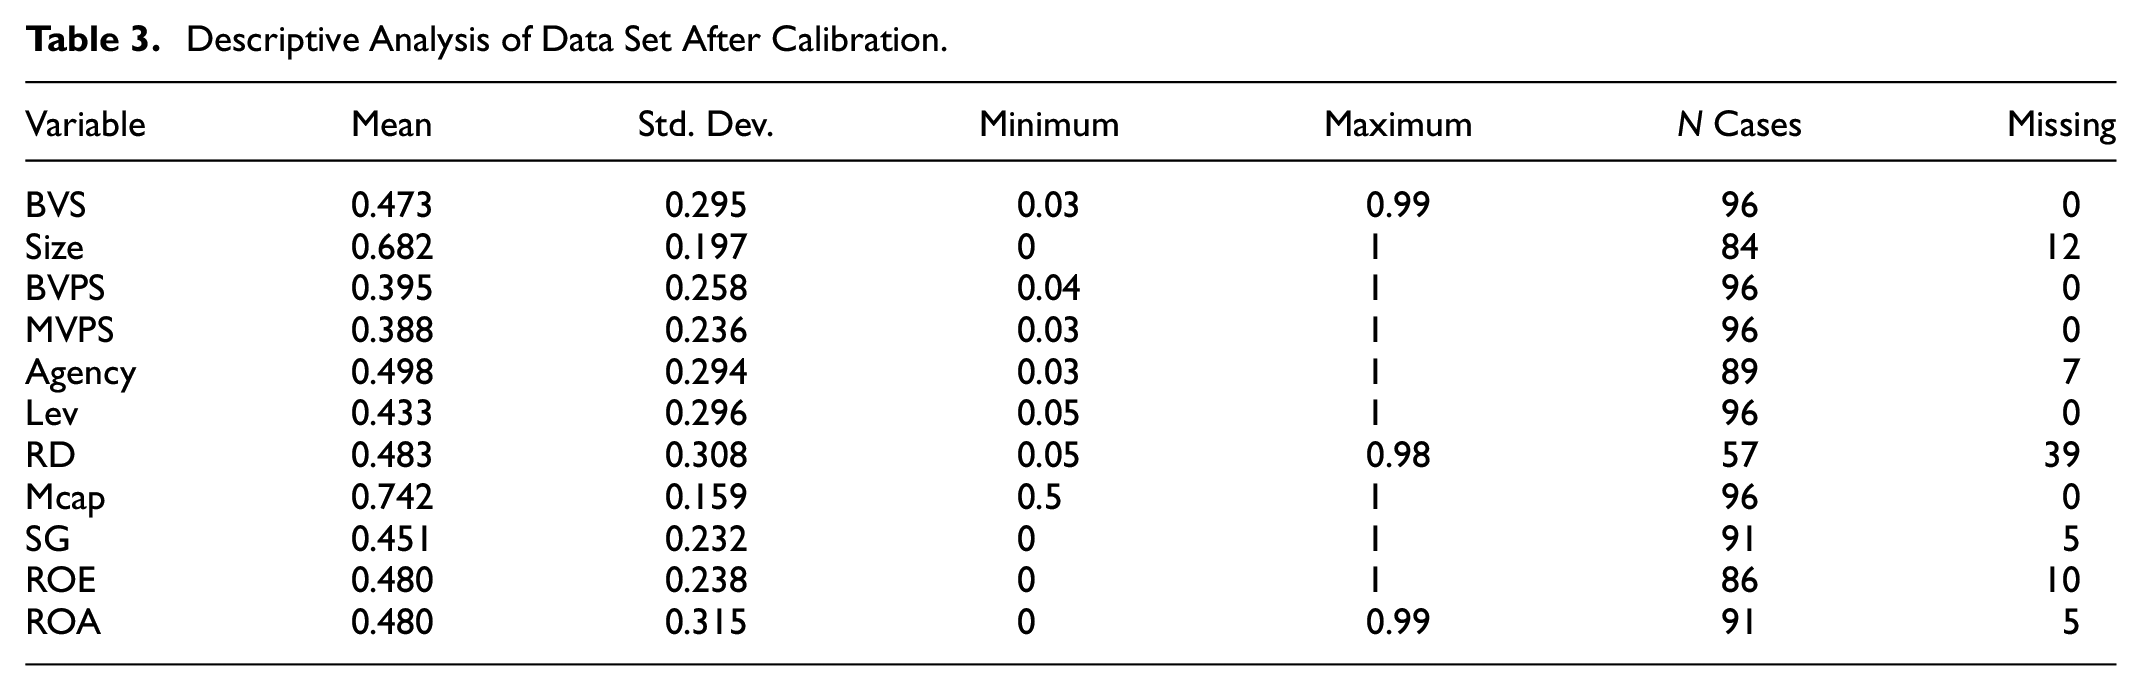
The descriptive statistics is presented in Table 3 below after calibration. The mean is found to be close to 0.5 for most of the outcomes and antecedents after calibration. There are few missing values in some antecedents such as R&D, Size, and Agency cost.
Descriptive Analysis of Data Set After Calibration.
Necessary Condition Analysis
The analysis of necessary conditions verifies individual factors that may be the necessary condition for the outcome to occur by plotting a scatter plot. The scatter plot (XY) where X represents condition and Y represents outcome. If the area above the diagonal reference line is virtually empty in the scatter plot, then there is presence of necessary condition. This is computed from the total vertical distances of the deviant cases to the diagonal. If the threshold value is 0.9 and above, then it is concluded that the presence of X is necessary for the presence of Y. The necessary conditions are tested for both the configurational models with Brand value (BVS) and performance variable (ROA) as outcomes. None of the conditions qualify as necessary antecedents as the cutoff value to qualify is 0.9. Table 4 highlights the necessary sufficiency conditions estimation carried out using Tosmana software.
Necessary Condition Analysis.

Note. ~Represents the negative or negation condition of the study variable.
The highest conditions are highlighted in bold for both the models. None of the values were found to be necessary since all the values were less than 0.9.
Truth Table of Brand as Outcome
After checking necessary condition analysis, the next step is to find the truth table for both the models. Table 5 discusses the fsQCA results with the outcome as brand value (BVS) and all others as antecedent conditions. The calculations are based on Boolean algebra where * represents “and” and ∼ indicates “negative or negation condition of the study variable.” While performing truth table, it is required to set frequency cutoff, and consistency cutoff values. For this study, frequency cutoff is set as 1 and consistency cutoff is set as 0.8, which are set as default values in the fsQCA 3.0 software. These cutoff values can be changed if necessary. Truth table solution path to the outcome (Brand Value) has used Quine-McCluskey algorithm to derive various solutions. The results of fsQCA suggest that 11 sufficient and consistent causal solutions describe the conditions which lead to high brand value. The overall results have a solution coverage of 0.78 and consistency of 0.70. The result is sorted based on consistency value and presented in Table 5.
Truth Table for BVS = f (Size, MVPS, Agency, LeV, RD, SG, ROA).

Consistency in set theory indicates how closely a perfect subset relation can be approximated. It measures the degree to which a given combination of conditions agrees in displaying the outcome. On the other hand, set-theoretic coverage assesses the empirical relevance of the path of causal combination to the outcome. If there are several paths to the same outcome, then the coverage of causal combination is small (Ragin, 2008). An example of consistency and coverage is presented in Appendix 1 with causal conditions represented by X1 and X2 and the outcome represented by Y. For the simplicity only two causal conditions are taken for calculating consistency and coverage.
The truth table for Brand as outcome has 11 solutions using Quine-McCluskey algorithm. Out of these 11, based on consistency, the study has picked the top three solutions for interpretation. The first solution (Size*∼Agency*LeV*RD*SG*∼ROA) suggests that causal combination of bigger leveraged firms that spend on R&D with positive growth in sales and lower agency cost and low return on assets is associated with higher brand value. The second solution (Size*MVPS*∼Agency*∼LeV*RD*ROA) suggests that bigger firms with higher market value and higher R&D intensity and higher return of assets with lower agency cost and lower leverage is associated with higher brand value. The third solution (Size*MVPS*∼Agency*∼LeV*SG*ROA) suggests that bigger firms with higher market value, higher returns on assets, and higher growth in sales with lower agency and lower leverage causal combines for higher brand value.
Based on top three solutions presented in Table 5, one can interpret that bigger firms, lower agency costs, higher R&D intensity, and higher sales growth are important antecedents with causal conditions leading to the outcomes, that is, brand value. This interpretation is derived by dropping the antecedents which are positive in one solution and negative in another solution. It means it does not matter whether the antecedents are positive or negative.
Truth Table of Performance (ROA) as Outcome
The intermediate solution of truth table analysis using fsQCA suggests that there are nine sufficient and consistent causal conditions which lead to higher return on asset (ROA). The overall results have a solution coverage of 0.75 and consistency of 0.77. The result is sorted based on consistency value and presented in Table 6.
Truth Table With Outcome ROAC = f (BVS, Size, MVPS, Agency, LeV, RD, SG).

Each solution presented in Table 6 represents a path leading to higher financial performance through antecedents. Out of the nine solutions, based on higher consistency, the first three causal conditions leading to higher performance is discussed. Afterward a more generalized solution based on common solutions is also discussed. The first solution (∼BVS*∼MVPS*Agency*LeV*∼RD*∼SG) indicates that a causal condition of lower brand value, lower market value, lower R&D and lower growth with higher agency and leveraged firm is associated with higher returns. The second solution (BVS*Size*∼MVPS*Agency*RD) mentions that a higher brand value, higher size, higher R&D, higher agency with lower market valuation is associated with higher return on asset. The third solution (Size*∼MVPS*Agency*∼LeV*∼SG) indicates that a bigger firm with higher agency cost along with lower market valuation, low leverage, and lower growth is associated with higher performance. Based on these three solutions, Size of the firm and agency cost are consistently positively associated with performance. On the other hand, market value and growth are negatively associated with the performance.
Comparison With Systematic Analysis
At this point, it is important for the study to have a comparison with symmetric analysis using regression analysis. Same configuration is used for both the models to find the dominant effect if any between independent and dependent variables. The results are reported in Table 7. It is interesting to note that size of the firm and leverage are positive and significantly related in determining brand value of the firm. On the other hand, brand value contributes positively to the performance of the firm whereas leverage is negatively contributing to the performance of the firm. As a comparison to regression analysis, fuzzy set-based analysis provides multiple solutions, and paths to reach to the outcome.
Regression Analysis.

, **, and *** represents significant t-stats at 1%, 5%, and 10% level.
Predictive Validity of the Model
The next step of the FsQCA analysis is to test the models for predictive validity. Predictive validity shows how well the model predicts the dependent variable in additional samples (Woodside, 2014). Predictive validity is important because achieving only good model fit does not necessarily mean that the model offers good predictions (Pappas & Woodside, 2021). In order to verify the predictive validity of the fsQCA asymmetric model, the sample is randomly divided into two (Sub Sample-1 & 2) and fsQCA is performed to derive the solutions with the first set of sub-sample. Using the solutions of first sub-sample, the consistency and coverage is calculated using the second sub-sample as applied by Olya et al. (2018). The first sample generated four intermediate solutions as reported in Table 8 using truth table analysis. For each causal combination generated, the first truth table analysis is used the data from subsample-2 by re-calculating the consistency and coverage ratios. If the value of consistency is above 0.8 and the coverage is above 0.2, then it can be considered as having predictive validity. In the first configurational model, the outcome is brand value, and the predictive validity is shown in Table 8 and the bold values signify that the consistency is more than 0.8 and the coverage is more than 0.2 thus confirming the predictive validity of the model.
Predictive Validity With Sub-Sample 1&2 for the first configurational model.

For the second configurational model, where the outcome is Returns on Asset (ROA), the predictive validity is shown in Table 9. In this case as well, the predictive validity is established as all the consistency value of sub-sample-2 is above 0.8 and coverage is above 0.2 as provided in bold values in the Table 9.
Predictive Validity With Sub-Sample 1&2 for the second configurational model.
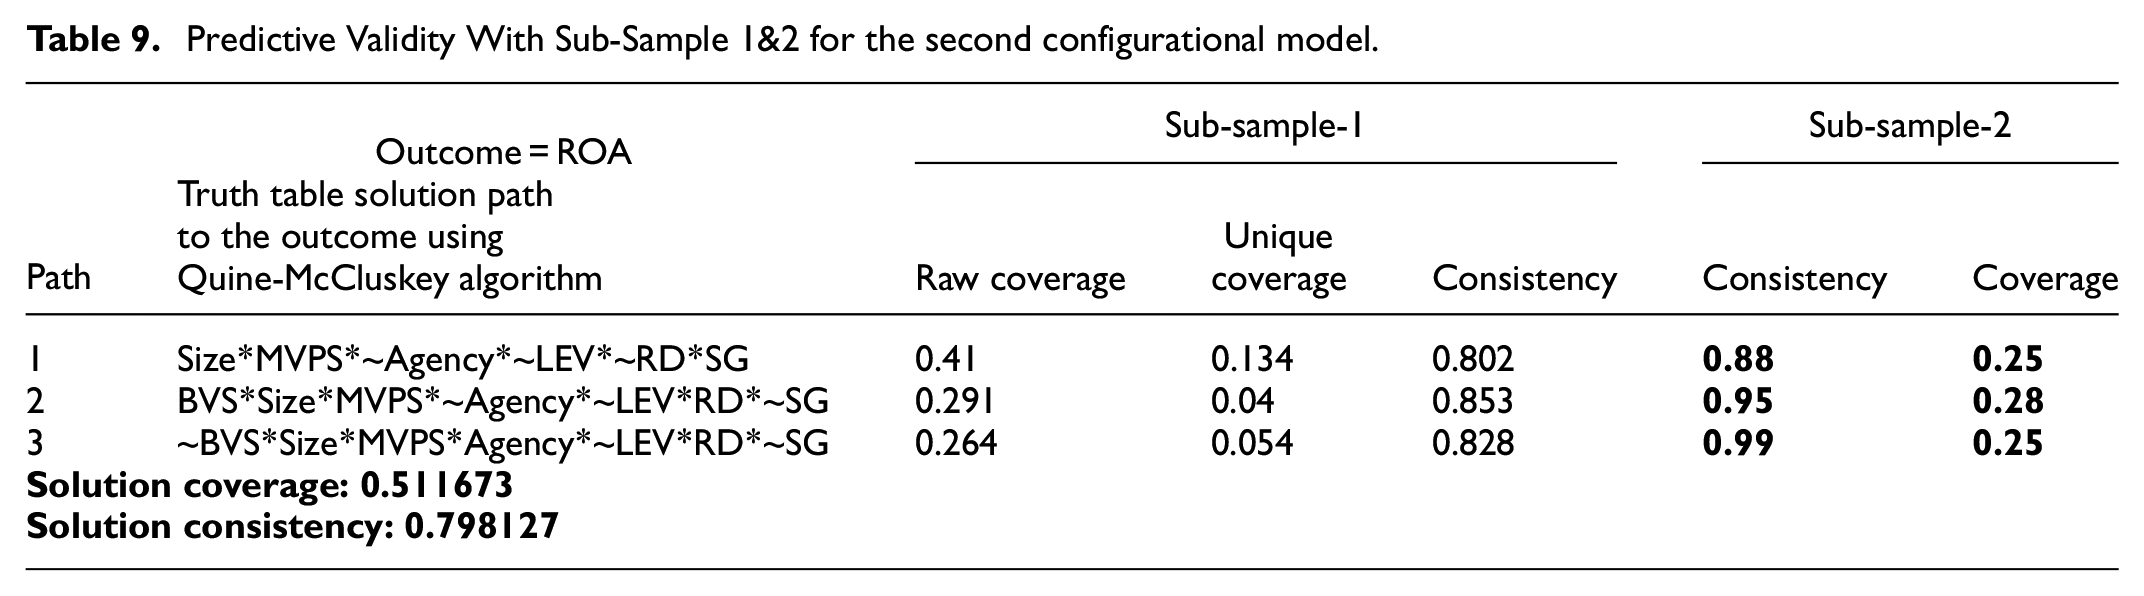
Based on the results as shown in Table 8 for Brand Value (BVS) and Table 9 for Returns on Asset (ROA) indicates predictive validities for both the configurational models. This also ensures that these models can offer good prediction as well. The solution coverage for the first model that is, Brand value (BVS) is around 62% whereas for the Returns on asset model is 51%. On the other hand, solution consistency of around 80% is for ROA model whereas it is 72% for the Brand value. This indicates that both the models are good for prediction with reasonable consistency and coverage.
Conclusion
The study has used fsQCA based modeling which is based on set theory principles and asymmetric relationship boolean algebra. This study uses two models with Brand value and Firm performance as outcome conditions with a combination of antecedents. Before proceeding with the fsQCA analysis and complex causal solutions, the study has performed necessary condition analysis to find that there are no antecedents that are a necessity for these two outcome conditions.
For the first configurational model with Brand value as outcome, the causal conditions required for antecedents such as bigger firms, lower agency cost, higher R&D intensity, and higher sales growth. For the second configurational model with performance of the firm represented by Returns on Asset as outcome, the causal conditions required for antecedents such as bigger size of the firm, higher agency costs, but lower market value, and lower growth. One striking feature of this study is the importance of size of the firm for both Brand value and Performance. Bigger sized firms take all the advantages of the market and scale economies that help them to not only perform better but also derive more brand value.
Theoretical Contributions
The study finds that bigger firms, lower agency costs, higher R&D intensity, and higher sales growth are important antecedents with causal conditions leading to the outcomes, that is, brand value. The study also documents the positive association of the variables size and agency costs with performance. It is interesting to note that performance of the firms is not guided by the brand value, but rather are guided by other antecedents. For brand value too, performance is not the only criteria, but a host of other antecedents are important such as size, higher R&D intensity, lower agency costs, and sales growth. This result could help the firms to focus on these four aspects for increasing brand value of their firm. Specifically, the bigger the size of the firm, the confidence, trust and loyalty of channels partners, and end consumers toward the brand get enhanced which further contributes to increasing brand value. For increasing the size, the firm can attempt in increasing its product portfolio and also enter into new markets. The firms can also try acquiring other firms that are in similar businesses. The R&D intensity also enhances the confidence of the customers as the firm will be able to bring in high quality products in the market and consequently enhances its brand image. To increase R&D intensity, the firms are required to focus on future technologies to explore opportunities which requires investments. Lowering agency costs improve the good relationships between the shareholders and the firm. The shareholders’ confidence in the firm due to lowered agency costs result in enhancement of the brand value. The firm should focus on reducing the conflicts and misunderstanding with the shareholders so that the agency costs are reduced. The sales growth increases the profitability of the firm which enhances the reputation of the firm amidst the shareholders which eventually enhances the brand value. The firm should emphasize on increasing its sales growth to improve its brand value.
Managerial Contributions
The study highlights the significance of brand value-based marketing strategies for improving financial performance of firms. Investments in brand are imperative for firm performance in terms of wealth creation (Barth et al., 1998; Bharadwaj et al., 2011; Fischer & Himme, 2017; Joshi & Hanssens, 2010). This study establishes the connection between typical finance domain variables and marketing domain variables. The focus of marketing –finance interface is based on the dynamic and interrelated marketing and financial variables which are synergistic in nature.
Brands constitute about 40% to 75% of a firm’s intangible assets. The economic value for brands is a major determinant for wealth creation of firms. Strongly branded firms like IBM which signifies universal signal of quality, offer premium priced products, and achieve higher profit margin. In other words, firm performance in terms of profitability is improved. By means of value addition in terms of decreasing costs, established branded firms should have superior firm performance which in turn creates more wealth for shareholders. This paper makes contribution to the literature with respect to linkage between brand value and firm performance.
From marketing perspective, linking brand value to firm performance in terms of profitability is like linking marketers’ efforts to firm performance. During an economic slowdown often, it is observed that the marketing expenses are the first casualty in the budget restructuring exercise. Firms often ignore the effect of marketing decisions on the value of a firm. Marketers must demonstrate how brand investments do pay off and improve firm performance in terms of returns for justifying their actions.
This study also combines econometric and financial modeling to find out the impact of brand value on financial performance. The impact of brand value on firm performance is of much relevance to managers, investors, and marketing research. A major challenge faced by marketers revolves around the question of how to measure the impact of their efforts on the success of a firm. This paper provides new evidence on the impact of brand value on profitability and shareholder value. This research work on the interface between finance and marketing provides evidence for the value relevance of marketing metrics.
The examination of the linkage between brand value and profitability is significant in the context of asset valuation for corporate restructuring exercises such as mergers, acquisitions, or divestitures (Keller, 1997). In other words, there is a financial motive for extracting information from the value of brand (Yeung & Ramasamy, 2008). Brand value creation should create market value for firms like any other capital investment decisions (Aaker, 1992). The linkage of brand value to profitability signifies linkage of marketer’s efforts to profitability. Marketers can justify their brand investment decisions if such activities generate adequate returns. If value creation is not possible through investment in brands, the resources could be employed elsewhere for value creation (Doyle, 2001).
Marketers believe that greater promotion of brands enhances value and improves profitability for firms. The results present useful insights into the role of brands in determining financial and stock market performance. The impact of brand value on financial performance is of relevance to managers, investors, and marketing research.
Footnotes
Appendix 1
Declaration of Conflicting Interests
The author(s) declared no potential conflicts of interest with respect to the research, authorship, and/or publication of this article.
Funding
The author(s) received no financial support for the research, authorship, and/or publication of this article.
Disclosure
The authors certify that they have no affiliations with or involvement in any organization or entity with any financial interest or non-financial interest in the subject matter or materials discussed in this manuscript.