
Abstract
The increasing use of smartphones has allowed quick response (QR) codes to build a stronger connection between consumers and products, enabling a bridge between offline and online products and providing quick access to product information, traceability, and food safety. This study focuses on two primary aspects: familiarity with QR codes and their usage by consumers and FMCG (fast-moving consumer goods) producers in Slovenia. Additionally, authors examined consumers’ motivations to scan QR codes for food products, particularly dairy products. Data collected through online research, interviews, and field investigations revealed that consumers rarely scan QR codes. To increase its usage, it should be included in an overall advertising campaign to provide instant benefit; consequently, it would increase consumer engagement with the product. Field research and interviews revealed that only a few packaged products are equipped with QR codes, primarily to support trade marketing activities. In addition, most consumers scan the code at home seeking information regarding its origin, which provides insights into future implementation possibilities. Furthermore, from the design point, QR codes should be positioned on the side panel of the packaging together with an invitation to motivate and explain how scanning would benefit the consumer.
Introduction
Today, the consumer is exposed to several products. According to Food Marketing Institute (n.d.) an average supermarket offers approximately 30,000 different items, which is four times more than what it was 30 years ago, and 45,000 stock-keeping units (SKU) per grocery store on average (Stephenson, n.d). Therefore, brands are having difficulties in attracting consumers.
Food has experienced volatile sales shifts owing to the COVID-19 pandemic, and the shopping behavior of consumers has changed drastically, lowering barriers to brand switching. According to McKinsey COVID-19 United States consumer survey, 75% of consumers have discovered a new shopping behavior, another 36% have purchased new or alternative brands and products, often out of necessity owing to product availability and out of changing attitudes (Doshi et al., 2020).
Exploring the Dynamics of the Global and Slovenian Dairy Market
In the dairy market, the volume of traditional fluid milk declined from −2% to −4% from 2016 to 2019 (Adams et al., 2020). Despite the negative tendency of traditional milk and slow growth of overall dairy until 2019, the global dairy market is expected to grow at a compound annual growth rate (CAGR) of 2.5% in the period from 2020 to 2027 (Grand View Research, 2019). Moreover, behavioral shifts owing to the pandemic have triggered a re-evaluation of dietary habits, while strongly underlining the link between food and health. Owing to increased consumer concern regarding health, sales of dairy alternatives are expected to grow at a CAGR of 11.2% from 2020 to 2027 (Meticulous Market Research, 2021). This is because of an increase in the number of lactose-intolerant people and their choice of dairy alternatives, growing ethical concerns regarding animal abuse in modern dairy farming methods, and the high nutritional benefits associated with alternative products.
The dairy industry and consumption in Slovenia have seen a decline in the past 10 years, with milk and milk product consumption decreasing by 7% to 204 kg per inhabitant by 2021. However, milk self-sufficiency has increased. In 2019, dairy farms in Slovenia produced 360,000 tons of milk, which was mostly processed into fresh goods: 35% for drinking milk (the most important dairy product in Slovenia), 21% for cream, and 9% for fermented milk products. Cheese and butter accounted for 18% and 15%, respectively. Average purchase price of milk for producers has increased by 42.6%; comparing August 2021 with August 2022 EU 27 (European Union; 27 member countries), and retail food prices are following the same trend in the EU 27. This has caused dairy production to no longer be a significant source of income for trade (Chamber of Commerce and Industry of Slovenia - Chamber of Agricultural and Food Enterprises, 2022; Kuhar, 2022; Stele & Svetin, 2021).
The retail is the most powerful link in the dairy supply chain, and 95% of the milk sold to consumers is purchased from supermarkets (Esselink, 2009). Markets and grocery stores in large supermarket chains in Slovenia, such as Mercator, Spar, and Tuš, are therefore key sales outlets for dairy products. This dependence exerts pressure on dairy companies to lower their prices. Simultaneously, discounters continue to grow in popularity, mostly by lowering operational costs and price promotions. Further, e-commerce has been gaining momentum owing to changing consumer behavior affected by rising incomes, increased trust in the online channel, and a desire for convenience resembling a COVID-19 situation.
Reinventing the Packaging in a Visually Statured Environment
In the past, the milk market suffered both from the increase of private labels and imitators of original brands. Now, it deals with consumers’ income loss owing to the pandemic, who are beginning to reduce their expenses by shifting to cheaper brands or private labels and shopping in discounters or value stores (Hoekstra & Leeflang, 2020; The Nielsen Company, 2018). Owing to these conditions, the milk market needs to reinvent itself to maintain market share and secure its growth. In visually statured markets, every detail affects consumers’ buying decisions, and packaging is often overdesigned with several elements. When comparing packaging with different elements in the communication mix, it has the fewest seconds to drive engagement. Previously, packaging had a time span of 5 s to attract consumer attention (Soars, 2009); nowadays, the estimated time span is from 3 to 5 (Colasuonno, 2018) or even 2 s (Stephenson, n.d). It requires only a few seconds for the first impression to form because the consumer already has a sense of the product from all external stimuli and personally gathered information online or offline (Colasuonno, 2018). Packaging and its elements create a difference and can strongly reinforce or disrupt consumers’ brand preferences; therefore, intelligent packaging can be a tremendous advantage in marketing. Smart packaging elements such as QR codes can extend or increase consumer interactivity with products before and after purchase. This increased communication with a product or brand can help brands stand out from the competition and capture consumer attention in the pre- and post-purchase stages. To attract consumers effectively, smart elements must be graphically portrayed and supported by point-of-sale materials and marketing activities. Prolonged interaction with the product is the key to building a stronger link between the product, brand, and consumer; the consumer can be kept in the emotional phase for as long as possible, thus creating a deeper relationship (Soars, 2009).
QR Code and its Use on Dairy Products
This study focused on the use of quick response (QR) codes because they allow additional interactions, distinctiveness from other products, and a greater connection through quick and easy access to valuable, product-relevant information. Denso Wave created it in 1994 for quick and accurate inventory checks (Denso Wave, n.d.). It stores data horizontally and vertically; therefore, it occupies less space and allows for 360° reading with an independent database for immediate entry regardless of location (Kulkarni & Malagi, 2016). It is small with a high storage capacity (up to 7,089 characters), high durability, and a built-in error corrector (Gregor-Svetec, 2018). Companies have used QR codes to increase brand awareness and advocacy, develop consumer engagement and retention, and create databases to increase sales and lower marketing costs (Asare et al., 2015).
Studies on the use of QR codes have predominantly covered the general use of QR codes and their application to food products. Nonetheless, a study on consumer perceptions of QR code technology for enhanced fluid milk shelf-life information provision in a retail setting found that 60% of participants preferred QR code containers over printed best-by date containers, and the research team believed that this technology could provide more accurate information on the drinkability of milk, leading to a significant reduction in agricultural and food waste (Lau et al., 2022). Rotsios et al. (2022) reviewed the use of QR Code on dairy. Results revealed higher usage intention, comprehension, and self-confidence with the adoption of the QR code, assisting consumers in acquiring enhanced knowledge about the product. Developed as part of the EU-funded ClearFarm project, QR codes on milk cartons, according to Precision Livestock Farming’s electronic monitoring technology, provide information on cattle health and well-being (Jones, 2022).
Some examples of use of QR codes on milk packaging: Tetra Pak (n.d.) introduced a dynamic QR code on an Indian milk brand, allowing them full traceability, creating a communication channel with the consumer; SIG introduced it on Brazilian milk brand Languiru, which resulted in the growth of sales by 6% (Eagle, 2018); French milk brand En Direct des Éleveurs uses it to ensure traceability allowing consumers to obtain information about the source farm origin of the milk and it brought them an innovation award in 2017 and the Social Entrepreneur Award 2018 (Ecolean, n.d.; Boston Consulting Group, 2019; News desk, 2017); Slovenian milk Alpsko mleko introduced it to lead consumers to a website where they can learn the background of one of the farms presented (Internavti, 2020); Swiss dairy company Emmi uses QR code to lead customers to a jackpot wheel entry game, which users spin to select a game to play (Stewart, 2020); Malaysia Goodday banana milk uses its code to raise awareness on Bornean orangutans directing consumers to information about how they themselves can contribute (Tan, 2020); German dairy cooperative uses it to convey the story behind each carton of organic milk—assigning its own digital ID a QR code on the lid (Rohr, 2020); Aldi Belgium added QR code on the side of the carton of Milsa whole milk, semi-skimmed milk, and skimmed milk to lead directly to the digital version of the Aldi magazine (Simpson, 2022).
This study presents research results on the use of QR codes in the fast-moving consumer goods (FMCG) segment in Slovenia. The results suggest a similar trend in other regions. Based on existing studies, we anticipate similarities in consumer behavior and motivation to use QR codes. To study consumer behavior using QR codes for food, with a focus on dairy products, we used qualitative and quantitative analysis methods. Data were collected using open-ended individual interviews with market experts, food producers, and retailers; an online survey; and in-depth personal interviews with consumers, and focus groups.
Five hypotheses were proposed:
(H1): QR code is well known by consumers.
(H2): QR code is more known to people with education higher than 6/2 level.
(H3): QR code is known to the millennials (Generation Y).
(H4): The consumers rarely use QR code.
(H5): QR code is used to obtain information about the origin of milk.
Materials and Methods
Data Collection
To analyze the use of QR codes in the dairy sector in Slovenia, we used a
The aforementioned research methodologies were used to provide a comprehensive overview of the use of QR codes in food packaging, with a focus on dairy, as presented and discussed under the following topics:
Recognition and Knowledge of QR Codes (online survey, interviews with consumers)
Usage of QR Codes on Different Applications and their Scanning Rates (online survey, interviews with consumers)
Scanning Activity of a QR Code (online survey, interviews with consumers)
QR Code Scanning Location (online survey, interviews with consumers)
Type of Information Accessed using QR Code in General (online survey, interviews with consumers)
Type of Information Interest in Food Packaging (online survey, interviews with consumers)
Type of Information Interest in Dairy Packaging (online survey, interviews with consumers)
Use of QR Code by the Food Companies (interviews with producers, field research)
The positioning of QR Code on the Design (focus groups)
Data Analyses
A questionnaire was constructed with yes-no questions, multiple-choice questions, a 5-point Likert-type scale, ranging from 1-strongly disagree to 5-strongly agree (when ranking was required), and open-ended questions (to gather more information on the topic in case the consumer used the QR code in a manner not mentioned in the previous questions).
Data from the online survey and consumers’ interviews were analyzed using the following tests: a chi-square test of independence and Kullback test (an alternative to the Chi-square test) was used to check whether two variables have an influence on each other or whether they are connected and to ascertain if we could generalize the percentages of answer combinations from our sample to the population as well; binomial test, to check whether the frequency distribution of a variable with two values/categories in the sample corresponds to the distribution in the population); and one-sample t-test with a level of significance α = .05 to determine whether there is a significant difference between the expected frequencies and the observed frequencies in one or more categories.
We were testing the following hypotheses:
(H1): QR code is well known by consumers (binomial test; variable: knowing the element)
(H2): QR code is more known to people with education higher than 6/2 level (chi-square test; variable: knowing the element)
(H3): QR code is known to the millennials (Generation Y) (Kullback test; variable: knowing the element)
(H4): The consumers rarely use QR code (t-test: variable: read the code and frequency of use) and
(H5): QR code is used to obtain information about the origin of milk (chi-square test; variable: a. ingredients, nutritional table; b. possible usage and recipes; c. origin of ingredients and site of processing; d. prize games; e. link to free content (such as video, photograph); f. after-use package disposal location; g. the method of package recycling)
Results
SWOT Analysis of QR Codes Usage
The SWOT analysis (Table 1) revealed the chief strength as the possibility of building an additional communication channel with the consumer and increasing the engagement of the consumer’s interest in the product. The use of QR codes as marketing tools has been increasing. However, to ensure the required activation, the QR code must be part of an overall advertising campaign and not simply a standalone element. Using QR codes enables to build a database that facilitates consumer relationship management (CRM). The necessity of installing an application to read QR codes and the insufficient frequency of use among consumers was determined as a weakness.
SWOT Analysis of the Use of QR Codes in FMCG Sector.

Demography of Respondents (Online Survey and Interviews With Consumers)
A total of 203 respondents (online survey: 173; interviews: 30) aged 19 to 64 years participated in our study, with majority of the respondents from central Slovenia. The average age of the participants in the online survey groups was 37.5 years (61.1% female, 39.5% male) and that of the interviewees was 34.7 years (55.2% female, 48.3% male). Considering all the respondents, 65% had 6/2 level of education or higher, 28.1% had 5 or 6/1 level, and 6.9% had an education level below 5 (Table 2).
QR Code Knowledge of the Online Survey Respondents and Interviewees: Distribution by Age, Education, and Gender.

Z generation is not relevant to our calculations.
Recognition and Knowledge of QR Codes
The survey revealed that 97% of all the respondents were familiar with the image element representing a QR code. The percentage of correctly naming (knowing) the element was expectantly lower—84.7% (Table 2). The calculated chi-square for hypothesis
The results revealed that of all the respondents who had knowledge of QR codes, 4.9% had an education lower than level 5, 21.2% had an education level 5 or 6/1, and 58.6% had an education level 6/2 or higher (Table 2). For hypothesis
The recognition of QR code in correlation to age indicates that QR code is most known to Generation X (born between 1965 and 1980) with 44.3%, followed by Generation Y (born between 1981 and 1996) with 35.8%, and “baby boomers” (born between 1946 and 1964) with 4.9%. (The results for both online survey groups and interviewees are presented in Table 2). In hypothesis
Use of QR Codes on Different Applications and Their Scanning Rates
Considering various applications where QR codes were most frequently noticed, online respondents mostly noticed them on flyers, followed by ticket vouchers, packaging of technical products, posters, and food products (Figure 1). In addition to the options mentioned above, the questionnaires also indicated the use of QR codes on invoices for tax supervision (a project of the Financial Administration of the Republic of Slovenia) in newspapers, magazines, cosmetic products, art paintings, and presentations. At least half of the online respondents scanned the applications (Figure 1). Most online respondents have scanned QR codes on leaflets, followed by vouchers, business cards, posters, and packaging of technical products, whereas only 16.2% of the respondents scanned QR codes on food packaging products. The number of actual scans were much lower than the recognition of applications with QR codes, suggesting that consumers need more motivation to be interested in the activity. Half of the interviewees said that they noticed the QR codes on receipts or tickets.

Detection and scanning of QR code on different applications by online respondents (online survey).
Scanning Activity of a QR Code
Of the interviewees, 66.7% had used a QR code at some point of time and 61.5% of the online respondents had already scanned a QR code in the past. The percentage of online survey respondents was relatively higher, considering that 32.4% of them scanned QR codes in an online survey or mockup packaging (48.8% stated they had a scanning application installed on their phones). The answers revealed that the respondents do not fully understand how it functions. However, they listed a few possibilities for using it such as monitoring prices, adding up purchases, tracking, recording shelf life, and acquiring information on the product, process, and origin. Respondents stated that the code’s most important benefit was easy and quick access. They would scan it if they had an immediate benefit from it such as faster access to the product or contact information, an instant discount, or access to prize-winning games. Moreover, they indicated that access to additional advertising was not a motivational driver for scanning. The frequency of QR code usage was measured in the online survey using a 5-point Likert scale, and the results revealed an average of 2.42, indicating moderate use of QR codes. The use of QR codes is dependent on QR code-scanning applications. Thus, consumers do not recognize the benefits of current QR code applications, proving that QR codes have been often used for uninviting content. Regarding hypothesis
After interviewing professionals and acquiring initial information about the low usage of QR codes by food companies, including the low implementation rate of QR codes in the market (15 companies with implemented QR codes were identified), low usage among respondents was anticipated as well.
QR Code Scanning Location
Online respondents could select multiple options when asked about scanning locations. More than 30% of the online respondents and 46.7% interviewees scanned QR codes at home. Further, 18.7% online respondents scanned the QR code at work, 17.1% on public grounds, 15.2% at the store at the time of purchase, 9.3% in restaurants or bars, and 8.9% in public transportation. In addition to scanning at home, 26.7% interviewees used it in the store. Consumers need more time to interact with the product to scan the code, and the number of products with codes is scarce. However, this is not only owing to the element itself, but also the fact that it is either not sufficiently interactive or appropriately marked.
Some online respondents indicated that they find the use or scanning of QR codes most appropriate at home, because it is time-consuming in the store. Based on the results collected from the interviews, the consumer is already overwhelmed with information on the packaging, and additional content through QR codes is redundant. Additionally, the importance of information value has been emphasized.
The results suggest that all groups within the sample had similar behavioral patterns regarding QR code testing. Although 15 companies implemented QR codes, and only 22% of consumers use their smartphones for acquiring information in the store, intelligent solutions are possibly mostly used at home. When consumers spend more time with a product, their interaction is higher; therefore, there is a higher chance of scanning the code, and this hypothesis can be confirmed.
Type of Information Accessed Using QR Code in General
Most online respondents used QR codes to access webpages, followed by content such as referrals for tickets, text information, and links to free content or prize games (see Figure 2). The interviewees stated similar content and added the following: accessing maps, contact information, surveys, product specifications, and loyalty cards. Most respondents stated that QR code content should be beneficial and sufficiently engaging and motivating to trigger scanning.
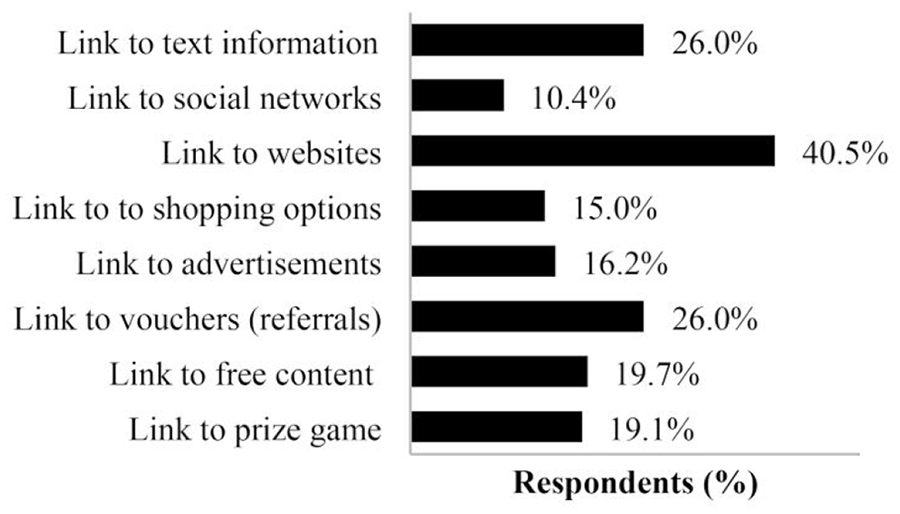
Content which respondents accessed using QR code (online survey).
Type of Information Interest in Food Packaging
The responses of the online survey respondents (Figure 3) and interviewees state that information regarding the origin, location of product manufacturing, and ingredients in the nutrition table would be most useful. Participants were also interested in prize games, a link to a web page or social media, the presence of allergens, a comparison of the prices of the same product in the area, energy values, new uses, and new product presentations. Among the most interesting suggestions for implementation was the use of QR codes as an assistant tool for people who are unable to read the small text on the packaging. Additionally, the results reveal that the use of QR codes would not excessively increase interest in the product, as the mean value on a 5-point Likert scale is 2.37.

Type of information embedded in QR code (online survey).
Type of Information Interest in Dairy Packaging
The respondents’ interest in information on dairy packaging was similar to their interest in information on food packaging. According to the results of the online survey, the most important information in addition to the ingredients and nutrition table was the origin of the raw material and the site of processing (68.2%) (Figure 4). Regarding the application of QR codes to the packaging of long life (ultra-heat treated) milk being beneficial, 68.8% of the online respondents agreed. For the mock-up and testing, we used the brand with the highest recognition in the UHT milk market in Slovenia. An open-ended question was used to better understand the type of information embedded in the QR code that would be useful to milk consumers. Of the online respondents, 40% participated and most indicated that they would appreciate having information on the origin of the milk and traceability of the product, the required data on the production process, and the content of the additives. Additionally, some interesting suggestions were made: the possibility of registering for an event, calculating the carbon footprint, recipes, published myths about milk, true and false facts regarding milk. The type of information regarding dairy products (milk) that would interest interviewees is as follows: 56.7% stated traceability and the origin of milk; 13.3% production process; and the remaining stated price, recipes, and games. A few also mentioned information regarding sugar content, myths about milk, the possibility of rewarding a purchase, or a link to a prize game and recipes. In particular, it is appealing to use QR codes to display everyday information such as videos, schemes, infographics, packaging processes, and recycling circles in a user-friendly manner. However, among the respondents, some believed that milk was an essential commodity bought without much consideration or the need for additional information; therefore, the QR code was superfluous.

Information interest in dairy products using QR code (online survey).
The calculated p-value for hypothesis
Use of QR Code by the Food Companies
Through field research at different Slovenian retail stores, packaging samples with implemented QR codes were identified. An inquiry into the reason for the usage was sent to the producers. The number of packages with QR codes is low but rising. Table 3 lists the use of QR codes in packaging (Figure 5) by product type. Preliminary reports revealed that most QR codes were used as an additional tool for trade marketing activities with applications on flyers and posters, however, it was soon dismissed owing to the lack of scanning activity by consumers. We identified 15 companies that applied QR codes to their packaging, primarily to access their websites; a few of them used QR codes in a broader sense (traceability).
QR Code Usage on Different Types of Products in the Region.
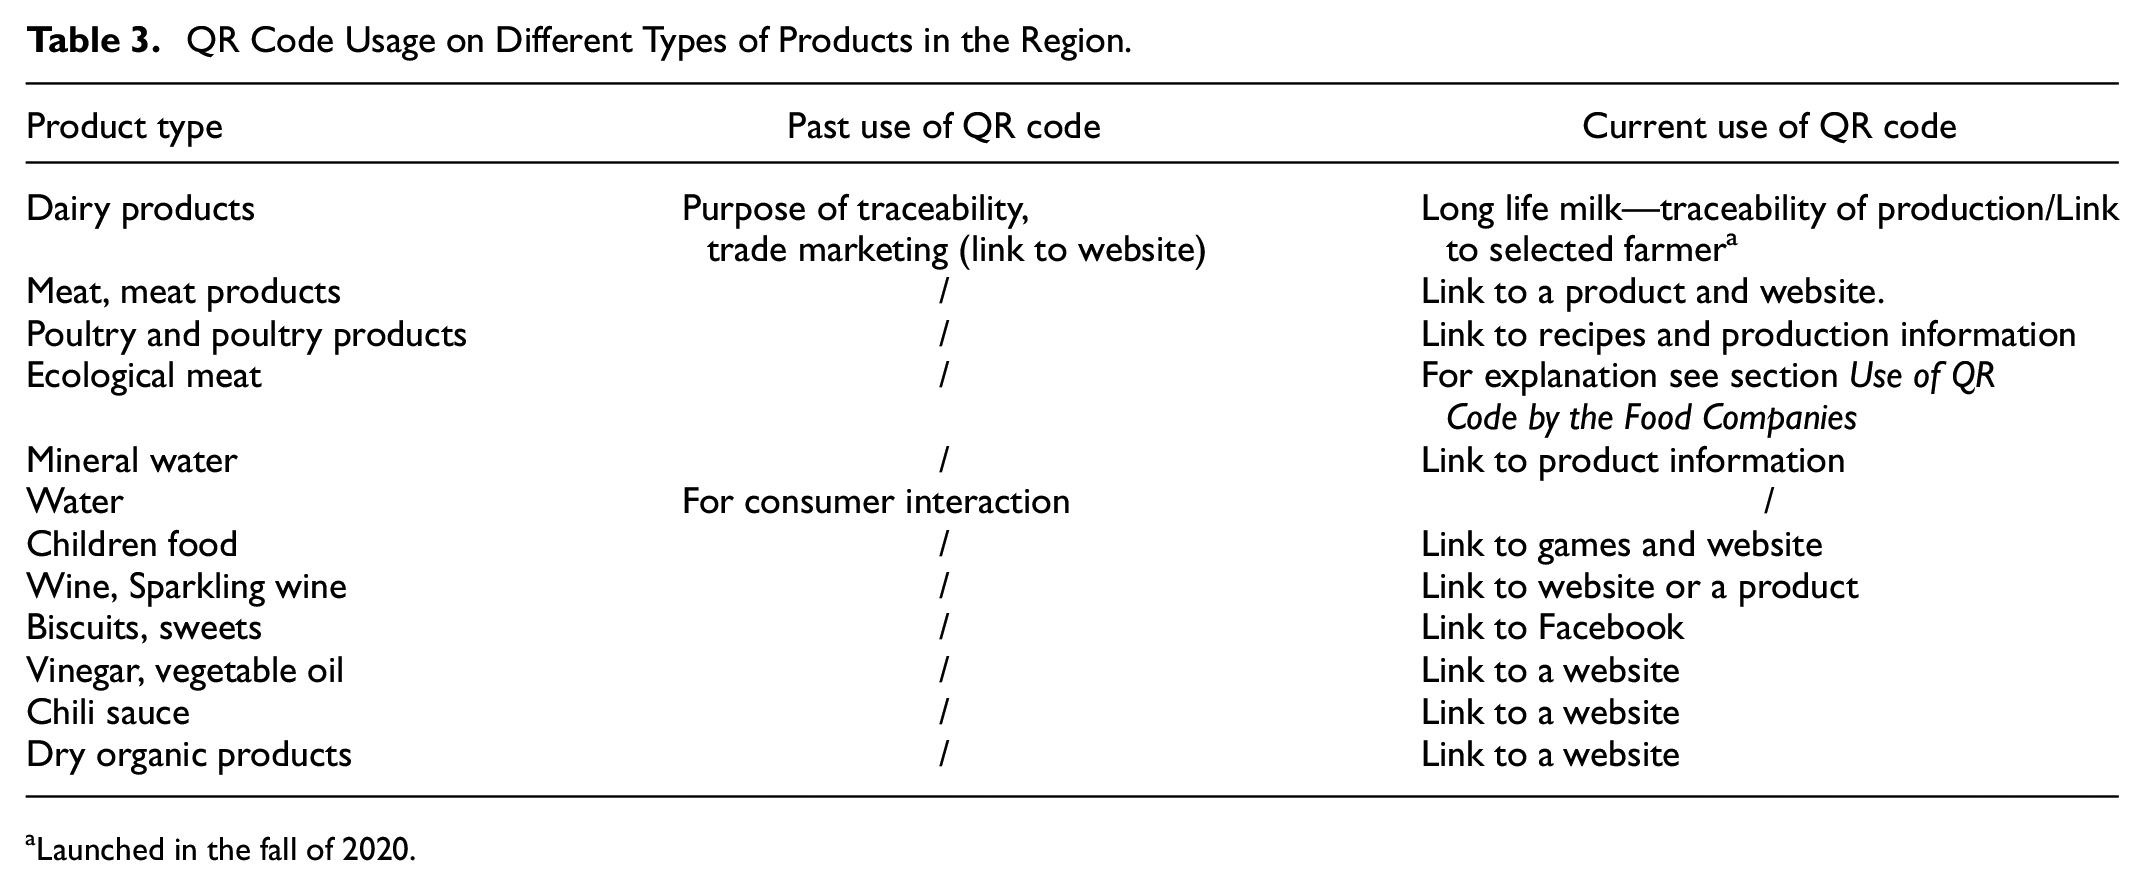
Launched in the fall of 2020.

Packaging samples with an implemented QR code.
We specified ecological meat separately because QR codes stand out from other uses. Ekodar has used QR codes for traceability over 8 years. Each pre-packed piece of meat has a unique QR code with a link to the specific eco-farmer and provides information about the breeder, location, photograph of the farm, and basic information about it (number of animals, farm location, and altitude). Using QR codes, they managed to rapidly present themselves as trustworthy and fair ecological providers. In addition to traceability, they use QR codes to direct consumers to their websites, open up new possibilities for obtaining new online consumers, and generate direct sales. Major poultry producers in the region (Perutnina Ptuj) used QR codes in their poultry packaging 7 years ago to enable additional content, such as recipes and further information about the production process. They analyzed consumer activity, indicating low usage of QR codes and not providing satisfactory added value. With increased recognition of the code in the past year, they decided to use it as a traceability element, link it to the producers’ list, or link it to a video on chicken raising. Ljubljanske mlekarne, the largest dairy manufacturer in Slovenia, uses a matrix QR code on their long-life milk products intended to be read by the quality control department, ensuring quicker traceability and providing higher capacity data printed in smaller spaces. Owing to considerable recognition of the code in the past year, they also added a QR code for consumers, leading them to background information of a few selected farmers (milk suppliers). The QR code on sparkling wine bottles was found to be a quick tool for consumer information retrieval, such as the variety of grapes, product descriptions, or recommendations for food combinations. Surveys and fieldwork noted that QR codes appeared on packaging more often, also owing to the specific market situation of the COVID-19 pandemic.
The Positioning of QR Code on the Design
The recall of graphic elements such as QR codes depends on their placement. For the consumer to scan the QR code, it must be visible, preferably on the front or at least on the side panel of the product, which is one of our interests.
Most packaging have a QR code positioned on the back or side panel and never on the front panel. Furthermore, there was a readability issue or false readability because of the QR code’s position in the barcode space; instead, the barcode was read. Only two samples of packaging, ham and children’s biscuits, with an additional invitation to scan the QR codes, were found. An example of a QR code includes an additional graphical element in the middle of the code, as in the case of oil and poultry packaging.
Regarding the position of QR code, the interviewees distinguished between two types of information; one connected to entertainment such as access to prize games, loyalty programs, video content (“entertainment QR code”), and the other connected to the information of origin, manufacturing process, ingredient or nutritional information (“origin QR code”). Almost half of the participants (48%) would position the entertainment QR code on the side of the packaging, agreeing that rounded packaging also has sides, and only 24% would position it on the front, primarily because of the unappealing perception of the visual presentation of QR codes. They found a solution in placing the QR code on the side with the invitation on the front, whereas 24% positioned it at the back. This is similar to “origin QR”; 66% would position it on the side, 26% at the back and only 8% on the front panel, with an argument that we have a higher motivation to find this type of information. The groups also indicated the need for explanatory text on the package as to why QR codes should be scanned.
Discussion
Extant studies on QR codes in the food industry is limited, primarily referring to the general use of QR codes, which has helped us understand the subject and establish further experimental work. QR codes have become popular in Japan for many promotional activities because of their high information-encoding capacity (Dou & Li, 2008). It rapidly gained popularity in Europe in the early 2000s and soon after in North America for broad, often commercial purposes (Okazaki et al., 2011). By December 2011, only 20% of American, 16% of Canadian, 12% of Spanish, and 12% of British smartphone users had used QR codes, and the percentage of usage declined (Rivero, 2020).
QR Code Recognition: Examining it Across Gender, Education, and Generation
According to our results, 97% of all the respondents recognized the QR code, however, 84.7% named the element correctly. Berndt-Morris and Chrenka (2014) also indicated that people could visually identify QR codes, however, did not name them correctly. Considering gender 48.8% of women and 36% of men knew the element, which was somewhat surprising. Gender Differences in E-Society: The Case of Slovenia (Dečman, 2018) indicated some gender differences in digital skills; men dominated in having more technical skills, such as programing and electronic device management, and women in managing files, using spreadsheets, and presentation software. Some statistically significant gender gaps continue to exist in Slovenia and are decreasing, which we believe is also reflected in our results. Respondents with an education level of 6/2 and higher were more familiar with QR codes than those with a lower level of education; however, we must be aware that this group comprised the majority of the participants in the survey. Moreover, it is evident that almost two-thirds of the respondents with education level 5 and 6/1, as well as those below level 5, also know QR codes.
Considering generations, QR code recognition is almost the same in generations X and Y. We targeted the Generation Y for interviews as important future consumers, considering that the rapid increase in e-commerce impacted consumers’ traditional purchasing habits by increasing their online purchasing behavior and shifting them from local to global markets. These changes are evident in Generation Y, the first generation with access to the internet since childhood (Korhonen et al., 2015), which is also our main reason why we targeted them in focus groups and hypothesized that Generation Y was most familiar with QR codes. Previous studies reveal that Generation Y has high expectations from packaging, particularly the experiential value (i.e., emotions and experiences) (Dečman, 2018). Further, an ecommerce survey conducted by eMarketer in December 2019 revealed that 60% of Generation Y, 50% of Generation X, and 34% of “baby boomers” used a mobile retail application (app) to search for more information regarding the product, which resulted in a purchase using the same application in 59% of Generation Y (42% of Generation X, only 24% of baby boomers). Thus, we can conclude that Generation Y is more likely to use the QR code to gather information (EMarketer Editors, 2020).
Changes in the recognition of QR codes began in 2017 when updates to the iPhone and Android operating systems virtually provided new models of smartphones the power to scan QR codes from their native camera apps—no unique app downloads were required—making it easier to use (Rivero, 2020). Further, our regional mobile provider informed us that no special application installation packages are available with QR code scanning applications, however, they appear in some phone camera models (Samsung, iPhone), chatting apps, and integrated readers (e.g., some models of the Huawei brand).
QR Code Scanning: Usage, Motivators, and Weaknesses
Results reveal that 44.5% of the respondents had a QR code scanner installed on their device or were aware that they have some other application to scan it (e.g., Viber can also scan QR codes); and 32.4% of the online survey respondents and only 20% of interviewees used the scanning feature. Thus, the need to install a scanner along with under-use among consumers, is considered a weakness, similar to the study concluded by Okazaki et al. (2011). Watson et al. (2013) stated that the motivators for using QR codes are ease of use, utility, and incentives. In contrast, a lack of knowledge about how to scan or the benefits of QR codes hinders its adoption; consumers need to be motivated to engage in the activity. Kim and Woo (2016) using the technology acceptance model (TAM), discovered the positive effect of external variables on perceived information and the perceived usefulness of QR codes.
Online survey results revealed the frequency of usage to be slightly above average (2.42), and that 60.1% of the respondents scanned the code at some point of time. This percentage was considerably high because less than half of the respondents had a QR code scanning application installed on their phones or were aware of it.
Using QR Codes for Food Product Packaging: Balancing Functional and Hedonistic Aspects
Most respondents used QR codes on food products to access manufacturing information and stated that the list of ingredients in a nutrition table would be the most useful. However, a survey of QR codes on wine packaging by Acuti et al. (2017) revealed that the most effective technical content or data were related to information with hedonistic aspects. Consumers use QR codes to obtain additional information that is usually not included in packaging. However, the information provided by the QR code or another source needs to find a balance between functional and organoleptic aspects; the broadness of the information can reach more consumers. In essential food products, such as dairy products (excluding desserts and ice cream products), it is challenging to talk about hedonism; we do not consider lifestyle (usually not) when selecting these products. Asare et al. (2015) indicated that for the successful use of QR codes, companies (brand owners) must know whom they are targeting and provide valuable content by placing the code at the appropriate location for ease of scanning. Similarly, Ryu (2014) stated that consumers scan QR codes if they appear to provide entertainment, information, or monetary benefits. Narang et al. (2012) indicated that the consumer’s desirability to scan QR code is higher with products, which demand more interaction or attentiveness. According to Hossain et al. (2018) QR codes with advertising are a gain for advertisers, whereas sharing information using QR codes can influence consumers to engage and share information. Moreover, they indicated that QR codes were useful, feasible, and acceptable. Unfortunately, as indicated in our study, companies are slow to adopt QR codes and do not perceive the benefits of their communication mix.
The Use of QR Codes for Traceability and Consumer Interest in Milk Packaging
The use of QR codes for consumers’ interest in information on milk packaging was predominantly for the traceability of raw material (milk). This is in addition to the interest in information on production process and price. However, despite all the signs on the packaging regarding the origin, the consumer remains under-informed. A correlation with the Slovenian Marketing Association (DMS, 2017) can be drawn, which states that the origin of the raw material is crucial for milk and other food products for Slovenian consumers. In addition, a Eurobarometer survey (European Commission, 2014) revealed that over 80% of Slovenian consumers value the importance of product origin information. Moreover, the potential use of QR code for traceability was indicated by Kim and Woo (2016). Furthermore, the same potential use was presented in several countries: the United States, Canada, Germany, the Netherlands (Okechuku, 1994), Greece (Chryssochoidis et al., 2007), Bosnia & Herzegovina (Čutura & Malić Bandur, 2016), and Australia (McCutcheon et al., 2009). Consumers wish for high-quality products however, most do not wish to pay more for products with intelligent packaging (Müller & Schmid, 2019). The primary motivation to scan QR codes is for products with higher added value; for example, consumers are more demanding or sensitive regarding using QR codes for the traceability of organic meat.
Benefits of QR Codes: Examining Consumer Interaction With QR Codes
As the anticipated interaction of the consumer with QR codes is intended primarily for additional information shortly after purchase, this element must be emphasized with other descriptive features. Moreover, it is recommended to draw attention to QR codes and explain further actions to stimulate consumers to scan them. We discovered that QR codes are mostly scanned at home, at work, or in public areas, that is, in places where interaction with QR code carriers (in our case, packaging) is prolonged or more in-depth. This is consistent with the findings of Watson et al. (2013), who indicated that most people read QR code in the street or at home. It can be concluded that the use of QR codes to obtain information before purchasing a product is almost nonexistent. In our inquiry, 22.5% of the online respondents read QR codes before buying, however, the respondents expressed their intentions and not the actual act of reading. Additionally, they indicated that food, in our case dairy products, is an essential product, and that they do not see any particular benefits from obtaining additional information that would persuade them to purchase it. Watson et al. (2013) emphasized a reluctant attitude toward acquiring information through mobile phones since consumers do not take time and effort.
For increased use of QR codes, the consumers’ understanding that they will have direct and immediate benefits, faster access to product and contact information, access to the prize game or discounts when purchasing a product and not simply access to additional advertising, is crucial. To summarize, few companies that place QR codes on packaging recognize their benefits, proving that QR codes have often been used with insufficient or uninteresting content, which is evident from some of our examples. This study revealed that 15 producers implemented QR codes for packaging. The primary weakness of not using it is insufficient content, as they mostly use it as a link to their website. The use of QR codes is insufficient for attracting consumers. In addition, the code is usually without invitations or explanations to consumers as to why they would benefit from scanning it. The leading cause of the low implementation rate of QR codes by producers is a lack of understanding of the vastness of the possibilities of usage. Sago (2011) and Ozkaya et al. (2015) found that even innovation-oriented consumers were unlikely to use QR codes. Ertekin and Pelton’s (2014) study on motivations to use QR codes in magazine advertising revealed that consumers are motivated by the promotions offered by the business, being entertained throughout the experience, or searching for a useful link to obtain relevant product information. Consumers would be motivated and interested in using it if there was a story behind the element. Cata et al. (2013) confirmed that the hurdles of using QR codes are improper implementation, poor execution, and a lack of awareness among the users. A few producers implemented the QR code, primarily on more complex, safe, and origin-defined products, since the code offers access to additional information and simultaneously enables building trust between consumers and producers. The implementer must understand the motivation behind the possible activity of the consumer who will benefit from scanning QR codes.
QR codes gained recognition during the pandemic. People were sensitive to direct contact; nobody wanted to touch anything, and businesses adapted to the new situation: restaurants replaced paper menus with QR codes, PayPal and Venmo rolled out a touchless payment option for businesses powered by QR codes, CVS announced to roll them out at 8,200 stores, and the health organization used it to track contacts (Rivero, 2020). With the growing need to provide clear and detailed information on products and the current pandemic situation, food safety has begun to play an even more critical role. The QR code is a valuable tool for protecting consumer rights by providing more information, thus ensuring greater safety and quality of foods (Kim & Woo, 2016).
Using QR codes, consumers can interact with mobile-enabled interactive applications, perform specific tasks, and be better connected to the brand because of the sense of high-tech interaction (Shin et al., 2012). In the food sector, QR codes are primarily used for higher-value-added products. Usage will increase among consumers who demand information regarding their origin, such as dairy, meat, and organic products, or increased buying safety (no contact or counterfeiting safety). Another potential application is in the premium goods sector, for example, wine and sweets, which bring consumers an increased hedonistic experience. Additionally, QR codes are an innovative way to tackle the issue of food waste, while they can accurately inform customers about drinkability and dynamic pricing and communicate with smart refrigerators to remind households to buy fresh milk (Lau et al., 2022). A report on the current trends in smart packaging (Cakebread & Nelson, 2015) states that the future of QR codes will be in the broader use of the element for additional product information and predicts near-universal use of QR codes by 2025, which the pandemic situation has definitely speeded up.
Conclusions
Using intelligent elements in packaging can help gain consumers, change their purchase habits, and provide deeper insight into consumerism, and consequently help brands extend their communication with consumers and secure their current position in the market. QR codes can reward loyalty and refer consumers to social networks, where a classic user can be transformed into a brand ambassador, which is the ultimate benefit for the product/brand with free advertising. Furthermore, it simultaneously enables improved product experience and omni-channel use, providing a seamless shopping experience. Nonetheless, it is important to portray the elements attractively to draw the consumer’s attention quickly when passing through the packaging. Regardless of skepticism, QR codes have not reached their potential, and new possibilities for use and implementation can be expected, particularly in combination with other intelligent elements.
The use of QR codes in the food industry offers significant potential for providing consumers with more dynamic information about products. Although most respondents recognized the QR code and could not necessarily name it correctly, its use has increased dramatically in the last 2 years owing to health concerns and restrictions imposed by the pandemic. While QR codes may play a role in packaging in the future, they must be integrated into a product’s marketing or brand strategy. It must provide actual content and instantaneous gratification to entice users to interact and extend their relationship with the product. Our findings reveal that there is no significant difference in understanding the element when segmenting customers by education and age in terms of marketing segmentation, implying that there are no restrictions on using the QR code for general food products or, in our example, dairies. Considering that consumers want to know more about a product’s origin and entire life cycle, including raw materials (milk and packaging) and manufacturing methods, the QR code is an ideal element.
This study contributes to information regarding the possible benefits and drawbacks of implementing QR codes in the dairy sector in Slovenia, thereby allowing to develop effective strategies for their usage and implementation in the future.
Short Overview of the Hypothesis of Results
Of all the respondents, 97% were familiar with the image element representing a QR code, and 84.7% named (know) it correctly. p-value = .000, derived by combining data of both recognition and knowledge of QR codes.
Knowledge of QR codes was highest in respondents with an education level of 6/2 and higher, however, also significant in respondents with a lower education level. p-value = .0128
The percentages of QR code recognition were almost the same for generations X and Y. There were no considerable differences in the knowledge of QR codes between the two generations. Binomial test (test percentage: 70%) calculated p-value = .001.
Only around 32.4% of the online survey respondents and 20% of the interviewees scanned QR codes and knew or understood the need for a QR scanning application or the ability of their phones to scan it. T-test demonstrated a significant p-value = .000.
Of the respondents, 66.5% were interested in information about the origin of dairy products. p-value=.000, implies that the product’s origin is vital to most respondents.
Limitations and Future Research
The results of this study should be interpreted with the awareness that the research sample was collected before the COVID-19 pandemic, and with the understanding that it can be easily transferred to other regions according to existing studies, as the correlations among the results were presented.
As a next step, it would be beneficial to educate marketing and packaging experts to demonstrate the range of possibilities offered by smart packaging. This research will help extend the use of QR codes and motivate further research on this topic.
Footnotes
Acknowledgements
We are thanking Alja Učakar for a comprehensive knowledge of brand management.
Author Contributions
Conceptualization and methodology, T.Ž. and D.G-S.; investigation and formal analysis, T.Ž.; writing—original draft preparation, T.Ž.; writing—review and editing, D.G-S.; All authors have read and agreed to the published version of the manuscript.
Declaration of Conflicting Interests
The author(s) declared no potential conflicts of interest with respect to the research, authorship, and/or publication of this article.
Funding
The author(s) disclosed receipt of the following financial support for the research, authorship, and/or publication of this article: Slovenian Research Agency [Programe P2-0213].
Data Availability Statement
The data presented in this study are available on request form the corresponding author.