
Abstract
This study examined whether the five scales of the MUSIC Model of Academic Motivation Inventory produced valid scores when used in university English language courses across four different countries. We surveyed 1,147 students in English language courses in Iran, Mexico, China, and Egypt and analyzed their responses by performing measurement invariance testing using multiple group confirmatory factor analysis. The internal consistency reliability of the five MUSIC Inventory scales was acceptable. The configural, metric, and scalar invariance held across the four countries, providing evidence of construct validity for the five scales. Relationships between the MUSIC Inventory scales and measures of behavioral engagement, disaffection, and achievement provided some evidence of criterion validity, but some inconsistencies with expected relationships were noted. Overall, this study provides validity evidence for using the inventory in English language courses.
Introduction
Over the past several decades, researchers have studied students’ motivation in second language (L2) acquisition (Al-Hoorie, 2017; Al-Hoorie & MacIntyre, 2019) and have developed different theories of L2 motivation, such as Gardner’s (1985, 2019) Socio-educational Model of Second Language Acquisition, and Dörnyei’s (2009) L2 motivational self-system. More recently, Jones (2020) explained how researchers have begun to apply the MUSIC Model of Motivation (Jones, 2009, 2018) to study the motivation of L2 students because it integrates academic motivation constructs from multiple motivation theories. Although the MUSIC model was not designed specifically to address the motivation of L2 students, it was developed to help instructors motivate students in academic courses, as opposed to motivation theories that were developed to understand human motivation more generally.
In addition to using the MUSIC model to design instruction, instructors and researchers have used the MUSIC Model of Academic Motivation Inventory (MUSIC Inventory; Jones, 2012/2020) to assess instructors’ strengths and weaknesses related to student motivation and to examine the relationships among motivation constructs and their antecedents and consequences. The MUSIC Inventory is used to assess students’ perceptions related to the five components of the MUSIC model: eMpowerment, Usefulness, Success, Interest, and Caring (MUSIC is an acronym). Given that the MUSIC model and inventory have been shown to be useful to teachers and researchers in non-L2 courses (e.g., LaCroix et al., 2018; Tu & Jones, 2017) and L2 courses in China (Le et al., 2014; Li & Jones, 2019; Li et al., 2016), it is reasonable to suspect that they may also be useful to L2 teachers and researchers in other countries. However, before the MUSIC Inventory can be used in other countries, it needs to be validated for use within those countries. The purpose of this study was to examine whether the MUSIC Inventory was valid for use in university English language (EL) courses in countries within East Asia, Western Asia, Africa, and North America. We first investigated whether the inventory demonstrated acceptable psychometric properties and produced valid scores across EL courses in Iran, Mexico, China, and Egypt. Next, we examined how students’ MUSIC perceptions related to their engagement and achievement in these EL courses. If the relationships among these variables are found to be similar across countries, it would provide evidence for the MUSIC model theory, which hypothesizes significant positive relationships among these variables (Jones, 2018, 2019).
Literature Review
The MUSIC Model of Motivation
The MUSIC Model of Motivation (Jones, 2009, 2018) consists of five groups of strategies—empowerment, usefulness, success, interest, and caring—that can be used by instructors to motivate students. The key principles of the MUSIC model are summarized here.
The instructor needs to ensure that students: (1) feel
These principles are based upon research conducted from many different theoretical perspectives, including self-determination theory (Deci & Ryan, 1991), expectancy-value theory (Wigfield & Eccles, 2000), interest theories (Hidi & Renninger, 2006), social-cognitive theory (Bandura, 1997), among others (see Jones, 2018 for further explanation). The MUSIC model is also consistent with research conducted by L2 researchers (Dörnyei & Ushioda, 2011). For example, Dörnyei and Ushioda (2011) cite the importance of L2 teachers providing learners with autonomy and promoting self-motivation (the eMpowerment component in the MUSIC model). They also note that teachers should help students understand the usefulness of activities and set goals to help guide their learning (the Usefulness component). In addition, they recommend the following: ensuring that learners have a high expectancy of success and self-confidence as learners (the Success component), arousing students’ curiosity about and interest in class activities (the Interest component), and attending to the quality of teacher-student relationships (the Caring component).
In sum, the MUSIC model provides a framework that L2 teachers can use to organize the motivational strategies that have been identified by L2 researchers. As noted by Jones (2020), using the MUSIC model in L2 settings does not replace the need for existing L2 motivation theories, instead, it can be used by teachers as a complementary approach that meets the need for what Lamb (2019) referred to as “motivating learners, as opposed to learner motivation” (p. 288). As importantly, the components of the MUSIC model align with motivation constructs that can be assessed. Consequently, teachers and researchers can assess students’ MUSIC perceptions, which can provide them with feedback about students’ motivation and engagement, as explained in the following section.
The MUSIC Model of Academic Motivation Inventory
Researchers often use the MUSIC Inventory (Jones, 2012/2020) to assess students’ MUSIC perceptions because it provides scales with similar response options for each MUSIC model component and has been shown to produce valid scores in a variety of educational environments, including elementary school (Jones & Sigmon, 2016), middle and high school (Chittum & Jones, 2017; Parkes et al., 2017), college (Jones & Carter, 2019; Jones & Skaggs, 2016; Tendhar et al., 2017; Wilkins et al., 2021), professional schools (Gladman et al., 2020; Jones et al., 2019; Pace et al., 2016), and psychological clinics (Hansen et al., 2019; Saperstein et al., 2020). The MUSIC Inventory has been translated into many different languages, and researchers have documented that it produces valid scores when translated to Arabic (Mohamed et al., 2013), Chinese (Jones et al., 2017), Danish (Hansen et al., 2019), Icelandic (Schram & Jones, 2016), Japanese (Hansen et al., 2019), and Spanish (Author et al., 2017). These studies have also provided factor analytic evidence that the five MUSIC components are distinct. Each of the MUSIC Inventory scales measures a well-known motivation construct, as noted in Table 1.
The MUSIC Inventory Constructs and Their Definitions.
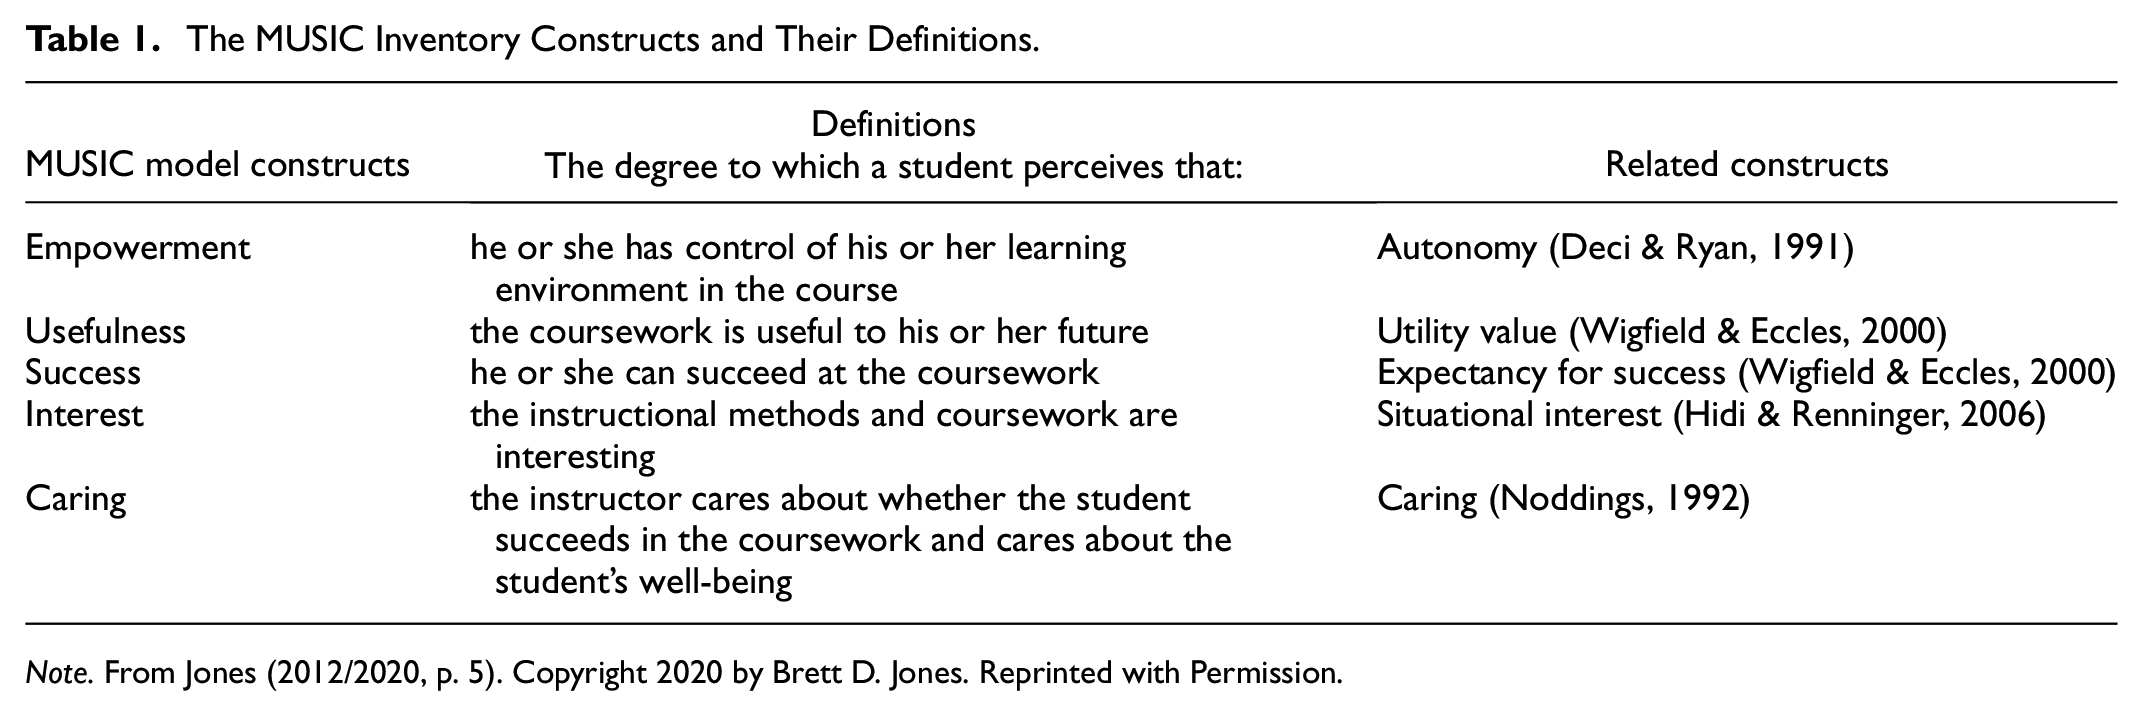
Note. From Jones (2012/2020, p. 5). Copyright 2020 by Brett D. Jones. Reprinted with Permission.
The strengths of the MUSIC Inventory include that it provides a means for instructors to assess students’ perceptions of well-known motivation constructs across theories without having to (a) decipher differences among similar constructs from different theories (e.g., self-concept, ability perceptions, expectancy for success, self-efficacy, need for competence), (b) piece together scales from various theories (which can be problematic because the scales often have different response options and labels), and (c) consider all of the theoretical assumptions that underpin all the theories.
Antecedents and Consequences of Students’ MUSIC Perceptions
Students’ MUSIC perceptions are part of a larger cycle of variables that affect students’ motivation (Jones, 2018). Students’ perceptions in a specific course are affected by both external variables (e.g., instructors’ teaching strategies, family, culture) and internal variables (beliefs, goals, values, emotions, knowledge, abilities), which interact, often in complex ways (see Figure 1). For example, a student with little knowledge of the English language (an internal variable) could be motivated in an English language course if her family (an external variable) encourages her to learn the language and she believes that the class is interesting. That same student could be unmotivated in the course if she does not believe that the activities and assignments in the course (an external variable) are interesting (even though she is supported by her family). These examples demonstrate that regardless of how students’ external and internal variables interact, ultimately, these variables affect their course perceptions, which then affect their motivation and engagement in the course. Figure 1 shows that motivation is also affected by cost/benefit decisions that students make in order to decide if they should engage in the course or in other activities. The extent to which students decide to engage in the course then affects outcomes related to the course (e.g., grades). These outcomes can then cycle back to affect the external and internal variables. For example, students who score highly on a course exam (an outcome) may begin to enjoy the course (an emotion), believe that they are good at that subject (a belief), and set goals to score highly on the remaining course exams.

Antecedents and consequences of students’ MUSIC perceptions in a course.
Students’ MUSIC perceptions in a course are positively related to their motivation and engagement in the course (Author et al., 2014, 2021; Chittum & Jones, 2017; Jones, 2019; Jones & Carter, 2019). In the MUSIC model, motivation is defined as “the extent to which one intends to engage in an activity” (Jones, 2018, p. 5). Engagement is often described as students’ active participation in academic activities and their commitment to their goals and learning (Christenson et al., 2012, p. 816). Engagement is generally considered to be a multidimensional construct that consists of behavioral (e.g., effort), cognitive (e.g., using learning strategies), and affective (e.g., enjoyment) subtypes (Fredricks et al., 2004; Gregory & Korth, 2016). The model in Figure 1 shows that engagement in the course is positively related to students’ outcomes, a finding that has been studied by various researchers in many different domains, such as reading (De Naeghel et al., 2012), mathematics (Ruiz-Alfonso & Leon, 2017), and science (Jang et al., 2012).
A few of the studies that have examined the relationships among all five of the MUSIC perceptions and students’ engagement were conducted in undergraduate courses. For example, in a study of students in an undergraduate personal health course (Jones, 2010), all of the MUSIC components were significantly correlated to students’ behavioral engagement (effort); however, some relationships were more significant than others across gender and the format of the course (a face-to-face or online course). Similarly, Jones (2019) documented positive relationships between the MUSIC components and students’ behavioral engagement (effort) across eight different university courses, but the pattern and magnitude of relationships varied. In a study of students in an undergraduate engineering course (Jones et al., 2014), students’ perceptions of empowerment, usefulness, and interest (not success or caring) were shown to be predictors of students’ effort in the course when all of the MUSIC perceptions were included in the model at once. In another study of students in an undergraduate introductory psychology course (Jones & Carter, 2019), students’ MUSIC perceptions of the course were significantly correlated with their behavioral and cognitive engagement. This study was the first to test a model that included all five MUSIC perceptions, engagement, and learning in one course. The model fit the data adequately and the researchers documented that students’ MUSIC perceptions in a course affect their engagement and learning. In their final model, Jones and Carter (2019) found that only empowerment and usefulness (not success, interest, or caring) were significant predictors of cognitive engagement, which then predicted behavioral engagement and learning. In sum, researchers have begun to document how students’ MUSIC perceptions are related to each other and to other outcome variables such as engagement and learning.
English Language Learning in the Contexts of Iran, Mexico, China, and Egypt
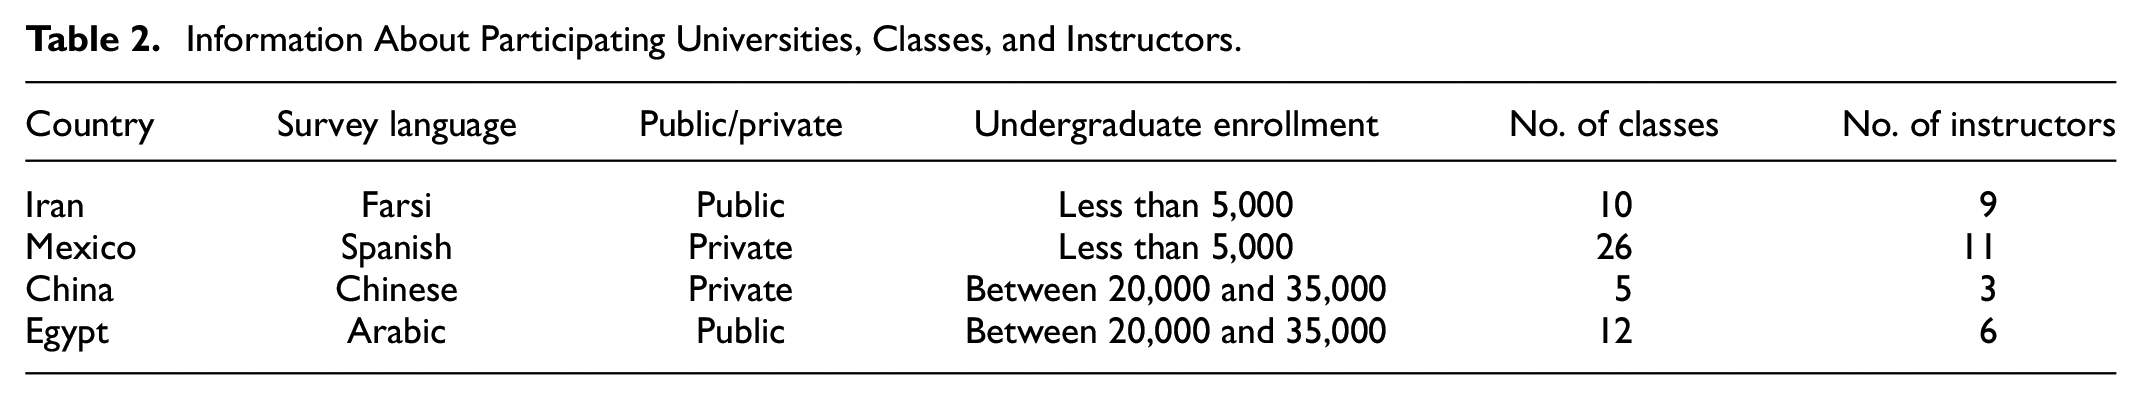
To provide some context for this study, in this section, we provide a brief explanation of EL learning in Iran, Mexico, China, and Egypt because we surveyed students from EL courses in these countries. We chose these countries because they represented a variety of cultures and geographical locations, and English courses are required at universities in these countries. Students are required to enroll in university English classes for at least four semesters in Mexico, China, and Egypt. In Iran, all students have to pass a three-credit course of general English in which students mostly work on reading comprehension, vocabulary, and structure (Khajavy et al., 2018).
Iran
A new EL learning curriculum was implemented in Iran during 2013. Before then, EL learning was mostly a combination of reading passages and conversations, translating them into Persian, and examining the relevant vocabulary and grammar (Khajavy et al., 2016). Less emphasis was placed on oral/aural skills in these classrooms, and often, students were not very competent in speaking and listening skills. After 2013, more emphasis was placed on communicative language teaching and the English textbooks included more speaking and listening activities. Students also had more opportunities to practice conversation and oral skills in the classroom (Khajavy et al., 2018).
Mexico
The Secretariat of Education in Mexico initiated a plan for EL education in 2009 mandating that all students from the third year of kindergarten through the ninth grade (ages 6–15) receive at least 2 hr of English instruction per week (Ramírez-Romero & Sayer, 2016). Consequently, students now complete approximately 1,000 hr of English class during these 10 years. A broader educational reform that occurred in 2013 also led to changes in the pedagogy and curriculum of EL teaching. Specifically, EL teaching was changed from a communicative to a sociocultural approach in which teachers stopped defining the learning objectives in terms of competencies and started teaching the English required for social practices surrounding family, social, work-related situations (Ramírez-Romero & Sayer, 2016). It also shifted the use of materials and learning activities away from grammatical elements and toward project-based approaches.
China
Since 2002, the Chinese Ministry of Education has required Chinese students to enroll in English courses from elementary school to college. In 2004, the Chinese Ministry of Education began requiring a new curriculum in EL courses that included a new communicative language teaching approach to improve undergraduates’ communicative competence, especially in listening and speaking (Ministry of Education, 2004). In addition, the National College English Test was reformed, and the content of the revised listening section was changed to assess the same content and levels as the Test of English as a Foreign Language (TOEFL).
Egypt
Egyptians have taught English in schools since the 1860s and English is now the primary foreign language used in Egypt (Latif, 2017, p. 33). English is taught as a core subject from grades 1 to 12. Since the 1990s, teachers have been encouraged to use communicative language teaching (CLT) approaches (Ministry of Education, 1994, 2000); however, teaching conditions and norms within schools have limited its adoption in classes. As a result, most teachers use traditional, teacher-centered approaches that focus on the structure and forms of language rather than competency and fluency (Ibrahim & Ibrahim, 2017).
Purpose and Research Questions
The aim of this study was to assess the structural and cross-cultural validity of the MUSIC Inventory within EL courses. Specifically, our research question was: Does the MUSIC Inventory demonstrate acceptable psychometric properties and produce valid scores when used in English language courses in four different countries? To assess the validity of the MUSIC Inventory, we examined the internal consistency of each scale (reliability), the inventory content and factor structure (construct validity), and relationships with other variables (criterion validity) (American Educational Research Association [AERA], American Psychological Association [APA], & National Council for Measurement in Education [NCME], 2014). We assessed the internal consistency reliability by computing Cronbach’s α and McDonald’s ω values for each MUSIC Inventory scale. We assessed the construct validity of the MUSIC Inventory by conducting measurement invariance testing with the five inventory scales across the four countries. To investigate the criterion validity of the MUSIC Inventory scales, we examined relationships between these five scales and measures of engagement and achievement, as shown in Figure 2. The MUSIC Model specifies that students’ MUSIC perceptions relate positively to their engagement, and engagement relates positively to their achievement (Jones, 2009, 2018, 2019). However, in any one course, only some of the MUSIC perceptions may be statistically significantly related to engagement and the significant perceptions can be different in different courses (Jones et al., 2014, 2021). Similarly, students’ MUSIC perceptions relate negatively to their disengagement, and disengagement relates negatively to their achievement. Therefore, engagement (and/or disengagement) are hypothesized to mediate the relationship between students’ MUSIC perceptions and their achievement.

Model tested to investigate the criterion validity of the MUSIC inventory scales.
Disengagement is the absence of engagement and is considered to be negatively correlated with engagement. Disengaged students do not put forth much effort, are passive, lack initiative, and/or do not persist at tasks (Skinner et al., 2009). Disengagement has received less attention by researchers than engagement (Martin, 2012) and some researchers have argued that both engagement and disengagement should be investigated in studies related to motivation and achievement (Martin et al., 2012). Consequently, we included a behavioral disengagement construct in our study, which is defined as students’ lack of effort and withdrawal from learning activities (Skinner et al., 2008). We chose to include behavioral disaffection as a closely related construct to disengagement because (a) disaffection has been studied by other researchers (Skinner et al., 2008, 2009), (b) disaffection should not be directly inversely related to engagement (which should be the case for a “true” disengagement construct), and (c) disaffection has been shown to be a predictor of achievement in college courses (Robinson et al., 2017).
Method
Participants
The participants were students enrolled in EL courses at universities located in Iran, Mexico, China, and Egypt (see Table 2 for information about participating universities, classes, and instructors). We selected a smaller and larger public school and a smaller and larger private school because we wanted to include a variety of schools. Near the end of the course, students were asked to complete a two-page questionnaire about to their course perceptions and engagement in the course (see Table 3 for the demographic information about participants). To minimize the chances that students would feel obligated to participate in the study, students were invited to participate in the study by someone other than their instructor. In addition, students were told that only the researchers (not their instructors) would see their responses.
Information About Participating Universities, Classes, and Instructors.
Demographic Information About Participants.

Ethics Statement
The study was conducted in accordance with ethical standards provided by the American Psychological Association (2020). Based on this, when a study has no potential harm for the participants, no informed consent document is given to them or collected from them. In this study, participants were informed that their participation was voluntary and that they would not be compensated for their participation. In addition, data analyses were conducted with anonymous data.
Measures
Students rated all the instrument items using the following 6-point Likert format scale: 1 = Strongly disagree, 2 = Disagree, 3 = Somewhat disagree, 4 = Somewhat agree, 5 = Agree, and 6 = Strongly agree. For the items that had not been previously translated and validated in other languages, we used a rigorous procedure to translate and back-translate the items with native language speakers to ensure the items were accurate representations of the original English versions (Villagran & Lucke, 2005). To ensure that the items were appropriate for the participating students, the items were read by a professor who taught at the same university as the students. All of the items were deemed to be acceptable.
We used the College Student version of the MUSIC® Model of Academic Motivation Inventory (Jones, 2012/2020) to assess students’ MUSIC perceptions. Translations were already published for the Chinese and Spanish versions (Jones, 2012/2020) and the first author of this article provided the Farsi and Arabic versions. The empowerment and usefulness scales include five items each, the success scale includes four items, and the interest and caring scales include six items each. Each of these scales measures students’ course perceptions related to the motivation-related construct shown in Table 1. The following items are examples from the complete inventory, which is available at Jones (2012/2020): “I have flexibility in what I am allowed to do in this course” (empowerment/autonomy), “In general, the coursework is useful to me” (usefulness/utility value), “I am confident that I can succeed in the coursework” (success expectations), “The coursework is interesting to me” (situational interest), and “The instructor cares about how well I do in this course” (caring). Reliability estimates have been found to be excellent in other studies (α = .91 for empowerment, .96 for usefulness, .93 for success, .95 for interest, and .93 for caring in Jones and Skaggs, 2016).
We used an effort construct as a measure of behavioral engagement because it is a common measure of behavioral engagement. We measured effort using the 4-item Course Effort scale that measures the amount of effort that students believe that they are putting into a course (Jones, 2019). An example item is, “In this course, I put forth my maximum effort.” Reliability estimates have been shown to be very good in samples from undergraduate courses (α = .93, .87, .94, .83, and .79 in Jones, 2019; α = .89 in Jones and Carter, 2019; α = .87 in Jones et al., 2021).
We measured behavioral disaffection using a 4-item scale we created by adapting questions from the 5-item scale used in Skinner et al. (2008). The language of the original items had to be adapted for our study to focus the items at the course level, and we modified other language to ensure that the items made sense in English and in the four languages into which we translated it. This behavioral disaffection scale assesses students’ lack of effort and withdrawal from learning activities. The items were: (1) “When I’m in class, I just pretend to be paying attention,” (2) “I don’t try very hard in this course,” (3) “I only do the minimum amount of work required in this course,” and (4) “When I’m in class, I think about things unrelated to the class.”
Students’ final grade in the course was used as the measure of achievement in all the countries except China. In China, the achievement measure was students’ scores on a standardized test that aligned with the content of the National College English Test and was completed by students at the end of the course. Scores were provided on a grading system ranging from 0 to 100 for all of the countries except Iran, which provided a range from 0 to 20. We multiplied the scores from Iran by five to make them comparable with the scores from the other countries (on a scale of 0–100).
Analysis
We ran the analyses using Mplus 7.31 and screened the data prior to running the analyses. We checked missing data, normality, and outliers across all four countries. The rate of missing data was 10.8%, 0.04%, 0%, and 0.01% for Iran, Mexico, China, and Egypt, respectively. To handle missing data, we used imputation by applying an expectation-maximization (EM) algorithm to the data. For normality, we examined skewness and kurtosis values to ensure they were within the range of −2 to +2 (Tabachnick & Fidell, 2007) and found that they were all within the acceptable range for all variables across the four countries. Finally, we examined outliers using standardized Z scores and removed values that did not fall within the range of −3 to +3.
After data screening, we computed Cronbach’s alpha values and McDonald’s omega values to examine the internal consistency reliability of the five MUSIC Inventory scales and used the following criteria to judge the values: greater than .9 is excellent, between .8 and .9 is good, between .7 and .8 is acceptable, between .6 and .7 is questionable, between .5 and .6 is poor, and below .5 is unacceptable (George & Mallery, 2003). We performed measurement invariance testing using multiple group confirmatory factor analysis to assess the construct validity of the MUSIC Inventory. We used this procedure to determine whether participants from different cultures responded to the items differently. Using a stepwise procedure, we checked for measurement invariance. The first step is called configural invariance and it tests whether the same number of items and factors hold across the four groups. Then, we examined the metric invariance to test whether the same factor loadings were found across the four groups. Finally, we investigated the scalar invariance to test whether the intercepts and factor loadings were the same across the four groups.
We used Chen’s (2007) recommendations for goodness of fit indices to test the three levels of invariance. For configural invariance, goodness of fit indices included comparative fit index (CFI), root mean square error of approximation (RMSEA), and standardized root mean square residual (SRMR). To have an acceptable configural model, CFI should be ≥.90, and RMSEA and SRMR should be ≤.08 (Hu & Bentler, 1999; Marsh et al., 2004). However, these cut-off values are somewhat arbitrary and should not be considered as the sole basis for accepting or rejecting a model (Marsh et al., 2004). For testing metric invariance, when sample size is adequate (total N > 300), a change of .010 or lower in CFI supplemented by a change of .015 or lower in RMSEA or a change of .030 or lower in SRMR would indicate invariance (Chen, 2007). For testing scalar invariance, a change of .010 or lower in CFI supplemented by a change of .015 or lower in RMSEA or a change of .010 or lower in SRMR would indicate invariance. To examine the criterion validity of the five MUSIC Inventory scales, we tested the path model shown in Figure 2 for which the relations among MUSIC perceptions, behavioral engagement, behavioral disaffection, and achievement were examined across the four countries. We used an alpha level of .05 for all of the statistical tests.
Results
Descriptive Statistics, Correlations, and Scale Reliabilities
Table 4 includes the means, standard deviations, Cronbach’s alphas, and McDonald’s omega values for all of the variables assessed in the four countries. Typically, the means for the MUSIC and engagement variables ranged from about four (somewhat agree) to five (agree). The means for achievement were about 70, although the mean in China was lower (60.0). The Cronbach’s alpha and McDonald’s omega values for the seven variables were acceptable across all four countries, ranging from .62 to .92 and .63 to .92, respectively (George & Mallery, 2003); thus, providing evidence for the internal consistency reliability of MUSIC Inventory scales.
Descriptive Statistics and Scale Reliabilities for the Study Variables from Iran, Mexico, China, and Egypt.

Note. The numbers are presented in the order of Iran, Mexico, China, and Egypt. All scales range from 1 (strongly disagree) to 6 (strongly agree) except achievement, which ranges from 0 to 100.
All of the MUSIC components were positively correlated with behavioral engagement for all four countries (see Table 5). The correlations ranged from .27 to .67 and all of them were statistically significant (p < .001). The MUSIC components and behavioral disaffection were negatively correlated, and the correlations ranged from −.05 to −.58 (see Table 5). Many of these correlations were statistically significant, but some of them were not and none of them were significant in Egypt. The fact that the MUSIC components were positively related to engagement and negatively related to disaffection provides evidence for the criterion validity of the MUSIC Inventory (Jones, 2009, 2018, 2019). The correlation matrices among all variables and across the four countries are provided in the Supplemental Appendix (Tables A, B, C, and D).
Correlations Among Variables for Iran, Mexico, China, and Egypt.

Note. The numbers are presented in the order of Iran, Mexico, China, and Egypt.
p < .05. **p < .01. p < .001 values are shown in bold.
All of the MUSIC components were positively correlated with achievement in Iran and Egypt. None of the MUSIC components were significantly correlated with achievement in Mexico or China, except that success was positively correlated with achievement in Mexico and caring was negatively correlated with achievement in Mexico.
Behavioral engagement and disaffection were negatively correlated with each other as expected, and the coefficients ranged from −.18 to −.58. Engagement was positively correlated with achievement in all countries except for China. Disaffection was negatively correlated with achievement in Iran and Egypt, but not significantly correlated with achievement in Mexico or China.
Measurement Invariance Testing
The configural model indicated an adequate fit to the data (see Table 6); however, the CFI value of .899 was borderline acceptable given that it should be greater than or equal to .90. These results imply that the same number of factors and items held across all four countries. The metric invariance was also supported (ΔCFI < .010, ΔRMSEA < .015, ΔSRMR < .030) implying that the same factor loadings were found across the four countries and that items were of the same importance for all four countries. Finally, scalar invariance was confirmed (ΔCFI < .010, ΔRMSEA < .015, ΔSRMR < .010) implying that intercepts and factor loadings are the same across the four countries (see Supplemental Appendix Tables E, F, and G for more results of the measurement invariance testing). Although some of these values are borderline acceptable, taken as a whole, they provide evidence for the construct validity of the MUSIC Inventory scales.
Measurement Invariance Tests of the MUSIC Constructs Across the Four Countries.

MUSIC Perceptions, Engagement, Disaffection, and Achievement
To examine the criterion validity of the MUSIC Inventory, we first tested a structural equation model (SEM) with latent variables in which the MUSIC variables were related to behavioral engagement and disaffection, and they were in turn related to achievement (as shown in Figure 2). We ran a single model for all four countries simultaneously, but this model did not produce adequate fit indices (χ2 = 5,123.45, df = 2,341, CFI = .818, RMSEA = .069, SRMR = .119). Therefore, we ran the model using path analysis and the goodness of fit indices indicated that the model fit the data adequately (χ2 = 79.83, df = 20, CFI = .93, RMSEA = .11, SRMR = .05). The MUSIC components accounted for 45.4%, 41.4%, 47.5%, and 44.1% of the variance in behavioral engagement and 6.8%, 21.9%, 31.8%, and 1.9% of the variance in disaffection for Iran, Mexico, China, and Egypt, respectively. Moreover, the model accounted for 12.3%, 4.4%, 0.4%, and 7.1% of the variance in achievement for Iran, Mexico, China, and Egypt, respectively.
Results for each path of the path analysis are provided in Table 7. For the relationships between the MUSIC perceptions and behavioral engagement, success was positively related to behavioral engagement for all four countries (Iran β = .22, p < .05; Mexico β = .31, p < .001; China β = .20, p < .01; Egypt β = .18, p < .05). Interest was positively related to behavioral engagement for all countries except for Iran (Mexico β = .36, p < .001; China β = .62, p < .001; Egypt β = .25, p ≤ .001). Empowerment (β = .23, p < .05) and caring (β = .23, p ≤ .001) were positively related to behavioral engagement only for the Iranian and Egyptian data, respectively. Usefulness was not related to behavioral engagement for any of the four countries. Behavioral engagement was positively related to achievement for all countries except for China (Iran β = .29, p < .001; Mexico β = .21, p < .01; Egypt β = .20, p < .01).
Students’ MUSIC Perceptions Predicting Achievement, Mediated by Behavioral Engagement and Disaffection, for Four Countries.

Note. Statistically significant relationships are shown in bold.
For the associations between the MUSIC perceptions and disaffection, success was negatively related to disaffection for two countries (Iran β = −.27, p ≤ .001; Mexico β = −.16, p < .01), interest was negatively associated with disaffection for two countries (Mexico β = −.50, p < .001; China β = −.58, p < .001), and caring was positively related to disaffection in Mexico (β = .15, p < .05). Empowerment and usefulness were not related to disaffection for any of the four countries. Disaffection was negatively related to achievement in Egypt (β = −.15, p < .05).
We also performed mediation analysis to examine how MUSIC perceptions were indirectly related to achievement through behavioral engagement and disaffection. Results indicated that success was indirectly related to achievement through behavioral engagement for the Mexican (β = .067, p = .02) participants. Interest was indirectly related to achievement through behavioral engagement for the Mexican (β = .08, p = .02) and Egyptian (β = .05, p = .03) participants. Caring was indirectly related to achievement through behavioral engagement only for the Egyptian (β = .05, p = .04) participants. Empowerment was indirectly related to achievement through behavioral engagement only for the Iranian (β = .068, p = .04) participants.
Discussion
The aim of our study was to determine whether the MUSIC Inventory produced valid scores in university EL courses across four different countries. In this section, we examine the results related to the internal consistency reliability, construct validity, and criterion validity of the MUSIC Inventory scales.
Internal Consistency Reliability of the MUSIC Inventory
We computed two measures of internal consistency reliability for the MUSIC scales: Cronbach’s alpha and McDonald’s omega (see Table 4). Based on George and Mallery’s (2003) criteria, 19 of the 20 alpha values and 19 of the 20 omega values were acceptable. Only the values for empowerment in China were “questionable” (α = .62, ω = .62). The alpha values are similar to, but a little lower than those obtained in samples of university students in the U.S. (Jones & Skaggs, 2016, M α = .91, U α = .96, S α = .93, I α = .95, and C α = .93), Colombia (Author et al., 2017, Spanish translation, M α = .88, U α = .93, S α = .91, I α = .95, and C α = .92), and China (Author et al., 2017, Chinese translation, M α = .82, U α = .89, S α = .87, I α = .93, and C α = .88). Nonetheless, almost all of the reliability indices were found to be acceptable, which provided one indicator of validity for the scores produced by the MUSIC Inventory.
Construct Validity Evidence for the MUSIC Inventory
To investigate the construct validity of the MUSIC Inventory scales, we used multiple group confirmatory factor analysis and assessed the measurement invariance of the scales across the four countries. Because the configural, metric, and scalar invariance held across the four countries (see Table 6), we determined that the five scales in the MUSIC Inventory function similarly across the four countries. It is noteworthy, however, that some of the values were slightly less than ideal. For example, the CFI values were borderline acceptable, as were the SRMR values for the metric and scalar invariance. However, the RMSEA values and change in CFI, RMSEA, and SRMR were all acceptable. Therefore, taken as a whole, these findings provided construct validity evidence for the use of the MUSIC Inventory in these EL courses.
Criterion Validity Evidence for the MUSIC Inventory
The MUSIC model theory specifies that students’ MUSIC perceptions relate positively to their engagement, and engagement relates positively to their achievement. Similarly, students’ MUSIC perceptions should be negatively related to their behavioral disaffection, and behavioral disaffection should be negatively related to student achievement. Therefore, if these relationships are shown to exist in each of the four countries, it would provide a measure of criterion validity for the MUSIC Inventory scales. We found that students’ MUSIC perceptions were statistically significantly correlated positively with engagement in all of the countries, and engagement was correlated positively with achievement in all of the countries except for China (see Table 5). In addition, students’ MUSIC perceptions were statistically significantly correlated negatively with disaffection in all of the countries except Egypt and for usefulness and caring in Iran. Therefore, with few exceptions, these findings provided criterion validity evidence for the MUSIC Inventory scales.
It is noteworthy that disaffection was not correlated with any of the MUSIC perceptions in Egypt, especially given that these correlations were significant for the other countries (except for usefulness and caring in Iran). One explanation may be that the measure of disaffection in Egypt was inadequate. Cronbach’s alpha value for disaffection was .62 in Egypt, which is considered questionable (George & Mallery, 2003). The translation of this scale had not been used in prior studies and it is possible that the translation was not very accurate; thus, resulting in a less accurate measure of disaffection.
Ideally, the model in Figure 2 would have achieved acceptable fit with the SEM and latent variables, but it did not, possibly for several reasons. First, the model in Figure 2 is a simplified representation of the MUSIC model because the purpose of this study was to assess the psychometric properties of the MUSIC Inventory, not to test the MUSIC Model of Motivation. The more complete MUSIC model in Figure 1 shows how cost/benefit decisions also affect students’ motivation and engagement, but a cost variable was not included in the present model. Although the lack of fit could signify a problem endogenous to the model, a recent study that tested this same model with undergraduate students and included a cost variable achieved acceptable fit using SEM and latent variables (Jones et al., 2021). Additionally, the MUSIC model can include any types of engagement (e.g., behavioral, cognitive, affective, agentic), yet we only included a measure of behavioral engagement. Therefore, it seems more likely that the poor fit is due to not including the appropriate variables to test the MUSIC model. Future studies testing the MUSIC model (as opposed to the MUSIC Inventory), should include cost and consider other moderators, such as course ease (Jones et al., 2021).
Other possible reasons for the lack of acceptable fit for the SEM model may have been related to the measurement of the constructs and collection of the data. For example, students self-reported their behavioral engagement. A potentially more accurate measurement of students’ engagement, such as the use of observations (e.g., Skinner et al., 2009), may have led to a better fitting model. In addition, although we tried to standardize procedures across data collection sites, using different survey administrators in different types of courses at different times likely led to some non-standardization during the survey administration. These limitations highlight a few of the difficulties in conducting a study with limited resources in multiple countries.
Nonetheless, using path analysis for the model shown in Figure 2, the goodness of fit indices were acceptable and students’ MUSIC perceptions accounted for 41.4% to 47.5% of the variance in behavioral engagement in all countries and 1.9% to 31.8% of the variance in disaffection. Engagement and disaffection accounted for 0.4% to 12.3% of the variance in achievement. In comparison to other studies, the magnitude of the relationship between engagement and achievement in the present study (β = .29 for Iran, .21 for Mexico, and .20 for Egypt) is typical of β values documented in other studies between engagement and achievement (Reeve et al., 2020, noted that β values typically range from .00 to .30). These findings demonstrate that students’ MUSIC perceptions in English courses are important predictors of their engagement, and to a lesser extent disaffection, and provides evidence of criterion validity for the MUSIC Inventory.
Although all the MUSIC scales were positively correlated with engagement, and most of MUSIC scales were negatively correlated with disaffection (except in Egypt), when these variables were included in the full model, not all the path coefficients from MUSIC to engagement and from MUSIC to disaffection were significant (as shown in Table 7). We did not expect all of the MUSIC variables to be significantly related to engagement and disaffection because prior studies have also found that only some MUSIC perceptions are related to engagement when all of the variables are included in one model (e.g., Jones et al., 2014, 2021). However, all of the variables must be included in the model because it is unknown which ones may be most significant. Across countries, success and interest were the best predictors, as success predicted engagement in all four countries and success predicted disaffection in Iran and Mexico. Interest predicted engagement in all countries except Iran, and interest predicted disaffection in Mexico and China. Empowerment and caring predicted engagement in only one country and usefulness did not predict engagement in any country. Empowerment and usefulness did not predict disaffection in any country and caring predicted disaffection only in Mexico. The MUSIC variables that were significantly related to engagement were different from the patterns documented in other studies. For example, in an undergraduate engineering course, empowerment, usefulness, and interest (and not success or caring) were significant predictors of behavioral engagement (Jones et al., 2014). In another study of an undergraduate geography course, interest and caring (and not empowerment, usefulness, or success) were significant predictors of behavioral engagement (Jones et al., 2021). The fact that the predictors of engagement differ across studies suggests that instead of combining courses together as we did in the present study, it could be helpful to study courses individually to determine the relationships among the variables.
Although success and interest were the best predictors of engagement and disaffection, these findings do not imply that the other three MUSIC perceptions are unimportant. Students’ MUSIC perceptions were significantly correlated with engagement and disaffection across all countries except Egypt (and usefulness and caring in Iran). The reason that some of these correlations were not significant predictors of engagement in the path model was that the MUSIC perceptions were correlated with one another and this model controls for the shared variance among the MUSIC perceptions. Therefore, although some of the MUSIC perceptions were not predictors of engagement in the model, they may affect some of the other MUSIC perceptions that are significant predictors of engagement. Other studies have documented these types of interactions among constructs. For example, success expectancies have been found to moderate the effects of utility value on situational interest and performance (Durik et al., 2015). Further research is needed to examine exactly how students’ MUSIC perceptions are related in EL courses, such as whether some perceptions moderate other perceptions.
The purpose of this study was not to determine why differences existed across countries, but nonetheless, we offer a few possibilities for these differences and suggest that researchers study these speculations in the future. One reason that empowerment was a significant predictor of engagement in Iran (but not in the other countries) may be that Iran is a more individualistic society than the other countries in the study (ratings on individualism were Iran = 41, Mexico = 30, Egypt = 25; China = 20; Hofstede Insights, 2021). In individualistic societies, individuals are expected to be more autonomous and care mostly for themselves and their immediate families (Hofstede, 2011). In contrast, in collectivist societies, individuals are expected to be less autonomous and more integrated into cohesive groups. Therefore, Iranian students may put forth more effort when they perceive the class to provide more autonomy because they expect more autonomy. Autonomy (empowerment) seems to be more important to Iranian students than interest, which was not significantly related to engagement. Thus, teachers may be more likely to increase Iranian students’ effort by providing more autonomy rather than trying to make the courses more interesting.
In examining the relationships between engagement and achievement, it is notable that engagement was significantly related to achievement in all the countries except for China (see Table 5). In fact, none of the variables in the study were significantly correlated with achievement for China. We believe that this can be explained by the fact that the achievement measure used in China was a standardized test, whereas the achievement measure in the other countries was the final course grade. A student’s final course grade is dependent on their engagement in course activities (e.g., assignments, class participation, attendance), while standardized test scores are a result of a student’s abilities, which can be based on factors unrelated to their engagement in a particular course (e.g., their prior ability, test content that was not covered in the course). The use of a standardized test as the achievement measure in China may also explain why the scores in China were 9 to 15 points lower than the scores in the other three countries (see Table 4).
Limitations and Future Research
The results must be interpreted within the limitations of the study. First, the data collected in this study were self-reported, which are susceptible to a variety of response biases. For example, students may have felt obligated to respond in a certain manner while completing the survey during class, or they may have selected some responses because they believed that those responses were more desirable than others. Second, this study included several courses and instructors at each university, which should permit some level of generalizability for EL courses. However, further studies are needed to examine the extent to which these findings generalize across other types of EL courses and at other universities and countries. Third, this study was designed to examine the validity evidence for using the MUSIC Inventory in English as a second or foreign language courses within different countries; it was not designed to explain why differences between countries occurred. Future studies could collect data related to the teaching approaches, students’ study strategies, and measures of achievement, to determine whether differences in these factors affect the relationship between engagement and achievement. Fifth, it is possible that the act of surveying students about their course perceptions affects their course perceptions. For example, maybe the students perceived the instructor to be more caring because they took the time to survey students about their perceptions of the course. Sixth, using final course grades as the measure of achievement in three of the countries was a limitation because the grades in these 48 classes were likely based on different criteria depending on the assignments and tests given in the classes. Future studies could implement a more accurate measure of learning in each of the classes.
Implications and Conclusions
Taken as a whole, the results indicate that the MUSIC Inventory can be used to assess students’ motivation-related perceptions in EL courses because the inventory produces valid scores. We provided validity evidence related to the internal consistency of each scale (reliability), the inventory content and factor structure (construct validity), and relationships with other variables (criterion validity) (AERA, APA, & NCME, 2014). The evidence of internal consistency reliability was very good, the evidence of construct validity was acceptable but not ideal, and the evidence of criterion validity using path analysis was adequate. The fact that students’ MUSIC perceptions predicted over 40% of the variance in students’ behavioral engagement is a significant indicator of the criterion validity of the inventory scores. Although some of the fit indices were not ideal, we believe that the evidence is encouraging, especially given that the sample included many different classes (53 total) and instructors (29 total) from four different countries in different parts of the world where the survey was administered by different people.
One implication is that instructors may use the inventory to assess students’ perceptions in order to improve the design of their courses. To do so, instructors can use the inventory to identify MUSIC perceptions that students rate the lowest. Then, they can consider instructional strategies that lead to increases in these student perceptions. There are many ways to increase students’ MUSIC perceptions and instructors are not limited to any one instructional approach (see Jones, 2018, for example strategies). These results also suggest that if instructors use instructional strategies that increase students’ MUSIC perceptions, they may also increase students’ engagement and reduce their disaffection in their English courses.
The MUSIC Inventory could also be used to compare student perceptions across courses. For example, a foreign language department at a university may administer the MUSIC Inventory in all of their courses near the end of a semester. Then, they could compare the results across courses to identify patterns of strengths and weaknesses related to students’ perceptions. Similarly, the inventory could be used over time to assess changes in courses across different semesters. The results would allow instructors and administrators to determine the effects of instructional changes that were implemented over time. The inventory could also be administered several times within a course to examine changes in students’ perceptions over the duration of a semester. These findings could be used to determine the effects of specific teaching strategies on students’ MUSIC perceptions.
Researchers can use the MUSIC Inventory to examine students’ motivation-related perceptions in EL courses in order to better understand interactions among the MUSIC constructs and other variables (e.g., engagement, achievement). For example, research is needed to understand whether some of the MUSIC constructs moderate the effects of others on engagement or achievement. Intervention studies (e.g., Durik et al., 2015; Hulleman et al., 2017) have been useful in identifying these types of interactions and could be useful within the context of EL courses as well.
In sum, the MUSIC Inventory can be used in a variety of ways to provide results that allow instructors, administrators, and researchers to make data-driven decisions. Hopefully these decisions will lead to improved EL instruction, greater student achievement, and higher-quality research.
Supplemental Material
sj-docx-1-sgo-10.1177_21582440231156583 – Supplemental material for Examining the Cross-Cultural Validity of the MUSIC Model of Academic Motivation Inventory in English Language Courses
Supplemental material, sj-docx-1-sgo-10.1177_21582440231156583 for Examining the Cross-Cultural Validity of the MUSIC Model of Academic Motivation Inventory in English Language Courses by Brett D. Jones, Gholam Hassan Khajavy, Ming Li, Hanaa Ezzat Mohamed and Peter Reilly in SAGE Open
Footnotes
Declaration of Conflicting Interests
The author(s) declared no potential conflicts of interest with respect to the research, authorship, and/or publication of this article.
Funding
The author(s) disclosed receipt of the following financial support for the research, authorship, and/or publication of this article: The Virginia Tech Open Access Subvention Fund paid the publication fees for this article.
Ethics Statement
The study was conducted in accordance with ethical standards provided by the ![]() . Based on this, when a study has no potential harm for the participants, no informed consent document is given to them or collected from them. In this study, participants were informed that their participation was voluntary and that they would not be compensated for their participation. In addition, data analyses were conducted with anonymous data.
. Based on this, when a study has no potential harm for the participants, no informed consent document is given to them or collected from them. In this study, participants were informed that their participation was voluntary and that they would not be compensated for their participation. In addition, data analyses were conducted with anonymous data.
Supplemental Material
Supplemental material for this article is available online.
References
Supplementary Material
Please find the following supplemental material available below.
For Open Access articles published under a Creative Commons License, all supplemental material carries the same license as the article it is associated with.
For non-Open Access articles published, all supplemental material carries a non-exclusive license, and permission requests for re-use of supplemental material or any part of supplemental material shall be sent directly to the copyright owner as specified in the copyright notice associated with the article.