
Abstract
In Korea, there is a big difference in the rise and fall of apartment prices by region, so it is expected that there will be differences in regional economic indexes. So, to capture the housing market conditions, we developed the housing cycle by using the factor-augmented vector autoregressive model (FAVAR). In addition, we estimated the impacts of the Korean government’s housing policies on the housing cycle. The first is a net policy effect model, and the second is a comprehensive model with macroeconomic variables and regional variables. To estimate the effects of the policies, we considered financial, tax, and housing transaction policies. In the net policy effect model, we found that all policies, including an increase in the DTI (debt to income) ratio, the LTV (loan to value) limit, an acquisition tax reduction, a transfer tax deregulation, deregulation of the housing subscription policy, and a housing purchase right transfer, impacted the housing cycles at the period t − 1. This is why the Korean government announced policy enforcement in advance a month ago before policy implementation. In the comprehensive model, we found that the policies had statistically significant effects on housing cycles at the period t − 1, and we also found that the regional variables had an influence on the housing cycle. Therefore, the Korean government should consider the regional characteristics and time lag when it attempts to intervene in the housing market.
Keywords
Introduction
According to the Survey of Household Finances and Living Conditions (SFLC, 2018) in 2018, 70.2% of the total assets of Korea is real estate. Therefore, Koreans have a high level of interest in real estate economic fluctuations. However, there is no housing market cycle in which we can know the fluctuations in the housing market. In Korea, three types of housing price indices (Housing Sales Price Index by the Korean Real Estate Board, Transaction-based Apartment Price Index by the Korean Real Estate Board, and Housing Price Index by Kookmin Bank) have been announced, but the housing cycle has not been released.
And the housing market depends on the location and regional economic conditions within a country. This is because the diversity of the housing market by region is grounded in the difference between the location and regional economic factors (European Central Bank, 2003). Therefore, there is a need for housing cycles by region to understand the housing market situation in each region.
To this end, we seek to develop the regional housing cycles according to 16 metro regions in Korea by using a factor augmented vector autoregressive model (FAVAR) proposed by Bernanke et al. (2005); we will analyze the regional heterogeneity and show these results. The reason why we made the regional housing cycles using the above methodology is that we sought to get an index that only reflected information related to the real estate sector. Hence, we tried to minimize omitted variable bias. Duffie et al. (2009) indicate strong evidence that there are common latent factors, and Aron and Muellbauer (2016) emphasize the role of latent factors when we model and forecast mortgage delinquency and foreclosure. Most studies focusing on urban growth have suggested housing market variables. However, we bring up a new approach for summarizing the housing market dynamics of cities, which has focused on some measure of the average growth of a single variable or the price over a given period. We explain this point in more detail in the methodology section.
Also, The Korean government has used various policies to solve problems that are inherent in the real estate market, particularly the problem of rising and falling real estate prices. Therefore, the current study intends to analyze whether the effects of the various real estate policies used by the Korean government since 2007 exist and to analyze whether there are policy time lag effects. This is very crucial because the result has many implications for when the government makes policies and implements them.
To summarize our research objectives, unlike previous studies, the present study is not only going to estimate the housing cycle by using a FAVAR model but also to analyze whether there are policy effects of the Korean governments policies during the analysis period. In addition, if there are any policy effects, we will estimate the time lag of the policy effects.
In the rest of the current paper, we review previous studies and explain the data and methodologies. Then, we will show the housing cycle and analyze the impact of the Korean government’s housing policies on the housing cycle. Finally, we will present policy implications.
Literature Review
Because there are no previous studies that have empirically analyzed the policy effects of the housing cycle, we reviewed previous studies similar to the current study. First of all, it is very important to generate a housing cycle to show the state of the housing market. The inverse relationship between housing supply elasticity and a severe economic downturn can be found in recent reports by Glaser et al. (2008), Mian et al. (2013), and Mian and Sufi (2014). Glaeser et al. (2008) showed that regions with housing supply inelasticity are vulnerable to boom and bust housing cycles. Mian et al. (2013) tried to find the changes in household consumption and wealth at the country and Zip code levels. To do this end, they documented the percent change in household net worth at the Zip code level between 2006 and 2009 that comes from the collapse in house prices, what they called the housing net worth shock. The results show a large effect of housing net worth shocks on consumption, with a reduction in spending of 5 to 7 cents for every $1 of housing wealth loss. Also, they show the most important finding that the average marginal propensity to consume (MPC) differs significantly across Zip codes by both income and leverage, and these two effects are independents of one another. The research results of Glaeser et al. (2008) and Mian et al. (2013) have shown that regions with an inelastic housing supply are more likely to experience a massive decline in housing net worth and a sharp decline in consumption expenditure, meaning that the regions that have inelasticity in their housing supply are more sensitive and vulnerable to recessions.
Moreover, since the late 1960s in Korea, house prices have shown a distinct spatial pattern over a continuous cycle (Kwon et al., 2019; Lee, 2016). The three essential key characteristics of the data can be summarized as follows: (1) the geographic characteristics of regional home prices weighed far more heavily than income; (2) the difference in housing prices in northern and southern Seoul widened in the 1980s but narrowed again in the 1990s; and (3) in particular, the Gangnam district in Seoul has been leading the housing cycle.
There is a propensity for housing prices that we call the ripple effect. If the house prices in the Gangnam district rise, those of other areas also gradually do. These movements may have significant short-term fluctuations in local prices, but from a long-term point of view, housing price patterns tend to be reach an equilibrium. Therefore, a methodology is needed to capture these properties. When we reviewed the previous studies, the housing prices in the metropolitan area (Seoul, Incheon, and Kyunggi areas) have influenced the housing prices of other regions, which is called an inter-regional effect.
Meen (1996) established an econometric framework to find the nature of spatial interactions between local housing markets. The main ideas were spatial dependence and coefficient heterogeneity. Spatial dependence shows the degree to which markets are interconnected. For example, the UK housing market may very well reflect a series of interconnected regional markets rather than a single nationwide market. Heterogeneity can reveal the extent to which structural differences exist in local markets. Structural differences can arise for a few reasons; households are likely to differ in both their behavior and composition, and housing supply varies from region to region. For instance, the types of mortgage debt vary by household and by region. Also, the home ownership rate and planning constraints vary by region. All of these factors affect the coefficients of any estimated model.
Hence, to understand the entire Korean housing market situation, we have attempted to develop the Korean housing cycle by using a new methodology that shows the regional housing cycles.
The most important goals of the housing policy have been to alleviate housing shortages and stabilize housing prices. To achieve this, governments have been implementing many housing policies, tax policy, financial policy, and transaction rules etc. However, we have to evaluate whether they have met their goals. There are not many papers on the effects of housing policies. Only a few studies have empirically analyzed the effects of policies, even though many researchers and policymakers have interests in the impacts of housing policy. Buckley and Schwartz (2011) referred to U.S. housing policies and local programs; they reported that national policies have a key role in composing the countrys housing markets and insisted on the problem of increasing housing costs and having opportunities for the poor. The authors described the housing finance, tax systems, and state and local government programs based on a close collaboration of nonprofit organizations. They also referred to the pros and cons of U.S. housing policy and developing role of subnational governments. Yu and Chen (2018) analyzed housing policy influence on the house prices and mortgage rate in Taipei City. Their results showed that a 1% increase in mortgage rates reduced housing prices from 5% to 17%. The actual price registration policy contributes to a decrease in housing prices by 4% to 29%. Shin and Yi (2019) analyzed the responses of housing policies in Korea. To stabilize the housing market in the Seoul metropolitan area (SMA) and contain the rapid buildup of household debt, the Korean government has instituted comprehensive and tailored policy responses since the second half of 2017. The governments sweeping responses cover many different areas, including macroprudential, housing, and tax policies. Because of these policies, the rapid buildup of household debt has recently slowed.
As we have already mentioned, no research has estimated comprehensive policy effects by considering all of the financial policy (LTV and DTI), tax policy (acquisition tax and transfer tax), and housing transaction regulation policy (resale system and subscription system). The current study is significant in that it comprehensively considers not only individual policy effects, but also the time lag effects of policies. In conclusion, to the best of our knowledge, this study is the first to analyze the overall policy effects.
Data
This section describes our estimated systematic factor describing the Korea housing cycle, which is based on 10 real estate variables. The analysis period of is 122 months from September 2007 to October 2017.
Panel A in Table 1 shows the definition and sources of the
Data Description.
Panel A.
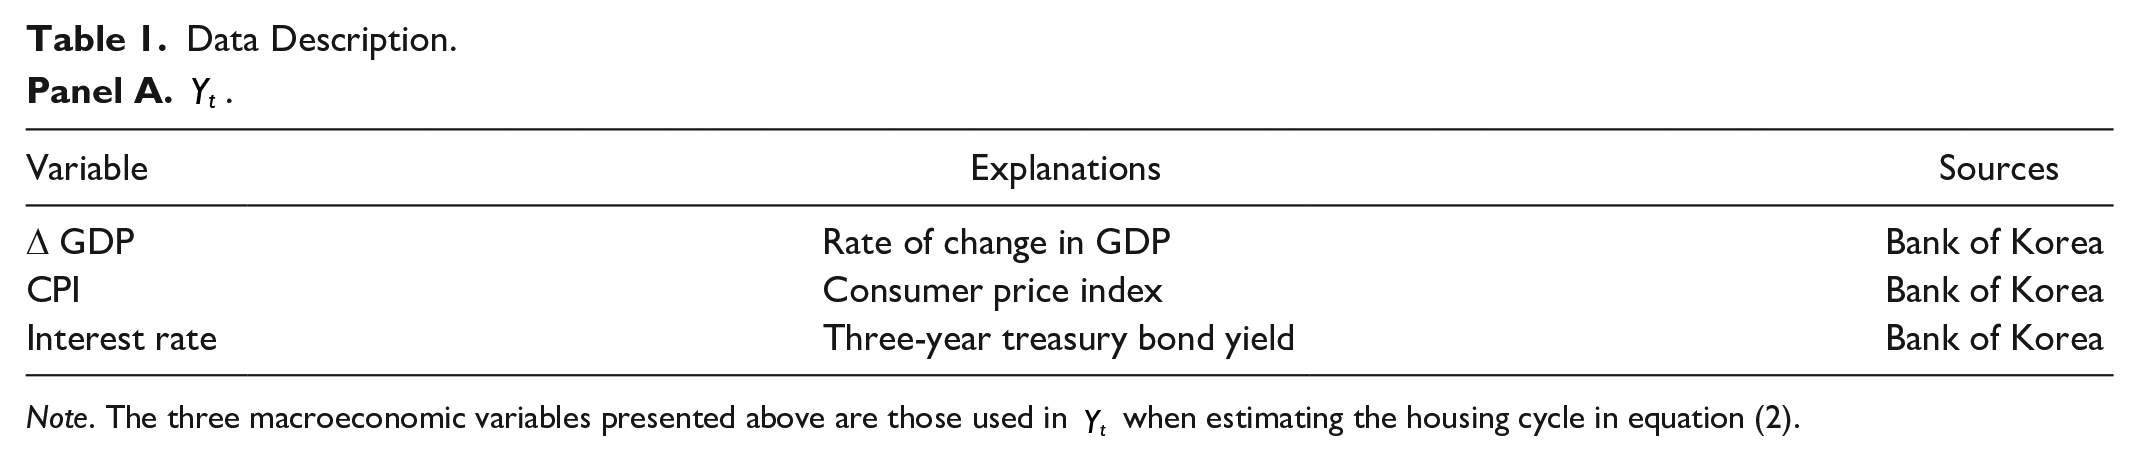
Note. The three macroeconomic variables presented above are those used in
Panel B.

Note. The macroeconomic variables presented above are those used in
To find those heterogeneities across cities, we use a direct method by making housing indices using a set of 16 metro provinces. To do so, we used a factor model, here following a common practice in building the index. Specifically, our model is based on the FAVAR approach suggested by Bernanke et al. (2005). By using this model, we can remove the impacts of macroeconomic conditions from the housing market cycle and estimate the information and effect solely associated with the real estate sector.
Housing cycles can help us understand the regional housing market conditions, allowing researchers and policymakers to know the significant differences in housing activities across a nation. In this regard, housing cycles will be a credible source of data on housing and economic activities because we can analyze critical economic relations with greater precision. Housing cycles are similar to those in Ghent and Owyang (2010), Mian et al. (2013), Mian and Sufi (2014), and Kiley (2015).
We can get several intriguing experimental opportunities in the Korea housing market because of its unique characteristics. Residential properties nearly dominated the Korean real estate market in 2012; here, 49.1% of all real estate transactions, including the sale of commercial buildings and lands, were accounted for in homes and apartments. Korea is starting to form a bubble in the real estate market because housing transactions have soared nationwide because of the record low-interest rate and low-interest mortgage loans. In addition, the belief of real estate investment is the best investment has deeply been embedded in Korean people. High-rise apartments in Korea are a symbol of the urban middle class and show success and wealth in life, signifying the rise of Koreans living conditions. An important feature of the Korean housing market is that the government frequently intervenes to stabilize housing prices. Housing supply has been very inelastic because of various regulations, which have a great influence on housing demand.
Unlike the monetary economic applications that contain all the macro variables, we used a methodology utilizing real estate variables for the economically meaningful metropolitan statistical areas (MSAs) and provinces level with discretion.
We selected real estate variables based on the four quadrants model of DiPasquale and Wheaton (1996) instead of aggregating all possible real estate variables. These four quadrants are rent, price, construction, and stock. Doling (1999) also noted that as a housing system naturally involves political, economic, and socio-demographic dimensions and that there is an array of determinants affecting the system, which in turn influences the contextual factors. By inferring information from a set of real estate market variables, we endeavor to explain Korean local housing markets from multifaceted perspectives, especially from a various geographic perspectives and from a spatial dependence perspective.
As mentioned before, the Korean government has been implementing various policy measures to correct market failures, stabilize the housing market, and ensure housing welfare. The government has enforced housing policies by taking economic situations into account. To confirm the effects of the housing policies on the housing market, we divide housing policies into mainly three parts. The Korean government has been combining one or two of these policies to stabilize the housing market (see Appendices B and C for the changes in housing policies and types of housing policies used by the Korean government).
Table 2 gives a summary of the information on the model variables. As shown, the average GDP was KRW 1,428 trillion ($1.2 trillion), and the average rate of treasury bonds (3 years) was 3.12%. The average land price fluctuation rate was 0.14%, an average construction permit was 45,52 unit and the average mortgage rate was 4.46%.
Description of the Statistics.
Panel A.
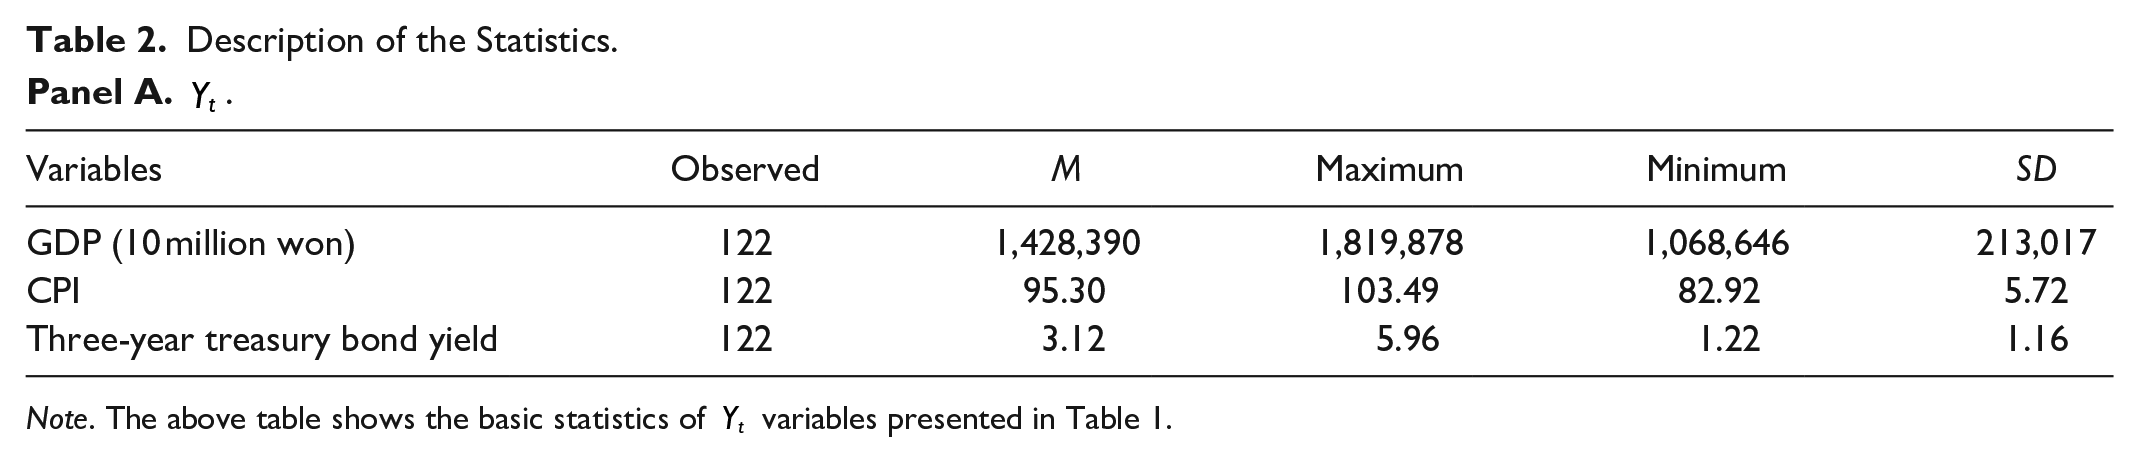
Note. The above table shows the basic statistics of
Panel B.

Note. The above table shows the basic statistics of
Methodology
In this section, we describe our methodology to estimate the systematic factors created by the housing cycles. Since the time when Sims (1980) proposed a vector autoregression (VAR) model, this method has been an essential tool in applied macroeconomics. In previous studies, the VAR model has been competitive in forecasting (Babura et al., 2010; Carriero et al., 2009, 2011, 2012; Koop & Korobilis, 2014).
In particular, factor-augmented vector autoregressive (FAVAR) models, which are developed from the VAR model, are becoming increasingly popular for forecasting macroeconomic variables (Abbate et al., 2016; D’Agostino et al., 2013).
We build and use a factor-augmented vector autoregressive (FAVAR) model. This model is a way to deal with omitted variable bias. In addition, recently, the model has proved to have excellent long-term predictability, and this is especially useful for a stress test. To reflect a recent research trend in the macroeconomic modeling area, we use the time-varying parameter FAVAR (Koop & Korobilis, 2014; Primiceri, 2005.
In detail, we use extensions of factor-augmented VARs. This is because the model can jointly model many of the real estate variables using construction key macroeconomic variables and the systematic latent factors. The modeling approach is briefly described as follows: Let

where

where the
We assume time-varying coefficients as follows:


where
The EWMA (Exponentially Weighted Moving Average) process is modeled using the same exponential decay parameters in Koop and Korobilis (2014). Equation (1) is employed to analyze the underlying housing market index from various real-estate variables. Equation (2) is used to estimate the interactions of the index with macroeconomic variables
This econometric specification is important for two reasons. First, we can better characterize the comovements and interdependencies by using multivariate modeling with all the variables in the system equation. Second, we can remove the impact of macroeconomic conditions on the housing market so that the final estimator includes only information related to the real estate sector.
In other words, if we include
Empirical Results
Korean Housing Cycle
This section accounts for our choice variables and sample data, which follows Kwon et al. (2017). Based on DiPasquale and Wheaton (1996) four quadrant model of the real estate market, we carefully select candidate variables. Four-factor dimensions of the four quadrant model are rental, price, construction, and stock. On top of these factors, we reflect three more factor dimensions. First, the model has been criticized because of its static nature, so we take into account the dynamic (transaction amount) factor. Next, we take into account certain credit factors, including the price and quantity of the mortgage.
Figure 1 shows the time series of the Korean housing cycle. The estimated systematic factors present some interesting points. The estimating factors are linked to key real estate market activities, including the 2008 financial crisis. In particular, they reached their lowest level 4 months after the collapse of Lehman Brothers in September 2008. Next, the estimation factors seem to be effectively linked to major real estate policies, such as DTI regulation in 2011 and LTV and DTI deregulation in 2014.

Korean housing cycle (nationwide).
The Lee Myung-Bak administration (2008–2012) announced about 18 real estate policies, and the Park Geun-Hye administration (2012–2017) made more policies than the previous administration. Many housing policies had a different and perhaps paradoxical effect on the real estate market, thus being coined a fool in the shower. The fool in the shower is a metaphor coined by Milton Friedman, who believed that government economic intervention should be executed gradually to prevent overcorrection. He compared government policy to a fool getting into a cold shower before the water has had time to warm up. Rather than waiting for the temperature to adjust, the fool turns the hot water all the way up and eventually burns himself. Hence, his policy prescription maintained that any stimulus to the economy should be done slowly because it takes time to determine the effects of the change. Likewise, the Korean government can also be likened to the fool in the shower in that the housing policies were too fast and coercive. In short, the housing cycle in Korea has been actively coordinated by the government. To make a good housing cycle, we need to consider the effects of the policies. We will illustrate that our estimated factors meet this requirement well.
The DTI regulations in 2011 had a negative impact on the housing market. The biggest effect was a sharp decline in transaction volume. For 1 year starting from February 2011, the number of nationwide apartment transactions declined by 20%. The effect of DTI regulation on housing prices was far greater than what was thought. As of the end of February 2012, the housing market price in the Seoul metropolitan area fell 0.2% from the previous year.
The housing cycle had continued to decline since the 2011 DTI regulations. To boost the housing market, in early 2012 and 2013, the government eased mortgage regulations to cope with stagnant property prices. In 2014, the deregulation of LTV and DTI, called choynomics, was a turning point that changed the market conditions. The deputy prime minister for economic affairs implemented a$39 US billion fiscal stimulus package, and the Bank of Korea cut interest rates to 2%. These actions resulted in a 2.4% increase in apartment prices in 2014 and a significant increase in mortgage loans and borrowings for long-term rentals. The deregulation of LTV and DTI in 2014 contributed to the real estate markets recovery, but these policy had lost their power in late 2015 and 2016. Since deregulation in 2014, the housing cycle continued to increase until early 2015 and then declined until early 2016.
Figure 2 shows the time series of the estimated systematic factors for metro cities and provinces. These figures show almost the same trend as in Figure 1.
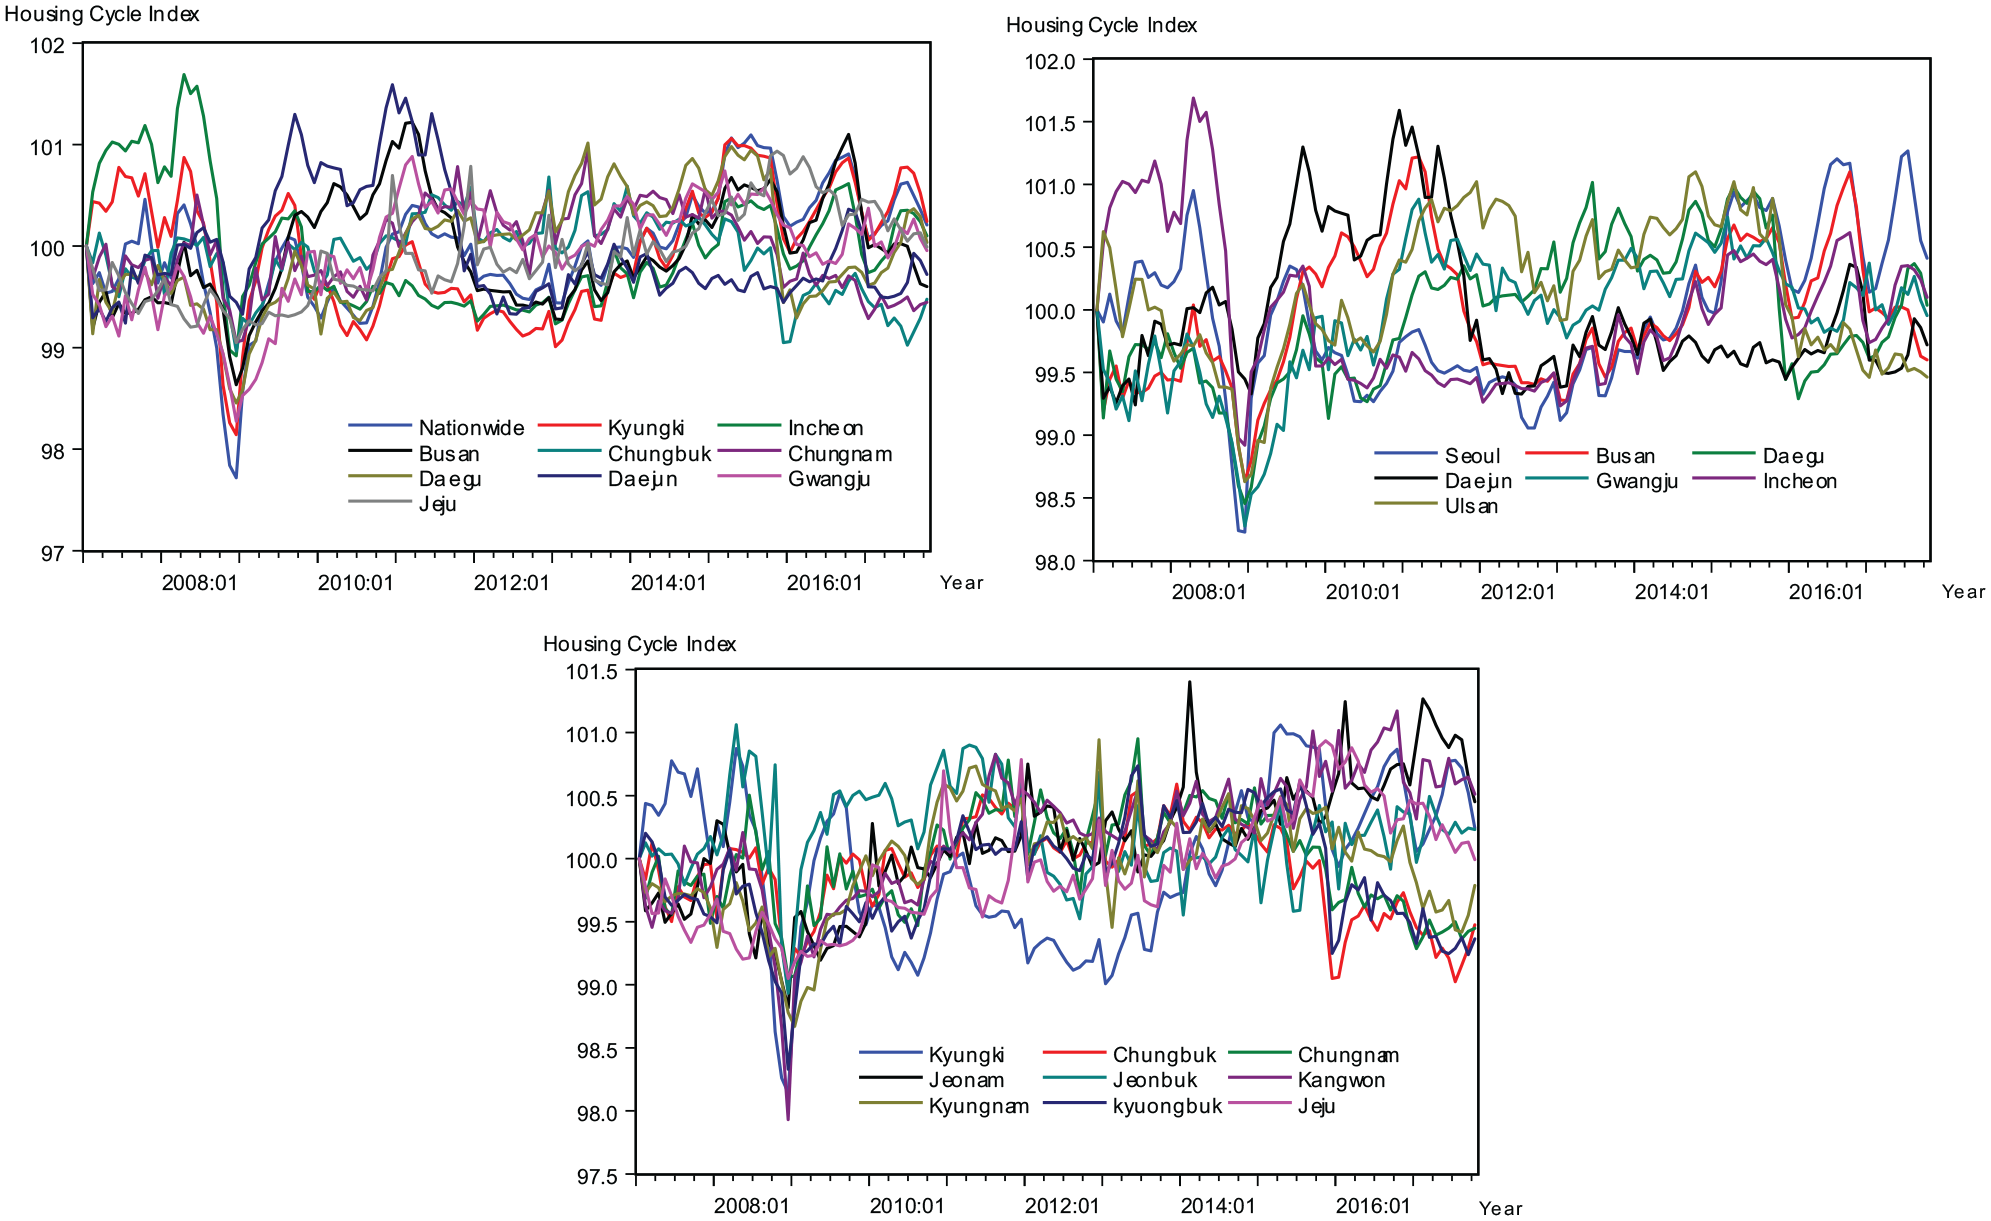
Time-series of estimated systematic factors for metro cities and provinces in Korea.
Impacts of Housing Policies
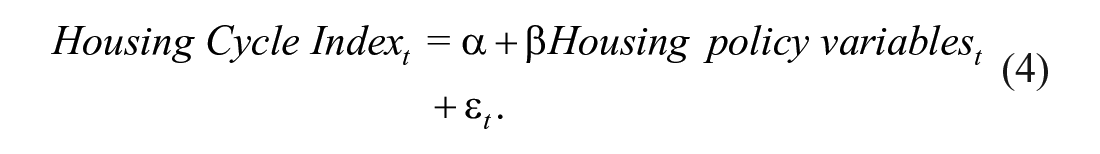
The current study shows the regional housing cycles that reflect the Korea housing market, and these cycles may guide us in finding the impact of housing policies during the analysis period. Table 3 provides the net effects of individual policy on regional housing cycles. In the current study, the panel model used to analyze the net policy effects is as follows:
Panel Analysis of Effects of Housing Policy.
Panel A. Financial Policy.

p < .01.
Panel B. Tax Policy.

p < .01.
Panel C. Transaction Policy.

Note. Table 3 is based on the analysis of only the net effects of panel A’s financial policy, panel B’s tax policy, and panel C’s housing transaction policy. The dependent variable is the Housing Cycle Index.
p < .01.
We analyze the net effect of policies by excluding the influences of macroeconomic variables, and hence, we can see whether they affect the real estate economy in each region and when they do. We analyzed three category policies: financial policies, tax policies, and housing transaction policies (See Appendix B and Appendix C for more details).
First, panel A in Table 3 shows that LTV deregulation has a positive effect on the housing cycles 1 month in advance before the policy implementation. This is because market participants tend to consider the contents of policy in advance while the government collects opinions from stakeholders. The DTI model also shows a similar result to the LTV model. DTI regulation was implemented only in the Seoul metropolitan area: Seoul, Incheon, and Kyungki. Therefore, in this analysis, we estimated the effects on three areas of eight areas. In the model that considered macroeconomic variables, we did not analyze the effects of DTI regulation.
Second, as shown in panel B in Table 3, an increase in acquisition tax (a housing transaction tax that is imposed on buyers when purchasing a house) has adverse effects on the housing cycles. The housing policy affects the housing market 1 month before the policy announcement as for LTV and DTI deregulation. The result of the transfer tax (a housing transaction tax imposed on sellers when there is a capital gain from selling the house) model has the opposite effect. In other words, the transfer tax deregulation has a statistically positive impact on the housing cycles. Therefore, the results show that tax policies look like having effect on the housing cycles.
In Korea, to get a new apartment, people must meet the governments subscription requirements. In the case of the deregulation of the housing subscription model, there was a positive impact on the housing cycles. The deregulation of transfer of housing purchase rights also had a statistically positive impact on the cycles because it made housing transactions quicker.
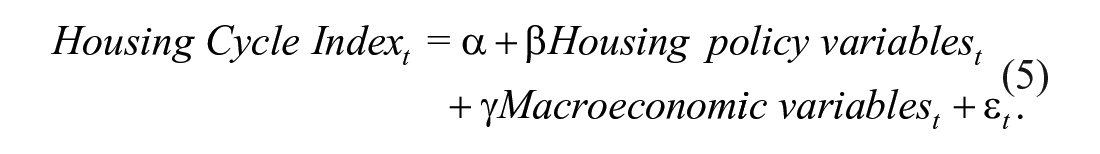
We analyzed the net effect of each housing policy on the housing cycles in Table 3. Tables 4 and 5 show the influence of each policy on the cycles in the panel model, which include the macroeconomic variables and regional variables. In the present study, to deal with the overall policy effect, we set up macroeconomic variables in the panel model. The model is as follows:
Analysis of the Panel Effect of Financial and Tax Policy Considering Macroeconomic Variables.
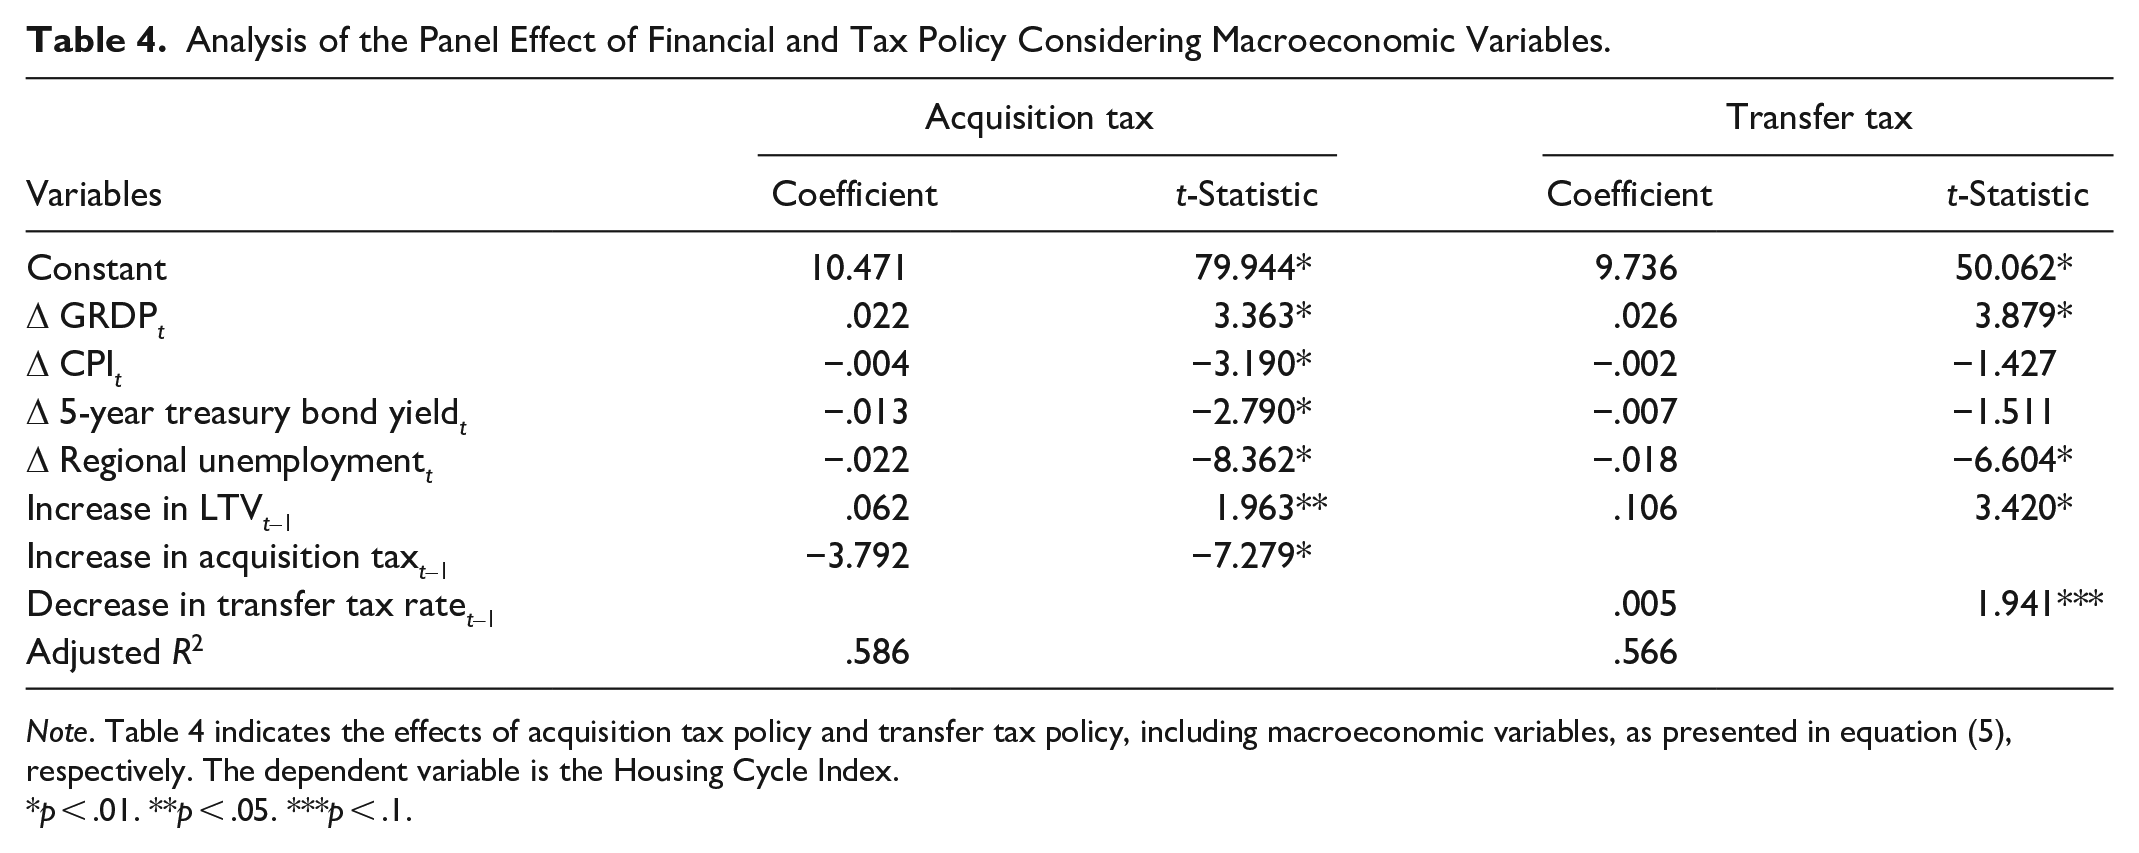
Note. Table 4 indicates the effects of acquisition tax policy and transfer tax policy, including macroeconomic variables, as presented in equation (5), respectively. The dependent variable is the Housing Cycle Index.
p < .01. **p < .05. ***p < .1.
Analysis of the Panel Effect of Housing Transaction Policy Considering Macroeconomic Variables.

Note. Table 5 shows indicates the effects of Housing Subscription policy and Transfer of housing purchase right policy, including macroeconomic variables, as presented in equation (5), respectively. The dependent variable is the Housing Cycle Index.
*p < .01.
As the acquisition tax model in Table 4 shows, we can find that as GRDP (gross regional domestic product) increases, it has a positive effect on the housing cycles. When the consumer price index (CPI) rises, it harms them. In addition, it can be seen that even if interest rates rise or unemployment rises, it has a negative effect on them. These results are similar to the analysis by Yu and Chen (2018) that increasing interest rates will lower housing prices. In the rest of the models, interest rate effects were also found to be the same.
We found that the empirical analysis has a similar result as what is shown in Table 3. In short, LTV deregulation has a positive effect on the housing cycles 1 month before policy implementation because housing buyers and sellers can know the content of policy in advance through the media. Thus, we can reaffirm in the macroeconomic model that financial deregulation is a variable that directly affects the housing cycles.
In the case of acquisition tax deregulation, the policys adverse effects on the cycles can be seen. Also, we analyzed the effects of the transfer tax policy. A decrease in the transfer tax rate can boost housing cycles. The timing of the policy effect was in the period t − 1, as shown in Table 3. Here, there is a time difference in the effect of the policy.
Table 5 reports the effects of housing transaction regulations on the housing cycles. We used a similar analysis method as Table 3.
The results show that LTV deregulation, or financial policy, worked. Also, we can identify the effect of easing the housing transaction regulation policies (i.e., the housing subscription and transfer of housing purchase rights).
When we summarize each policys impact on the housing cycles, all policies affect the regional cycles in the period t − 1. However, we found that in the compound effect model, which includes macroeconomic variables and regional variables, housing transaction policy did not affect the cycles, unlike the net policy model.
In conclusion, it is necessary to apply the appropriate policy to the region by reflecting the results of this study, especially when making or implementing the housing policies. We also found there is a time lag when the governments policy influences the housing cycles, and this means the government needs to consider these results.
To test the robustness of the cycle model, we estimated the effect of housing policy by using the housing fluctuation rate as a dependent variable. Table 6 presents the robustness test results.
Panel Analysis of the Relationship between Housing Price Change Rate and Housing Policy.
Panel A. Effects of Financial and Tax Policy.

p < .01. **p < .05. ***p < .1.
Panel B. Effects of Housing Transaction Policy.

Note. In Table 6, we analyze the robustness of the results of the policy effect analysis presented in Tables 4 and 5. That is, we used the housing price fluctuation rate instead of the housing cycle index as a dependent variable and provide the results.
p < .01.
As a result of the empirical analysis, in panel A, when we consider the acquisition tax, the GRDP change rate and the local unemployment rate were not statistically significant, unlike in Table 4. In the transfer tax model, the local unemployment rate and LTV deregulation did not have statistical significance. In panel B, for the subscription model and transfer of housing purchase right model, variables such as GRDP change rate, local unemployment rate, and LTV deregulation were not statistically significant. This means that there is a difference between the results of the current studys model and those of the previous policy effect analyses. Given the results, the housing economic index model suggested by the FAVAR model was able to better reflect the policy effect.
Conclusion
The current study has analyzed the impacts of the Korean governments housing policy on the housing business cycle using empirical data and has suggested policy implications. For empirical analysis, we used the FAVAR model suggested by Bernanke et al. (2005) and made regional housing cycles. The current study is fundamentally different from previous studies in that we used the FAVAR methodology instead of the general economic index making method. Also, our study is important in that we quantitatively analyzed the various policy effects and reported the results. In addition, our research is meaningful because it is the first study to analyze all the effects of financial policy, tax policy, and housing transaction policy. In contrast, previous studies have examined the fragmentary effects of one variable on housing prices, such as interest rates or park accessibility.
To perform an empirical analysis, we divided our empirical research into two parts: the net policy effect model and the comprehensive model. The reason for the analysis of the net policy effect model is that by excluding the effects of macroeconomic variables and analyzing net policy effects, it is possible to find whether and if so when each policy affects the housing market in each policy region. The analysis was conducted by looking at the effects of financial policies, tax policies, and housing transaction policies.
In the net policy effect model, we were able to confirm that all policies, such as an increase in DTI ratio and LTV limit, an acquisition tax reduction, transfer tax deregulation and deregulation of the housing subscription policy and the housing purchase right transfer, impacted the housing cycles in the period t − 1. This is because many people will respond to the policy before it has been implemented.
To analyze the overall impact of policy variables, we added the macroeconomic variables and regional variables to the model. As a result of the empirical analysis, if the GRDP increases, it has a positive effect on the housing cycles. When consumer prices rise, it has a negative impact on the housing cycles. In addition, even if interest rates rise or unemployment rises, this has a negative effect on the housing cycles. Hence, we can conclude that the result of rising interest rates has a negative impact on them is similar to the analysis of Yu and Chen (2018) that a rise in the interest rates causes housing prices to fall.
Finally, we have found that the rest of the policies, except the housing transaction policy, had a statistically significant effect on the housing cycle by region in the period t − 1.
To test the robustness of the housing cycle model suggested by the current study, we conducted another analysis, in which we checked the effect of policy by using the housing fluctuation rate as a dependent variable. The results show that there is a difference between the results of this model and those of the previous policy effect analysis. Namely, the housing economic cycle model can reflect the policy effect better. Hence, based on the results, when the Korean government intervenes in the housing market, it must consider the appropriate policies for each region. Also, we suggest policymakers should consider the time lag when implementing policies to the regions.
Finally, the current study is meaningful in that it presents policy implications to the Korean government and policymakers as we describe above; to our best knowledge, the current study is the first to analyze the overall policy effects. However, there are limitations in not doing a comparative analysis before and after the 2008 financial crisis. Furthermore, we need to analyze the regional policy effects in detail.
Footnotes
Appendix A
Panel B. Description of the Statistics.
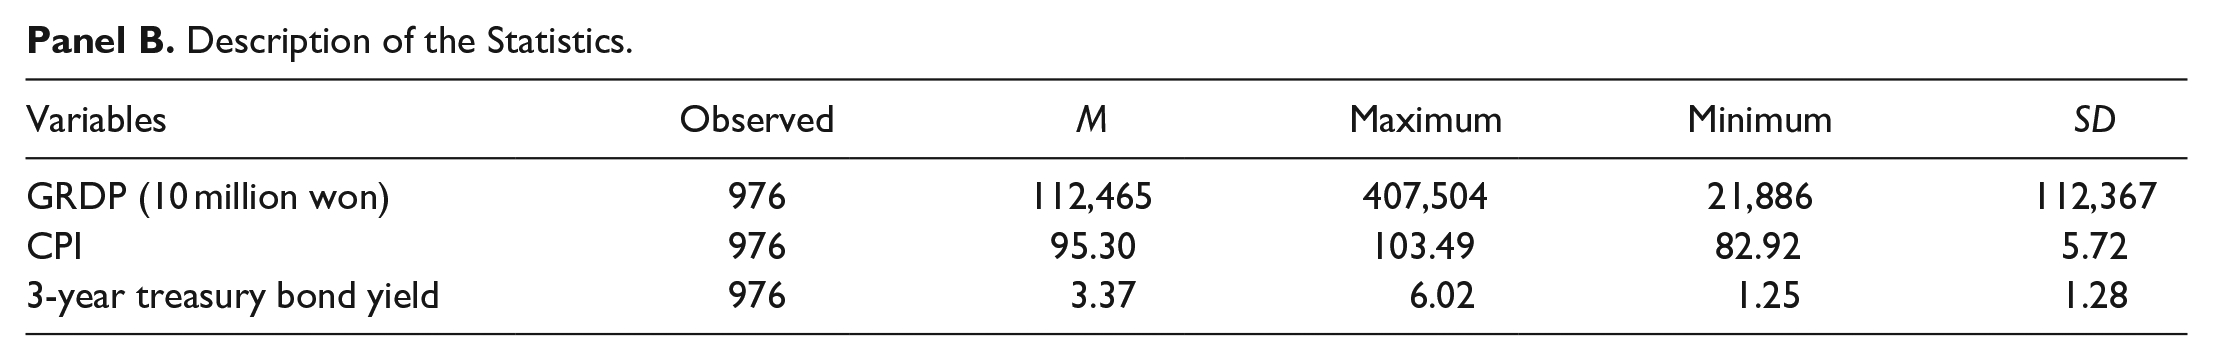
| Variables | Observed | M | Maximum | Minimum | SD |
|---|---|---|---|---|---|
| GRDP (10 million won) | 976 | 112,465 | 407,504 | 21,886 | 112,367 |
| CPI | 976 | 95.30 | 103.49 | 82.92 | 5.72 |
| 3-year treasury bond yield | 976 | 3.37 | 6.02 | 1.25 | 1.28 |
Appendix B
The Changes of Housing Transaction Policy.

| Time | Main contents | |
|---|---|---|
| Housing purchase right | 2007.01 2008.04 2008.08 2009.09 2011.09 2012.05 2014.09 2014.12 |
Extending restriction period that people can sell the housing purchase right Mitigating requirements for trading the right in the local area Mitigating requirements for trading the right in Seoul metropolitan area Enhancing requirements for trading the right in the places that the government provides the project site Mitigating requirements for trading the right in Seoul metropolitan area Mitigating requirements for trading the right in the places that the government provides the project site Shortening restriction period that people can sell the housing purchase right Mitigating requirements for trading the right in the places that the government provides the project site around the Seoul metropolitan area |
| Housing subscription | 2007.01 2007.09 2013.02 2014.09 2017.08 |
Those who have two or more houses do not qualify for subscription first priority Introduction of subscription point system for people who do not have a house Mitigating judgment criteria whether people have a house or not Simplification of a housing subscription system Mitigating requirements for subscribing to a new apartment Enhancing the requirement for getting a first priority qualification to subscribe to a new apartment |
Appendix C
Types of Housing Policies in Korea.
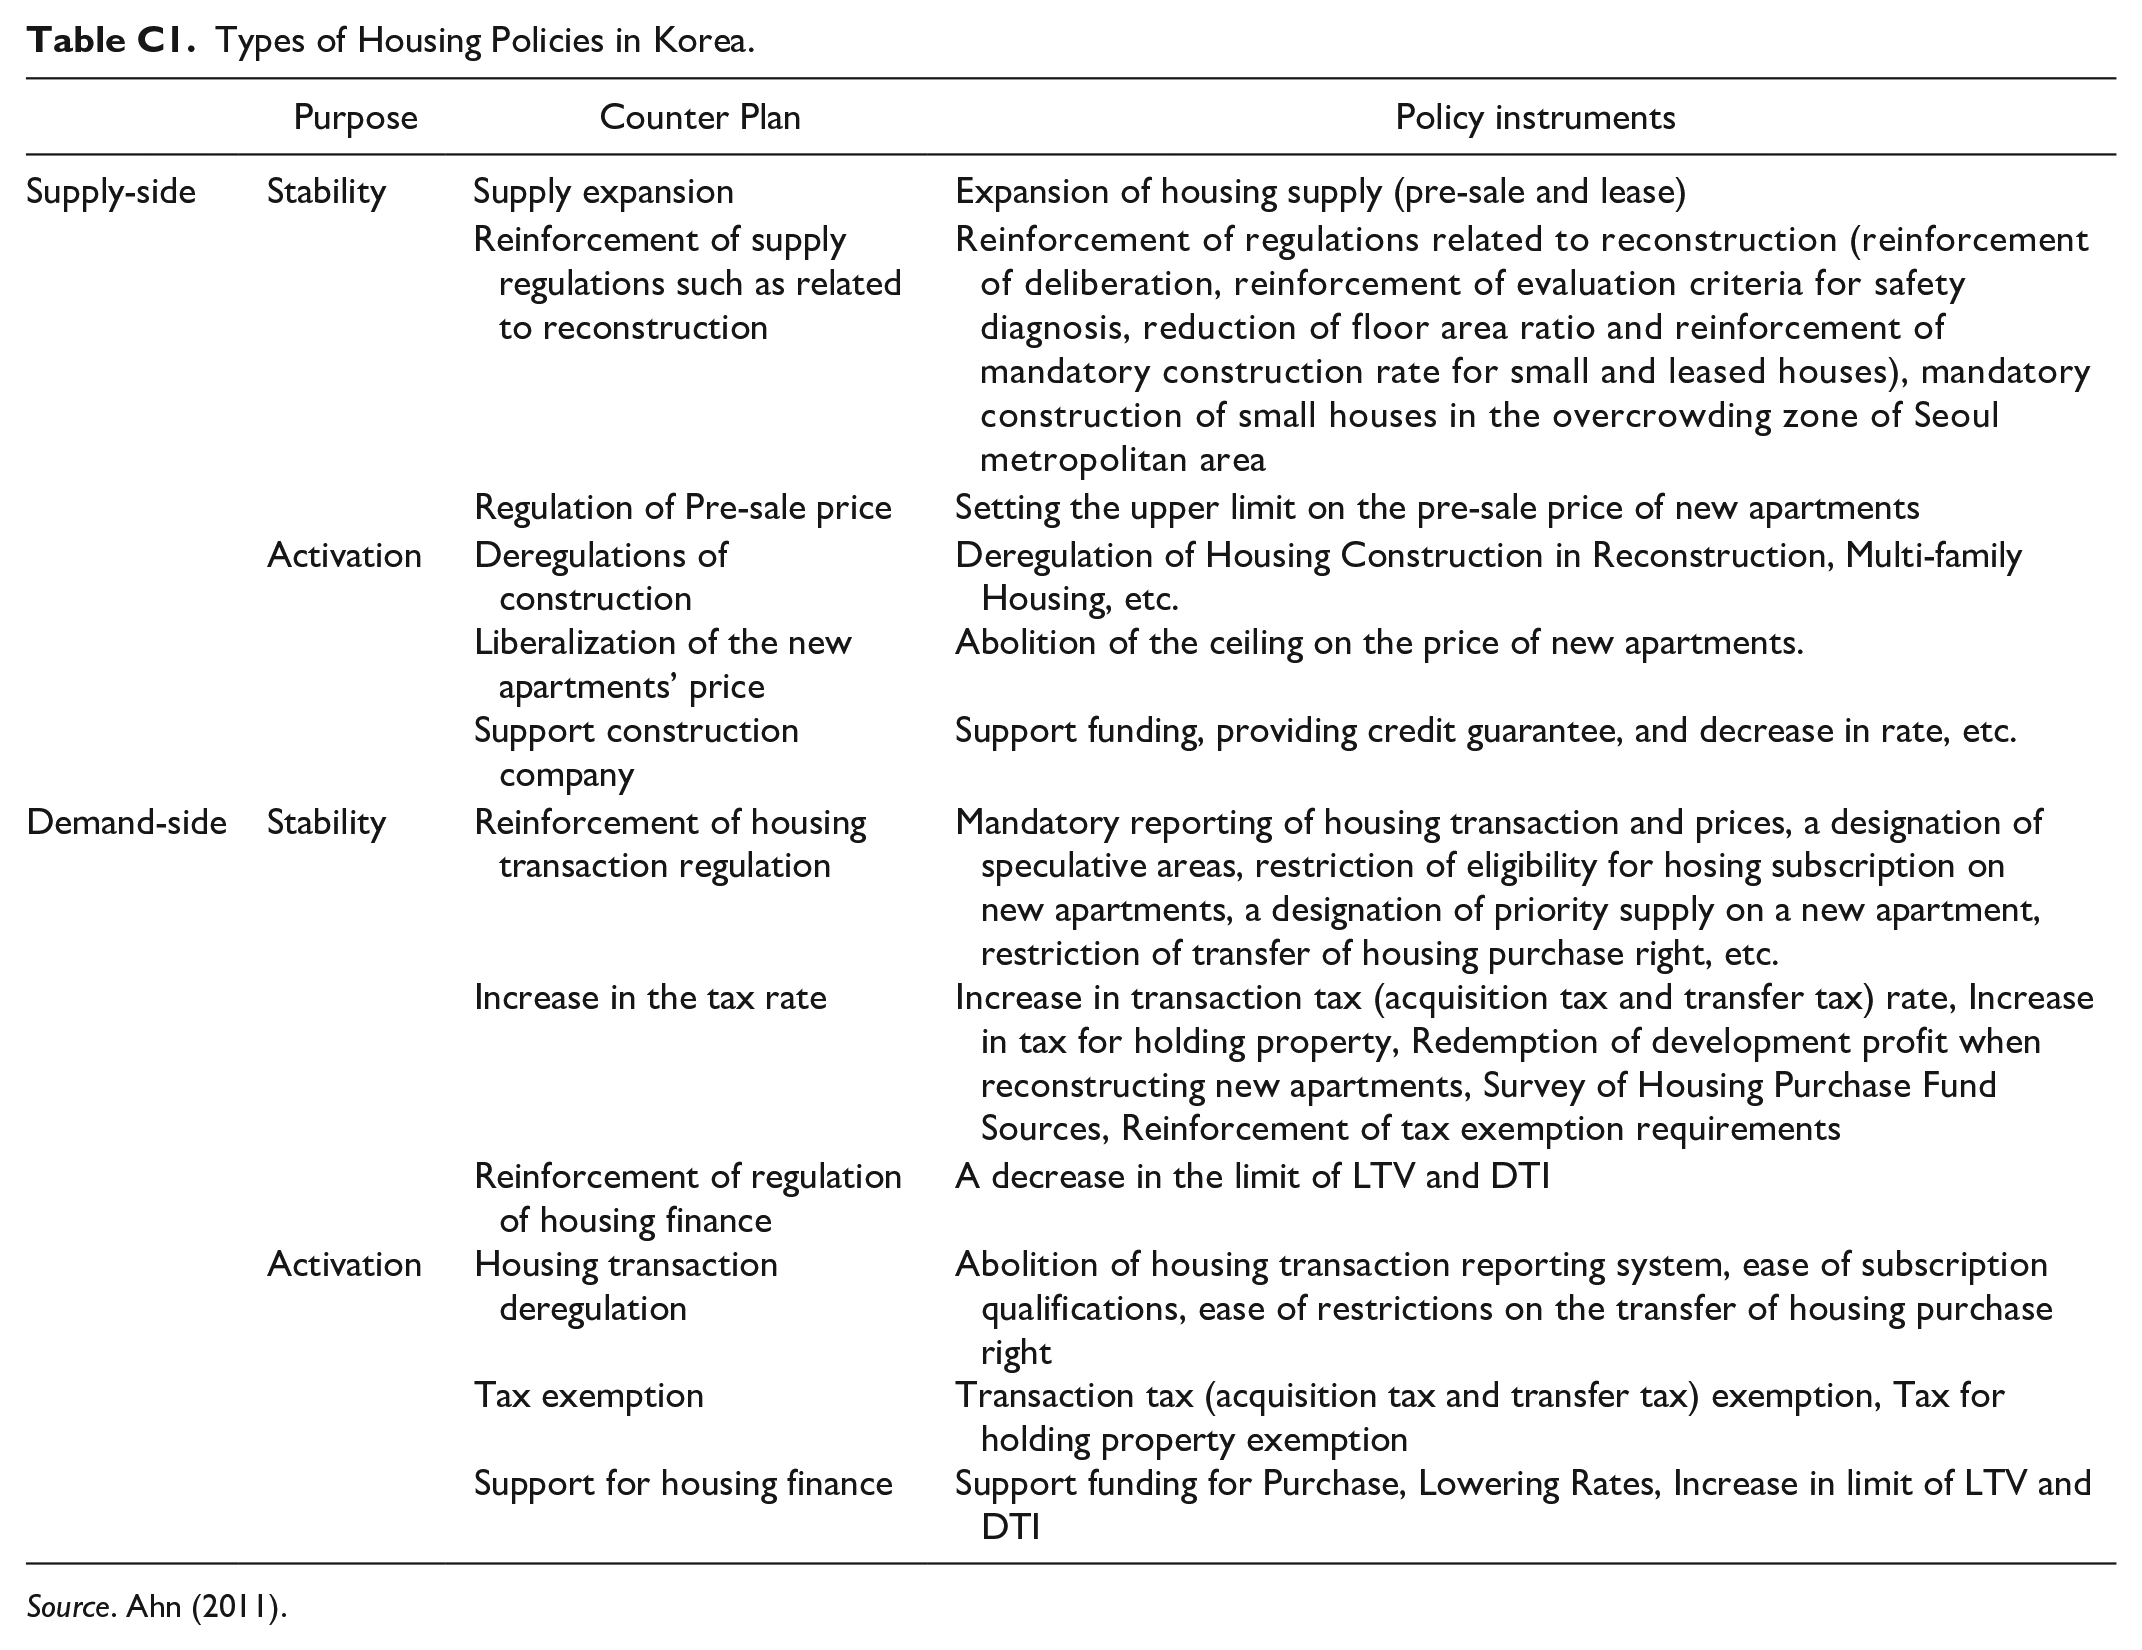
| Purpose | Counter Plan | Policy instruments | |
|---|---|---|---|
| Supply-side | Stability | Supply expansion | Expansion of housing supply (pre-sale and lease) |
| Reinforcement of supply regulations such as related to reconstruction | Reinforcement of regulations related to reconstruction (reinforcement of deliberation, reinforcement of evaluation criteria for safety diagnosis, reduction of floor area ratio and reinforcement of mandatory construction rate for small and leased houses), mandatory construction of small houses in the overcrowding zone of Seoul metropolitan area | ||
| Regulation of Pre-sale price | Setting the upper limit on the pre-sale price of new apartments | ||
| Activation | Deregulations of construction Liberalization of the new apartments’ price Support construction company |
Deregulation of Housing Construction in Reconstruction, Multi-family Housing, etc. Abolition of the ceiling on the price of new apartments. Support funding, providing credit guarantee, and decrease in rate, etc. |
|
| Demand-side | Stability | Reinforcement of housing transaction regulation Increase in the tax rate |
Mandatory reporting of housing transaction and prices, a designation of speculative areas, restriction of eligibility for hosing subscription on new apartments, a designation of priority supply on a new apartment, restriction of transfer of housing purchase right, etc. Increase in transaction tax (acquisition tax and transfer tax) rate, Increase in tax for holding property, Redemption of development profit when reconstructing new apartments, Survey of Housing Purchase Fund Sources, Reinforcement of tax exemption requirements |
| Activation | Reinforcement of regulation of housing finance Housing transaction deregulation Tax exemption Support for housing finance |
A decrease in the limit of LTV and DTI Abolition of housing transaction reporting system, ease of subscription qualifications, ease of restrictions on the transfer of housing purchase right Transaction tax (acquisition tax and transfer tax) exemption, Tax for holding property exemption Support funding for Purchase, Lowering Rates, Increase in limit of LTV and DTI |
Source. Ahn (2011).
Declaration of Conflicting Interests
The author(s) declared no potential conflicts of interest with respect to the research, authorship, and/or publication of this article.
Funding
The author(s) received no financial support for the research, authorship, and/or publication of this article.