
Abstract
Open Government Data (OGD) has become a widely employed tool by governments around the world to promote transparent and accountable policy-making. In the context of societal actors’ ability to reuse such data, one of the most important features of ODG is its quality. Thus, through this research, we aim to address the level of data quality by introducing a new framework that constantly monitors and evaluates the OGD quality of Western Balkan (WB) National Open Data Portals. The advantage of the proposed framework is the integration on the portal level enabling information exposure about the quality dimension at any time. An additional value of the framework is the ability to provide recommendations with the intention of improving quality issues. The applicability and findings of the proposed framework are not limited to the WB and once contextualized that could be applied to other countries in the Eastern European that face similar data quality challenges.
Introduction
The notion of open government data (OGD) has been present over the last decade, while scientific interest and attention to it have consistently increased through years. The main motivation has derived from the intention to promote transparency and accountability in supporting e-Government but it has recently undergone a change in bringing forward the concept of open governments. According to Galetta (2018), the latest trends are based on economic values, while commercial reuse of public sector information would satisfy and utilize public sector data.
Successful reuse of data depends on their quality, thus a precondition for effective data reuse is contingent to it (Faniel, 2016). The quality is not something that is raised as an issue here as it has existed over the years since many efforts have been made to address it. Pignotti et al. (2010) announced and related quality issues with the data quality that lead to the maturity level of published linked open data (Berners-Lee, 2006). The latter focuses on a five star model that exclusively measures linked open data and addresses quality issues based on their published data format (open format, machine-readable, uri, and linked data).
Furthermore, many frameworks have been proposed aiming to address a wider range of quality issues based on quality dimensions (Naumann et al., 2000; Wormell, 1990). However, other open data assessment frameworks that mostly focused on assessing of datasets have been developed later by Batini et al. (2009) and Vetrò et al. (2016). These developments are considered helpful for assessing datasets and showing up quality issues, but there are no guidelines on addressing these issues or eliminating them in the production. Furthermore, there is no instruction on utilization or prevention of producing data with quality issues (Zaveri et al., 2016). Thus, there are a few questions that require a new approach for finding a way to minimize or reduce these issues as much as possible.
Many sources in literature support the understanding and improvement of processes, projects, and roles for better management of public sector data with the intent to be published in the right way (Hazen et al., 2017). However, the research for organizing these processes in technical aspects is also prevalent, considering how it could improve aspects for better structuring, organizing as well as storing data in the right way. There is no defined guideline on how to make it; there is a lack of a clear picture of regulations and policies in the organizational context. Nevertheless, there are some proposals about guidelines and organizational preparations that consider technology as a mechanism for realizing it based on best practices but, this does not resolve the quality issues of data in the content (Gascó-Hernández et al., 2018). A certain approach should be applied that depends on many factors and individually on data itself.
The existing assumptions and guidelines related to quality issues of data are not very useful, despite the fact that root causes of data quality issues differ with each other (Lindgren et al., 2019), thus proposing a framework that would fit all case scenarios is not so easy and simple. Accordingly, considerable research efforts that had the attention on addressing quality issues can be found in literature but, unfortunately, less progress has been made on this matter (Safarov et al., 2017). This indicator provides enough space for more efforts on improving data quality issues (Charalabidis et al., 2018). This scenario is related to any data, addressing the quality issues based on technological theories for supporting improvement of quality or that lead to highlighting the weaknesses of published data (Torchiano et al., 2017).
This paper has gathered insights in relation to both of the above areas discussed, but more attention has been given to identification of OGD quality issues. The purpose of this research is evaluation of OGD quality with the intention to identify data quality issues of public sector bodies. The evaluation results provided in the form of recommendations will serve as guidelines for data owners and administrators to improve quality of their data. The methodology used in this paper is based on analysis of several case studies and frameworks used for evaluating OGD. In comparison to others, here, we have conceptualized a framework that is composed of several components such as open data analysis, collection, data preparation and validation, data evaluation, and on the end results; thus, leaving the possibility for extension to other researchers that might have interest to deepen research. This is possible due to the collection of data locally and not evaluation at the portal level directly.
The aim of the paper is to identify OGD quality issues of different public sector bodies through the framework evaluation process and to offer recommendations with the aim of improving its quality. More specifically, the key research question is:
To What Extent Have the WB OGD Portals Built Qualitative Data?
Two other secondary questions guide this analysis including: What are the differences in terms of OGD quality among WB countries and how open are the governments of the WB countries in terms of data publication? What are the main OGD quality issues that WB public sector bodies are facing? Moreover, the developed framework once adjusted to other country contexts can be easily applied to measure the extent of qualitative data. The additional contribution of this research is the possibility to compare the results of the WB countries with developed countries, like EU countries. Thus, these results will serve as basis to identify evidence-based recommendations for decision makers in the WB toward data quality improvement, making this a core contribution to the region.
This research paper is organized as follows: The next section reviews OGD quality considerations, current frameworks, and characteristics of the public sector data. The research methodology section discusses the methodology applied and analysis of OGD portals, datasets, and other resources published. Section on framework definition defines dimensions and metrics applied for evaluating OGD quality. The evaluation section presents and discusses the results generated from evaluation based on comparative analysis. The last section offers recommendations with the intention of improving OGD data quality issues of public sector bodies.
Research Background
Open Government Data and Quality Perspective
Public data management including government processes and other functions are enforced by applicable laws, regulations, and procedures. In this regard, there are specific procedures that control the release of data. More often, this law is known as “right on information” or “data protection” law (Custers et al., 2018). Accordingly, utilizing of data from public open data portals, sometimes in literature referred as OGD portals, should presume some level of legitimacy on the publisher’s side for immediate usage of public data by others.
This behavior has significant impact on the way of publishing, collecting, utilizing, and the way how the data have been stored. Collecting of data, is most commonly organized through some forms designed based on applicable regulations and relevant procedures (Clark et al., 2018). But in context, there is a huge difference compared with the private sector since they can constantly perform improvements aimed at having qualitative data. Thus the normative acts, regulations, and processes can be changed based on willingness and readiness of the business part to improve anything. However, this is not the case in public sector where such a thing cannot be done so easily and is more complex due to the relation of each process ranging from public sector bodies to local government and which is sometimes being entirely managed by the central government. In extreme cases, the parliament has to decide whether to change anything that is legally based and that would take time, effort, energy, and sometimes political support as well.
The abovementioned is the best scenario which explains the complexity of public data improvement where all of it results in a data lifecycle in which public sector data sharply separates the consumer from supplier compared to the private sector. Therefore, attempts to change anything in production would require additional changes in corresponding components discussed above and would complicate the process due to the need of involving other processes.
Several literature sources discuss the data quality issues related to their contribution and how poor data quality issues impact the daily life, and hamper an efficient use, re-use, and redistribution of open data. According to Bishop et al. (2017), qualitative data reuse has been improved services and infrastructure that facilitate access to thousands of data collections.
Data quality problems with accuracy, aggregation, and precision of OGD have been reported by Allison (2010) and were considered as bad transposition of zip codes, country codes, city codes, and so on in public archives. Another example that concerns lack of data integration has been discussed by Tauberer (2014), which shows the difficulty of data integration of IDs for Members of Congress. He points out that lot of efforts that have been made for merging and comparing data because of poor quality. According to Saxena et al. (2017), they have identified data quality issues and elaborated how low quality data influenced the business processes.
Other sources, Purwanto et al. (2020), explain how data quality and information quality are fully related to each other aiming to provide qualitative services to citizens “quality issues and poor data quality degrade the quality of services as well.”
Open Knowledge Foundation research used a new approach based on practical examples for understanding data quality based on the notion “from quality to qualities” and calls for discipline to all data producers “A call for joint work towards better data quality” (OKFn, 2018).
Moreover, data quality is related to current innovation technologies based on machine learning and artificial intelligence, AI, as Walch et al. (2021) states that “The quality of your data affects how well your AI and machine learning models will operate.”
Besides the above facts, data quality is considered very valuable for the health systems, in particular for patient data that contains information about diagnosis, medications, hospital treatments, and so on. Thus, referring to D’Amore et al. (2021), “Overall, the integrated data showed that 79% of patients in the study had records located within more than one facility.”
Data Quality is also strongly related to the current pandemic situation (COVID-19) that has captured the worldwide. High volume of information is being processed right now as you are reading this article such: number of tests per day, new infected people, deaths, recovered people, etc. The question here would be addressed what would happen in case of poor quality? When the research community is working day and night to prevent further COVID-19 propagation. In this respect, Nogueira et al. (2020) identified the factors associated with COVID-19 deaths in State of Portugal, the report identifies that low quality of data produces risk factors for COVID-19 deaths.
Based on research reviews, case studies, and other facts, data quality has become part of our daily social life; it is around us and is related to anything that provides information or is based on information.
Data Quality Frameworks
Most commonly, OGD Quality Frameworks often are categorized in a similar way because of differences in context. It means that data quality as a stream is based on some technical standards, processes, and results for producing and managing data that often consider the data timelines (not updated). The other important stream of data is accessibility and availability of data. It includes several types of data in different categories, so measuring availability of relevant datasets means how easy is to find those, while how to download and to use relevant datasets is referred to accessibility (Davies, 2016). There are various frameworks concentrated on specific sectors that calculate and measure the quality of open data per sector then compare sectors to show the differences and performance of each other.
Despite the fact, there was a tendency to favor the OGD attributes and characteristics that are measurable. These characteristics are well elaborated by the research work of Zaveri et al. (2012) which, for the purpose of measurability of OGD quality, identify, and define 68 metrics spread into six dimensions. Different dimensions and sub-dimensions and metrics for assessing OD quality has been proposed by Šlibar et al. (2021).
However, irrespective evaluation methods containing a range of dimensions and metrics, issues with public data are still present. Therefore, the objective of this research is to identify the data quality issues of public sector bodies with the intent to provide recommendations for improvement.
There are several data quality frameworks but which differ in the context of use. Veljković et al. (2014) proposed and implemented a benchmark for evaluating OGD through transparency, participation, collaboration, and openness of data. Raca et al. (2021) have developed an application-based framework that considers OGD quality evaluation using two dimensions and several metrics, but it does not evaluate the quality of data itself. An Analytical framework for Assessing the OGD has been proposed earlier by Ubaldi (2013). This framework uses heterogeneous points of view (organizational, political, and technical). Three different quality dimensions such accuracy, completeness, and timeliness have been proposed by Viscusi et al. (2014). While, Zuiderwijk et al. (2014) established a new framework dedicated to comparison of open data policies based on performance indicators, policy content, and public values. Welle Donker et al. (2017) developed a framework based on comprehensive assessment of OGD and user characteristics. Zhu and Freeman (2019) grouped results of OGD evaluation into four categories: data presentation, online capabilities, participation, and engagement capability.
There are various other assessment frameworks in literature review, some of them are implemented practically. Zuiderwijk et al. (2021) compared different benchmarks implemented at portal level (Open Data Barometer, Global Open Data Index, European Open Data Portal, Open Data Economy Benchmarking, and Open Data Readiness) through meta-theories and metadata. Another assessment of OGD that uses benchmarks as instruments measures “data openness” and emphasize openness aspects based on six Charter principles (Kawashita et al., 2020). Meanwhile, the World Wide Web Foundation “The Governance Lab” (2016) reviewed the current landscape of OGD assessment and developed the new one through collaborative open data activities and workshops (Neves et al., 2020).
However, in literature various frameworks for assessing data quality issues have been proposed, some of them implemented at portal level, but with some limitations. Non-updatable results, lack of current data quality check, comparison in timely basis, showing progress/regress, or missing the detailed report about the exact quality issues of public sector bodies are just few findings on current frameworks. This also have served as motivation to extend these limitations by providing a novel framework.
Our Contribution
This research is conducted based on analysis of existing frameworks for evaluating and assessing the OGD quality issues aimed to overcome their limitation. In this context, comparing to other frameworks developed, the proposed approach tries to extend and adopt a new framework model that would address OGD quality issues and that would be fully applicable to OGD portals. Therefore, because of implementation and the focus of research in the WB countries, comparing to other studies and models developed, this research addresses the following gaps:
(a) Integration: A completely integrated and automated framework that evaluates OGD quality of the six WB OGD portals at any time.
(b) Analysis and storage: Provides comparison between public sector bodies and countries of the WB by showing performance of countries in terms of data quality. This behaviour is possible because of data collection process and storing data locally.
(c) Recommendation and improvement: Gives instant recommendation for improvement of quality of data based on generic reports for public sector bodies. This will help the administrators and data owners of public sector bodies to understand the issues with their data and to have a clear picture what needs to be improved.
In addition, the proposed framework has been designed based on the following observations captured during the analysis of the WB OGD portals and quality issues. In this respect, we observed that:
(1) The existing approaches applied to WB countries for measuring and assessing the OGD quality do not provide comprehensive results. There was no way to show and compare WB countries and their public sector bodies in terms of OGD quality.
(2) No framework has been appied and implemented yet to WB countries at portal level that evaluates the quality of OGD at any time, and show the progress or regress made by countries and their public sector bodies over the time.
(3) The need for centralized portal that shows OGD quality of the WB countries, respectively, their public sector bodies. This portal would serve to community including data owners themselves with intention of showing and improving their data quality based on recommendations that would provide.
Research Methodology
A combination of qualitative and quantitative approach was used to build a framework for identifying, evaluating, comparing, and potentially improving of data quality issues. This framework is dedicated to the public sector bodies, as active practitioners of OGD. Initially it is implemented over six national OGD portals of the WB countries such: Albania, Bosnia and Herzegovina, Kosovo, North Macedonia, Montenegro, and Serbia. Achievement of the objectives is based on mixed methods under the following framework cycle explained in Figure 1.
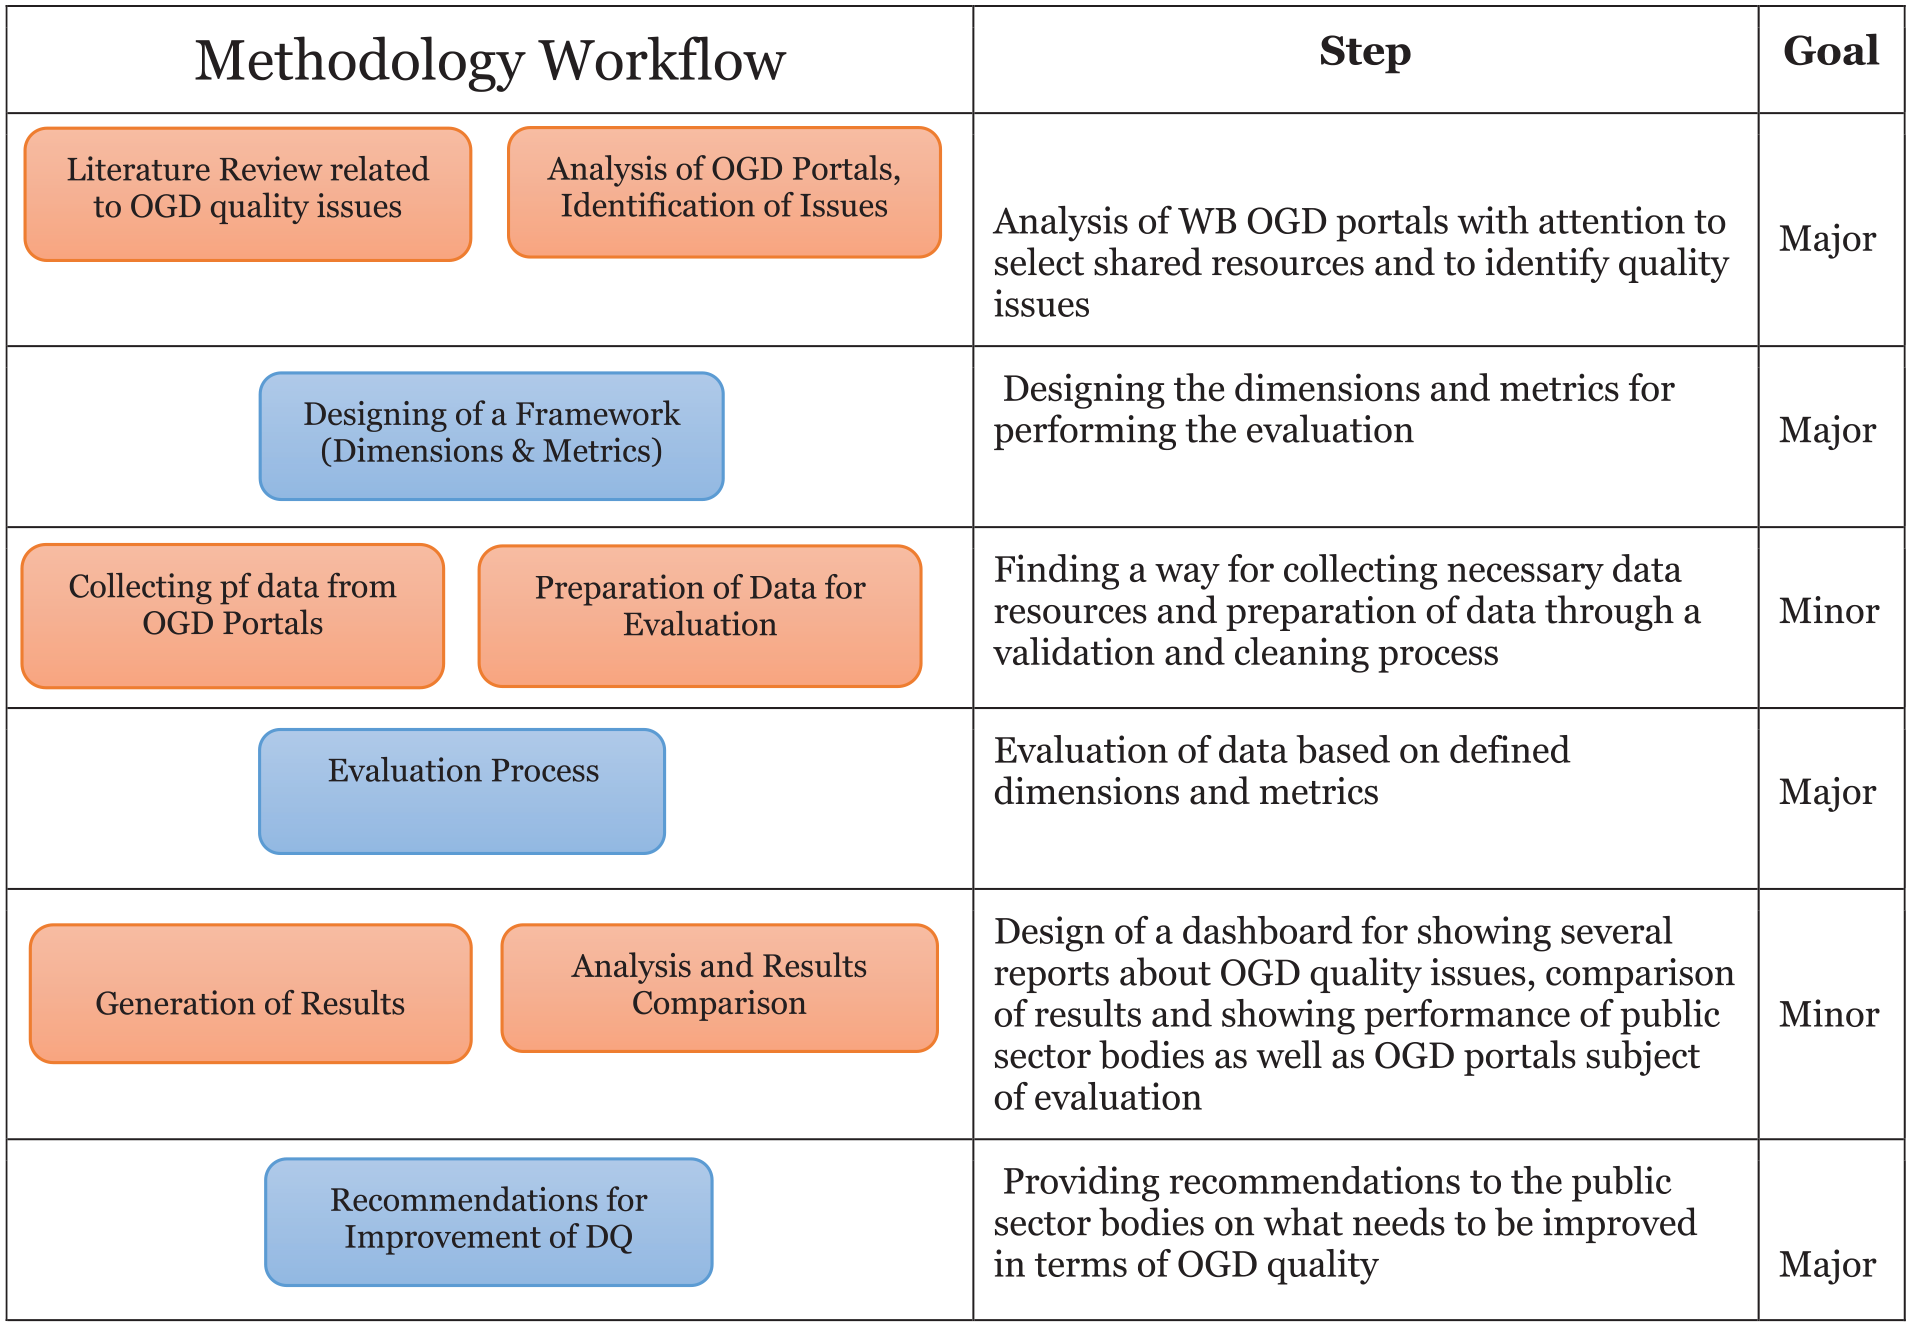
Methodology workflow applied based on author’s compilation.
The model used in this research is composed by several constructs. Since the research is more focused on conceptualization of framework for performing evaluation of OGD quality, the other technical aspects of framework have been ignored.
The proposed approach is supported by literature review, in particular through the use of the methodology of existing frameworks (Batini et al., 2009; Kawashita et al., 2020; Vetró et al., 2016; Zaveri et al., 2016). Initially, the framework has been implemented in only six WB countries but it has the intention to be expanded to other countries including EU countries. The reason for selecting for implementation of the framework in WB countries and not in EU countries is related to the process of integration and the late process of joining the Open Government Partnership (OGP). However, after the implementation of recommendations arising from this research, WB countries would be closer to the EU OGD Portals.
Moreover, there is important to note that the analysis, including results are based on the data published until December 2021 (21/12/2021) when the framework was applied.
Analysis of OGD Portals
Since the main objective of this research is to build a framework, there are identified some prerequisites that will support its conceptualization, respectively definition of proper metrics. Generally, the OGD portals provide huge amounts of information that are not all relevant, so setting some criteria for selecting the relevant information considered the most valuable part of the analysis.
Analysis points out the huge differences between OGD portals, both visually and by contents. Regarding the content of resources, there exists a significant difference between published resources such as datasets, public sector bodies, dataset formats, language used, types, groups, licenses, and other organizational aspects. On the other hand, the problems with the language interface have been noticed in all analyzed OGD portals. This becomes more complex when information is not provided to all language interfaces of OGD portals and complicates reusing of data by those who are not familiar with published language. Given that, the usage of Cyrillic letters is also present being mainly used by countries that use Cyrillic letters in their native language (Serbia and North Macedonia).
In addition, there are analyzed also the possibilities of using OGD portal resources in automated way. Offering of an Application Program Interface (API) considered a good starting point for collecting data. In this respect, analysis shows that the situation with APIs is almost the same among the other issues. Different APIs, different calling response, limited data response, absence of a guideline on how to use APIs are just some of the findings that have pushed forward our idea to use other alternatives to ensure data. In this context data crawling and data scraping techniques have been used for ensuring data that were not available by the API. In Table 1 are shown the countries OGD portals, API types, and resources available.
Author’s Compilation of OGD Portals Connectivity Options Based on Gathering Data From WB OGD Portals.

Note. Comprehensive Knowledge Archive Network (CKAN) is the open-source data management tool for powering data portals and data hubs. Using of (*) means developed API but based on the CAKAN model. DKAN is similar with CKAN but is Drupal-based, the first widely adopted open-source open data portal software.
Analysis of Published Resources
Regarding the resources in OGD, they mean that everything published is independently declared as an entity. It can be a dataset, organization, license, API, file format, and so on.
As far as the datasets are concerned, according to open format definition, about 25 types of dataset file-formats have been published by OGD portals including some unusual formats used for compressing data, such as .rar, .zip, and .7zip which are out of definition of open standards. The other fact is that regardless of the open data standards, there are few more datasets in wrong format extensions typos for (e.g., “gejson,” “Jason,” or “гејсон”). According to open format definition, a correct file format will be considered if a dataset is published in one of the following file format extensions: JSON, XML, CSV, XLS, XLSX, DOX, DOC, TXT, and PDF. While the non-proper file-format means the other formats that are not listed above.
Various names of licenses have been identified to be out of range defined by Open Data Common Licenses, spelling mistakes, absence of published dates, use of non-proper dates, non-proper format published, absence of other descriptive information, and so on which are just a few issues that OGD portals are challenged with. These facts are enough to encourage the need for data preparation through the validation process that will be explained later in this research and is considered to be done prior to preparing data for evaluation.
Criteria of Resource Selection
Different analyses over the OGD portals can be applied based on different criteria set Nikiforova and Lnenicka (2021). In our scenario, the selection criteria is based on principles of open government data and supported by the questions defined in Table 2.
Principle Questions Addressed for Selection Criteria Definition.

The intention here is to ensure and collect the information derived from the questions above that will be used to conceptualize dimensions and their metrics.
Framework Definition
Since the process of analysis was set to be prior to building and conceptualization of the framework, findings during the analysis process have supported the definition of metrics for evaluating the OGD quality. This follows from the nature of definition of the data that should be ensured somehow by all OGD portals in order to make possible adoption of the framework to all OGD portal datasets equally. Considering the fact that research uses mixed methods, in Table 3 are shown the necessary resources based on qualitative and quantitative methods.
Quantitative and Qualitative Model.

It is almost clear that resources presented in Table 4 should be available to any OGD portal that might be the target of evaluation. The analytical logic used there is based on the identification of shared resources. It means that we have tried to find the common attributes that OGD portals share. Let us suppose that every OGD portal has a few datasets available including their file formats, dataset operating license and publisher (public sector body) who published the dataset. In Figure 2 are shown the most common attributes shared by most of OGD portals.

Identification of resources for evaluation.
Referring to identification of resources above, the proposed framework will be three-dimensional and will have three key functions. First, openness of governments through dataset publication format. Second, data quality through observability of datasets based on existence of information about the dataset published. Third, data quality of data (rows and records) inside the dataset. For this purpose, we have named dimensions differently, Openness Dimension; Dataset Dimension; and Data Dimension. Each dimension has its own metrics explained in next sections.
Openness Dimension
The most simplified dimension based on quantitative methodology is conceptualized to monitor the OGD Portals by counting and grouping datasets based on file format extension. The purpose of this dimension is to measure the openness of governments based on the 5 star-schema model of Berners-Lee (2006). Furthermore, in Table 4 are presented the 5-star schema metrics that composed the openness dimension:
Metrics of Openness Dimension.

Source. 5-star Open Data (2012).
Rating and Scoring of datasets or public sector bodies are based on file format extensions rated by stars. These calculations have been performed on all datasets, public sector bodies as publishers, and on top, the average of national level (OGD portal).
Dataset Dimension
Unlike the openness dimension (quantitative methodology) discussed above, dataset dimension considers the information that characterizes a dataset. In this regard, we have categorized four main attributes of the dataset that affect the quality of datasets and portals as well. In Table 5, we present the metrics that composed the dataset dimension.
Metrics of Dataset Dimensions.

Source. Zaveri et al. (2016) and Vetró et al. (2016).
Every dataset will be subject to evaluation, passing through each of the observations listed above, where for each of them, it will receive an evaluation rate.
Data Dimension
The discussed dimensions are more related to OGD portal evaluation, how qualitative the OGD portals are in terms of dataset publication, while the Data Dimension is related typically to quality of data and is defined as a major goal of this research. According to the name of the definition, even though it looks similar, the data dimension is completely different compared to the previous dimensions. Despite the fact that both of them are members of the qualitative dimension, data dimension evaluates the quality of data of the dataset. In Table 6 are presented the metrics by this dimension including description roles.
Metrics of Data Quality Dimension.
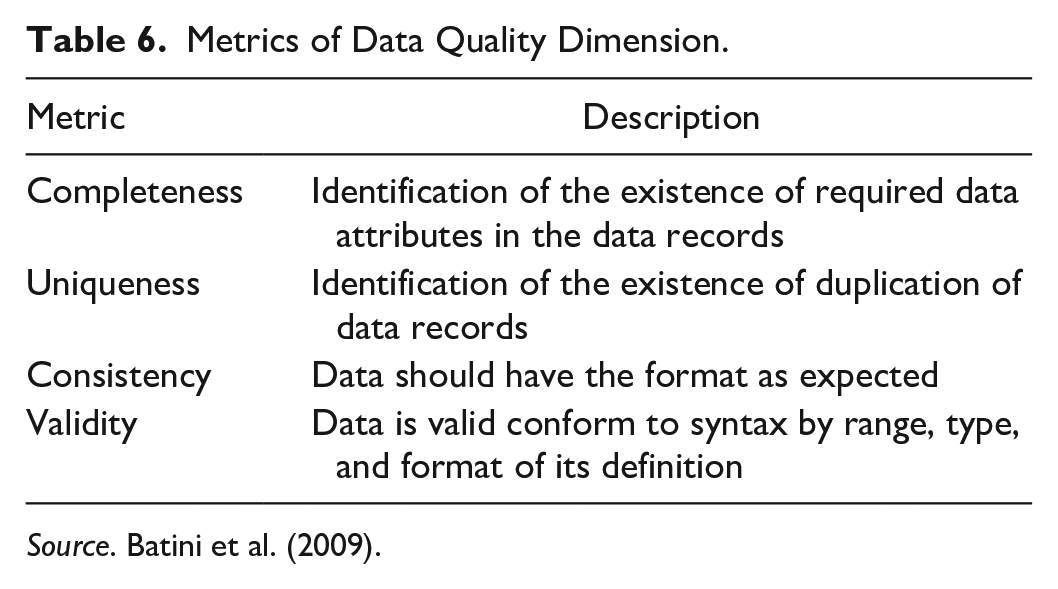
Source. Batini et al. (2009).
The Validity metric is considered much more complex because it includes a range of formats or types to validate. For this purpose, as predefinition, we have analyzed the datasets first, then based on analysis, we have identified some ranges that most of the datasets include for, for example, calling code of telephone numbers, email addresses, country codes, names and surnames if they have been used with lowercase or capital letters, date format, and so on. In the next section, we will discuss in detail how the evaluation for each metric is performed and challenges and strength for providing results.
Evaluation and Results
The analysis of OGD Portals depict the lack of any applicable standard for naming of datasets and public sector bodies, licenses and other resources published huge presence of empty strings and null values, duplication of data, etc. Among others, the existence of different date time standards used for (e.g., 2020-01-10, 20-Feb-21, or Jan-03-2021 or May/12/2021), and issues of publication of datasets in non-proper format or using wrong file extensions or using only Cyrillic alphabet letters. These facts are enough to conclude that OGD portals have relatively low-quality data, so the data preparation as process considered crucial to enable a more accurate evaluation and results. Since the purpose of this research is not to address the data preparation process or what methods or techniques should be used for preparing data for evaluation, so we explained briefly about steps undertaken on this matter. Data validation and Data cleansing are the two steps conducted. Typical example of validating is converting all date and time values into one standard “YYYY/MM/DD” regardless of the previous format published. Similarly has been done with correcting of file extension names, license names, and public sector names and so on. Removal of null values and empty strings is a typical example of how data cleaning is used. These are just some comments that argue the need to prepare data before starting evaluating their quality.
Therefore, let us suppose that data preparation has been done, and all needed data are collected locally in the database, so the conditions for implementation of the framework are prepared while the dimension metrics have not been yet discussed. Following sections will discuss what metrics are used and how metrics have produced results. In addition, the organization of metrics has been grouped in two categories (quantitative and qualitative) similar to the organization of dimensions based on methodology.
Quantitative Metrics
Quantitative metrics represent the openness dimension, in this regard, groping of datasets based on file format published will scored with starts 1 to 5. The average rate calculation is made using formula:

The equation (1) calculates the total average by summing the total number of datasets based on rated starts for, for example, 1 star, +2 stars, and +3 stars up to 5 in proportional to the total number of datasets published for OGD portal that is subject of evaluation. Moreover, the formula (1) is applicable only for those cases when dataset is published in single format. While, the analysis points out the existence of multiple file formats per dataset and formula (1) does not promise the accuracy of results. For this behavior, there is needed second level of evaluation using formula (2). The second level evaluation will detect and identify the existence multiple file formats per dataset considering only the higher file formats as total.

H—the highest Star Rate of Dataset.
The total averages will be generated by summing both formulas above using equation (3):

f(x)—is the function of average of openness dimension.
Therefore, in Figure 3 we have shown results for each country based on a 5-star schema evaluation model. It includes two levels.
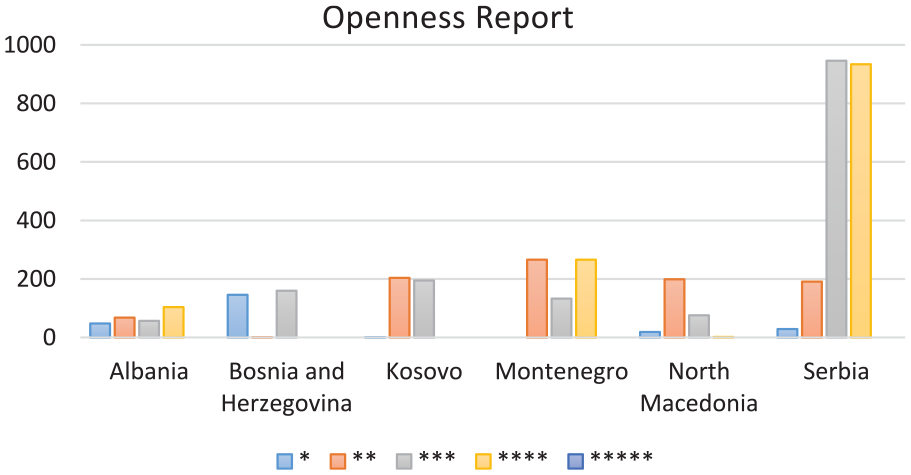
Calculation of openness average per country level.
Qualitative Metrics
In contrast, qualitative metrics are grouped in two types: datasets metrics and data metrics. Also the rates here differ, in both groups the minimal value per metric is rated with “0” zero and the maximum value is “1.” Even though there are two separate groups of metrics (availability, accessibility, discoverability, and timelessness) attributed to dataset quality, and (completeness, uniqueness, consistency, and validity) attributed to data quality, the calculation will be performed in the same way for both groups of metrics. In addition, the formula (4) calculates the average at OGD portal level, summing all obtained results per metric in proportion with number of used metrics:

This formula has produced following results presented in Figure 4.
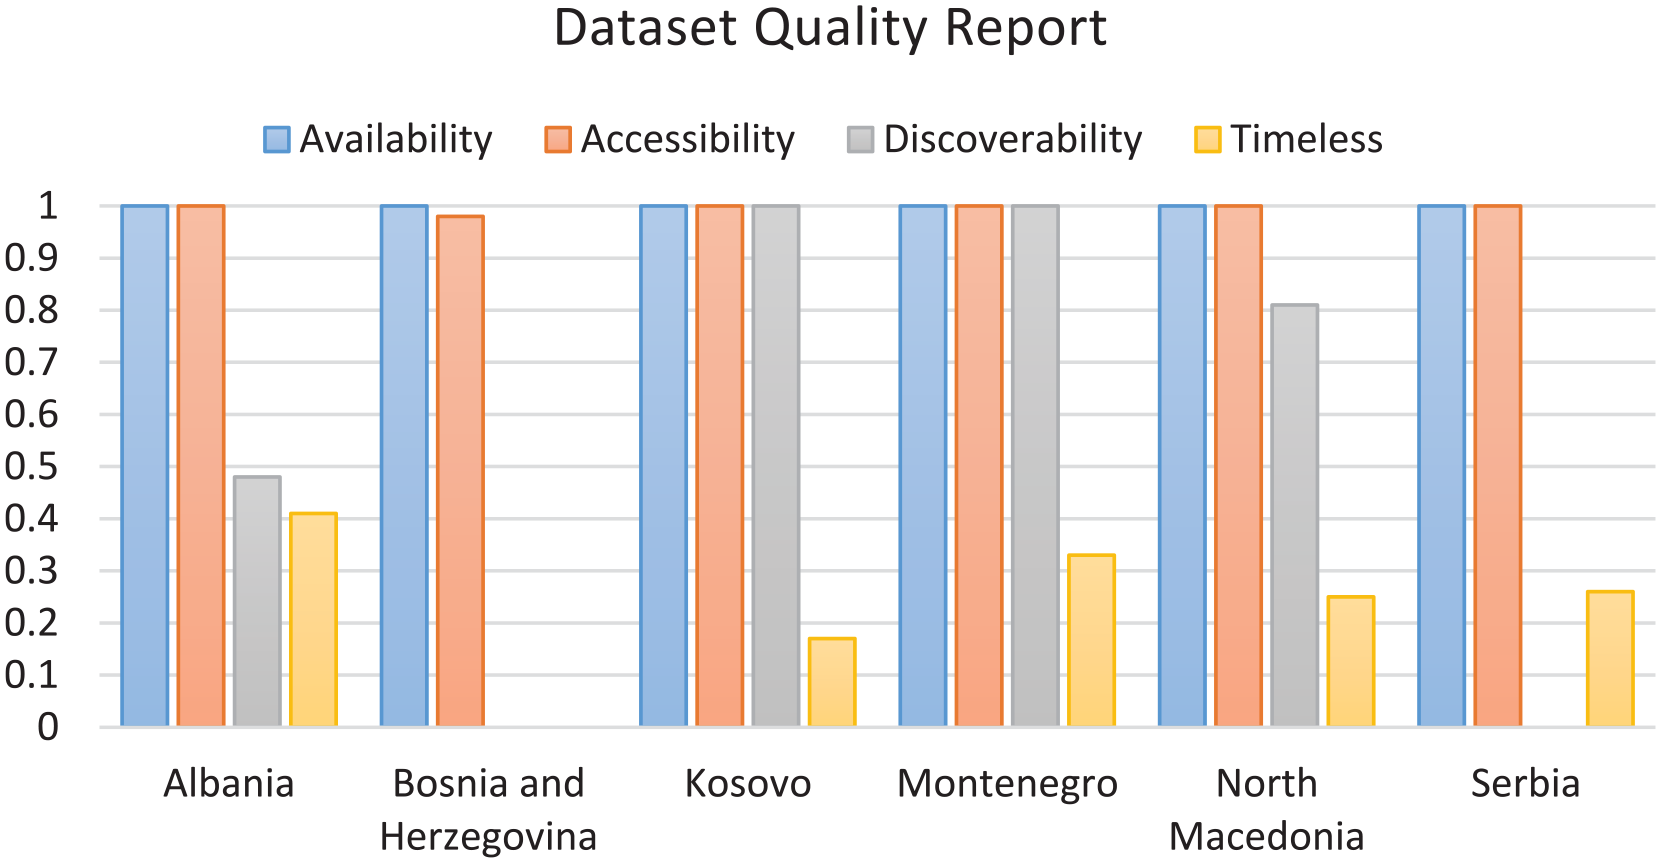
Calculation of dataset quality averages per country level.
In addition to dataset quality, we have calculated the data quality as part of the data dimension. Here the calculation of metrics is much more complex, even though minimal and maximal values remain the same “0” and “1.” In the following paragraphs, are shown in detail about roles of metrics and how each metric performs calculations. In this context, few techniques have been used. First importing of dataset as file into Hadoop Distributed File System (HDFS). HDFS is a very popular distributed data file system integrated in PostgreSQL, that is suitable for the storage of large datasets, is highly scalable, and can run on commodity hardware.. Regarding the hierarchical structure, each dataset was located in a parent directory corresponding to the organization that the dataset originates from, and that directory is located in a directory that holds all of the organization directories of the specific country.
The files in the already described folder structure are placed in HDFS, while, our Spark metrics calculation application calculates the metrics and writes them in a table in a PostgreSQL database. Spark SQL is Apache Spark’s module for working with structured data.
The processing application is written in Python script (a programing language) because of the plethora of libraries that it provides, easily readable and understandable syntax, and the good integration with Spark, especially Spark 3 as “PySpark.” PostgreSQL is chosen as local database for storing metric results and importing data for further calculations and analysis. PostgreSQL is a very popular, free, and open-source database that can serve as an efficient, low-cost, data warehousing solution but it does not mean that it cannot be used in any other relational database such MSSQL or MySQL, Oracle, etc.
It is also important to note that we have set a condition for evaluation that considers only CSV, JSON, XLSX, and XLS formats. In this context, we have excluded other formats such: PDF or DOC, DOCX, and other non-proper formats of datasets because there is no way to import data from those formats. This behavior has been applied to datasets of all OGD portals. In Table 7 are presented the exact number of datasets that have been subject of evaluation.
Number of Dataset Processed and Evaluated on Both Levels.
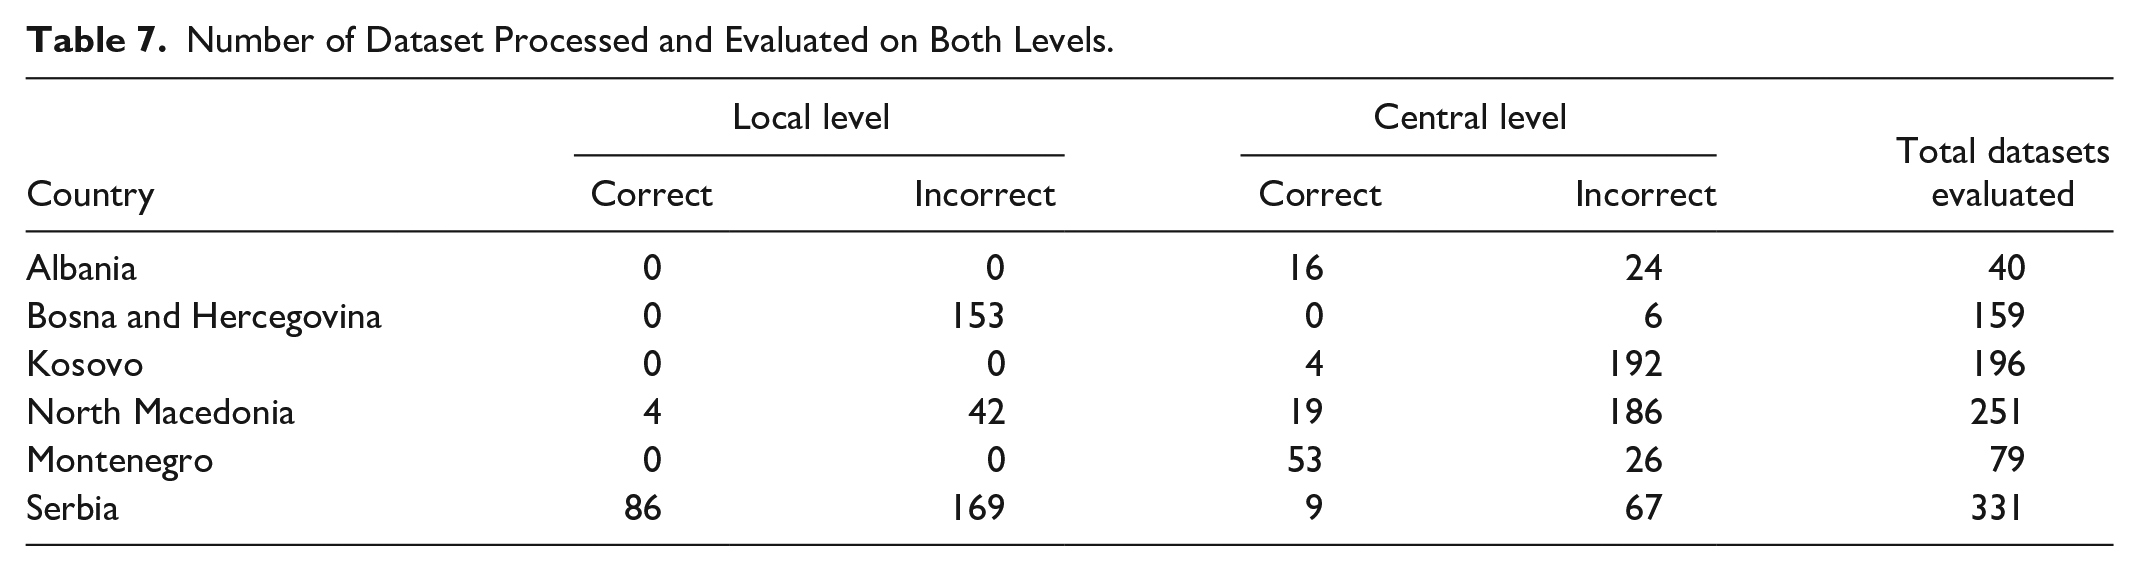
According to the table, the number of datasets is much lower than real published datasets. It is normal because only those datasets meet the criteria for evaluation under the conditions set. Also in Figure 5 we have shown datasets published by public sector bodies including two levels local and central.

The report of correctness for central and local level.
The processing application finds all of the paths to the datasets in HDFS. Then for each path, the format of the file is checked. If the format is CSV, the Chardet Python library is used to find the encoding of the file, the delimiter, and to check whether the file has a header or not. The outputs of these checks are imputed into Spark’s reading methods which return a Data frame that defines the contents of the dataset.
While for JSON, XLSX, and XLS files, the file is read without these predefined checks. If there is an error reading the file, it is marked as a dataset with incorrect format, and the calculations for other metrics have been bypassed. Since the datasets have data that can be in alphabets different from the English alphabet and have column names that are in an alphabet different from the English alphabet, the column names are changed to artificial column names col_1, col2, . . . col_n. This is done so that dynamic SQL can be used to query the Data Frame. The number of tuples and columns are calculated and stored in variables. A new Data Frame is created using the original Data Frame but with the duplicate tuples removed. The count of tuples of this Data Frame is calculated as well as the number of duplicates is calculated when this count is subtracted from the count of tuples of the original Data Frame. For every column of the Data Frame, a summation of values that are either “NULL” or empty is performed. This value is the numerator in the formula for the completeness metric. The denominator is calculated by multiplying the already calculated number of tuples and the number of columns in the Data Frame. It is agreed that for validity testing, the first tuple should be the benchmark for all subsequent tuples in the dataset. The first tuple is queried from the dataset and with it; a dynamic SQL query is defined. The columns of this tuple are iterated and for every column, the data type is retrieved. If the data type is a string and the value is not NULL or empty, regular expressions are performed on the value of the column.
These regular expressions are for the date, email, country code, titles, naming, numeric, and currency. When a regular expression is matched a SUM aggregation with a “CASE WHEN col_1 RLIKE [MATCHED_REGEX] THEN 0 ELSE 1 END “statement is appended to the dynamic SQL string. When run, this aggregation will sum all of the values that do not have the same format as the first value for the particular column. An alias is also defined which consists of the name of the column and suffix _numeric, _date, _name, etc. depending on the matched regular expression. After all the columns are iterated of the first tuple, the dynamic SQL query string is completed and has multiple aggregations in the select statement. This query reads from the Data Frame that defines the dataset. The query is run and the result is a single tuple with sums of values that have a different format to the first value of the particular column. Since multiple columns can be validated for the same regular expression, in this tuple, there may be multiple sums with suffix _numeric or _date, etc. The code creates another dynamic SQL query that sums all of the results based on the columns suffix. This way the absolute sum of values in columns that do not have the same format as the first value in the column is found for the date, email, country code, titles, naming, numeric, and currency validations. The calculations are written to a table in PostgreSQL that includes the following columns:
Country—the name of the country.
Organization—the organization of the country.
File_name—the name of the file, that is, processed and belongs to the organization.
File_format—format (extension) of the file. Values include csv, json, xls, and xlsx.
Total_records—number of records that the file has.
Total_columns—number of columns that the file has.
Total_null_values—number of nulls and empty strings that the file has.
Total_duplicates—number of duplicate records that the file has.
Correct_format—indicates if the file has a structure as intended by its extension.
Numeric—number of incorrect numeric fields.
Price_currency—number of fields that have incorrect currency, currencies included in the test are currencies from North Macedonia, Kosovo, Albania, Montenegro, Serbia, and Bosnia and Herzegovina.
Country_code—number of fields that have incorrect country code, country codes included in the test codes from all countries.
Number of fields that have incorrect names or titles. Either all capital letters, or all lowercase letters, or each word with a first capital letter (title, name and last name, etc.).
Calling_code—number of fields that have incorrect calling code. Calling codes included in the test are codes from North Macedonia, Kosovo, Albania, Montenegro, Serbia, and Bosnia and Herzegovina.
Email—number of fields that have an incorrect email.
Date—number of fields that have an incorrect date. Valid date formats include dd/mm/yyyy, yyyy.mm.dd, y yyy-dd-mm, dd.mm.yyyy, yyyy/dd/mm, dd-mm-yyyy, mm-dd-yyyy, yyyy/mm/dd, yyyy.dd.mm, yyyy-mm-dd, mm/dd/yyyy, and mm.dd.yyyy.
Total_numeric_cols—number of numeric columns.
Total_price_currency_cols—number of columns with currency.
Total_country_code_cols—number of columns with a country code.
Total_name_cols—number of columns with a name or title.
Total_email_cols—number of columns with an email.
Total_date_cols—number of columns with a date.
Compared to datasets metrics, here each metric is important and includes further calculations. Let’s start with completeness metric which calculates the completed number of records within dataset. While, incomplete records can be “NULL” values or empty strings. For this purpose, we have used formula (5):

X—Total incorrect records
For calculating the uniqueness metric, we have enumerated the duplicated records within dataset. Therefore, the formula (6) explains the calculation process:

Measuring the consistency metric was much simpler since it has definitions of bit values (true or false) that means each data has structure as intended by its extension.

Therefore, the validity metric considered much more complex because it includes other sub-metrics (numeric values, country codes, name and last names, and dates). Regardless of the sub-metric used, the same formula has been applied to each of them. Formula (8) shows the calculation of validity per sub-metric:

Moreover, the Table 8 shows the quality results of validity metric per attribute:
Calculation of Validation Metric Averages per Country.

N/A means that metric is not applicable for that country or there does not exist any data that can be measured using that metric. Therefore, in Figure 6, we have presented the averages per country including other metrics:

Calculation of data quality averages per country level.
Conclusions and Recommendations
Today, due to the large amounts of data produced by governments worldwide, the quality dimension has become a vital issue. The quality of public data remains a crucial precondition for such data to be reused. Thus, it serves more as a transparent and accountable governance process. Several research articles address the quality issues of OGD, but to our knowledge, they do not cover the identification of OGD quality issues in the case of the Western Balkans.
Thus, to fill this gap, this research introduces a new framework model dedicated to continuously monitoring, evaluating, and providing instant recommendations for improving quality issues.
Analysis deriving from our framework model depicts the differences between OGD portals in terms of publication resources, weaknesses, challenges, and opportunities that OGD portals can provide in the Balkans. Therefore, these data results serve as a basis for improving OGD portals and better utilization of open data. The results presented and visualized through graphs can serve as indicators for public sector bodies initially to familiarize themselves with the quality issues of their published data. Most importantly, it can help data owners and administrators to improve their data quality based on recommendation reports generated that will serve as guidelines for improving data quality. This new framework is unique, flexible, and quickly adopted in other countries with few context adaptations, thus making its application much more comprehensive than the country case studies in this research.
Moreover, based on research results, a set of recommendations has been identified for each WB country, as follows:
Albania
Results indicate that a considerable number of datasets are published in low quality formats such as PDF and DOC, while impairing the openness of Albania’s Government. Thus, the following evidence based recommendations should be taken into consideration:
The government should adopt an internal regulation that makes mandatory the publication of public sector data in machine readable formats like CVS, XML, or JSON.
All public institutions should publish data on a frequent basis, be it semi-annual or annual and this should also be regulated by internal regulation.
To enable querying of data discoverability of datasets should also be applied by all public sector bodies publishing data.
Improving data consistency for datasets with low consistency shown in Appendix A (Table A1).
Local governments should be encouraged to publish data gathered at the local level.
Bosnia and Herzegovina
Results show that a very small number of public sector bodies (only 10 public sectors) are publishing data, although the number of public sector bodies, both at central and local levels, exceeds 100.
The government should adopt an internal regulation that eliminates the large number of file formats published in PDF and DOC by encouraging publication in other machine-readable formats (CSV) and URI (XML, JSON, or HTML).
Enabling querying of data or discoverability of datasets should be applied by all public sector bodies that publish data.
Other public sector bodies should be encouraged to publish data gathered at the local level since the current number of bodies that produce open data is deficient compared with other countries.
North Macedonia
In the case of North Macedonia, the following recommendations should be taken into account:
The government should adopt an internal regulation that makes mandatory the publication of public sector data in multiple formats: machine-readable format (CSV) and URI formats such XML, JSON, or HTML) as well as eliminating wrong file formats extension published in Cyrillic letters such (гејсон or gejson).
All public institutions should publish data constantly and maintain their data based on regular updates, this process should also be regulated by an internal regulation that urges public sector bodies to keep their data updated.
Enabling querying of data or discoverability of datasets should also be applied by all public sector bodies that publish data.
Local governments should be encouraged to publish data gathered at the local level since the current number of local datasets is zero.
Improving completeness of data due to the large number of datasets published, which contain incompleteness data shown in Appendix A (Table A3).
Implementation of de-duplication process for eliminating double records shown in Appendix A (Table A3).
Implementing a pre-validation as an independent process would identify and fix the issues with validity of data shown in Appendix B (Table B1), especially for datasets containing (numeric values, date and times, and name/surnames). It would ensure qualitative data in terms of validity.
Kosovo
The following evidence-based recommendations should be taken into consideration:
The government should adopt an internal regulation that makes mandatory the publication of public sector data in URI formats such (XML, JSON, or HTML).
All public institutions should publish data on a frequent basis, be it semi-annual or annual and this should also be regulated by internal regulation.
Implementing a pre-validation as an independent process would identify and fix the issues with the validity of data, especially for datasets containing (numeric values, date and times, and name/surnames). It would ensure qualitative data in terms of validity.
Local governments should be encouraged to publish data gathered at the local level since the current number of local datasets is zero.
Montenegro
Results indicate that Montenegro can serve as an example for other countries on how to manage and apply a policy that regulates the publication of datasets in multiple formats. Though, there are a few dimensions that need to be improved, including the following:
Local governments should be encouraged to publish data gathered at the local level.
Implement a pre-validation as an independent process that would identify and fix the issues with the validity of data, especially for those datasets shown in Appendix B (Table B1) which contain (name/surnames and date and time). It would ensure qualitative data in terms of validity.
Improve consistency of data for those datasets that have a relatively low level shown in Appendix A (Table A4)
Serbia
It is important to note that Serbia has a large number of datasets published (about 3,000) from public sector bodies, both central and local. Based on research results, the following evidence-based recommendations should be taken into consideration:
A need to eliminate wrong file formats extension published out of open data standards as well as eliminating the presence of file formats extension in Cyrillic letters such (гејсон or gejson).
All public institutions should publish data constantly and maintain their data based on a regular basis. This process should also be regulated by an internal regulation that urges public sector bodies to keep their data updated constantly.
To enable data querying or discoverability of datasets since this functionality is not active now and has not been applied to any dataset.
To implement a strategy for monitoring and advising the local governments or local public sector bodies to ensure the publication of qualitative data.
To improve data consistency due to the large number of datasets published with low consistency, most commonly from the local level shown in Appendix A (Table A6).
To implement a pre-validation as an independent process that would identify and fix the issues with the validity of data shown in Appendix B (Table B1). It would ensure qualitative data because of the validation process prior to publication.
Footnotes
Appendix A
N/A means not applicable or the metric has not been applied.
Appendix B
Averages of Validity Metrics per Country.

| Country | Public sector bodies | Numeric values | Country codes | Names surnames | Dates |
|---|---|---|---|---|---|
| Albania | National Agency of Information Society | 0.88 | 0.99 | 0.67 | N/A |
| Albania | Ministry of Interior | 0.97 | 0.97 | 0.68 | N/A |
| Albania | Ministry of Defense | 0.93 | 0.98 | 0.78 | N/A |
| Bosna and Herzegovina | Public Finances—Budget | 0 | 0.83 | 0.44 | N/a |
| Kosovo | Ministry of Labor and Welfare Affairs | 0.25 | N/A | 0.29 | 0.31 |
| Kosovo | Ministry of Health | 0.13 | N/A | 0.34 | 0.34 |
| Kosovo | Institute of Public Administration | 0.13 | N/A | 0.25 | 0.31 |
| Kosovo | Agency of Anti-Corruption | 0.5 | N/A | 0.32 | 0.32 |
| Kosovo | Ministry of Economic Development | 0.69 | N/A | 0.39 | 0.41 |
| Kosovo | Commission of Public Procurement Regulations | 0.13 | N/A | 0.35 | 0.40 |
| North Macedonia | Ministry of Health | 0.03 | 0.74 | 0.51 | 0.25 |
| North Macedonia | Public Revenue Office | 0.83 | 0.75 | 0.46 | 0.23 |
| North Macedonia | Customs Administration in NM | 0.29 | 0.78 | 0.42 | 0.26 |
| North Macedonia | Agency for Financial Support of Agriculture and Rural Development | 0 | 0.71 | 0.47 | 0.28 |
| North Macedonia | Agency of Administration | 0.81 | 0.81 | 0.49 | 0.24 |
| North Macedonia | Agency of Electronic Communication | 0.5 | 0.83 | 0.56 | 0.26 |
| North Macedonia | Agency for Real Estate Cadaster | 0 | 0.79 | 0.51 | 0.21 |
| North Macedonia | State Inspectorate for Construction and Urbanism | 0.96 | 0.91 | 0.52 | 0.23 |
| North Macedonia | State Commission for Prevention of Corruption | 0.84 | 0.88 | 0.53 | 0.25 |
| North Macedonia | Ministry of Internal Affairs | 0.3 | 0.84 | 0.44 | 0.28 |
| North Macedonia | City of Skopje—Environment Protection | 0.56 | 0.92 | 0.43 | 0.29 |
| North Macedonia | Ministry of Labor and Social Policy | 0.4 | 0.77 | 0.44 | 0.28 |
| Montenegro | Agency of Peaceful Settlement of Labor Disputes | N/A | N/A | 0.02 | 0.52 |
| Montenegro | Institute of Medicine and Medical Devices | N/A | N/A | 0.01 | 0.56 |
| Montenegro | Ministry of Finance and Social Welfare | N/A | N/A | 0.24 | 0.51 |
| Montenegro | Ministry of Public Administration, Digital Society and Media | N/A | N/A | 0.02 | 0.57 |
| Montenegro | Ministry of Justice, Human and Minority Rights | N/A | N/A | 0.17 | 0.63 |
| Montenegro | Ministry of Labor and Social Welfare | N/A | N/A | 0.16 | 0.69 |
| Montenegro | Directorate of Inspection Affairs | N/A | N/A | 0.24 | 0.52 |
| Montenegro | Institute for Social and Child Protection | N/A | N/A | 0.27 | 0.51 |
| Montenegro | Institute for Meteorology | N/A | N/A | 0.05 | 0.56 |
| Serbia | Ministry of Culture and Information | 0.32 | 0.53 | 0.22 | 0.15 |
| Serbia | Directorate for Agrarian Payments | 0.47 | 0.56 | 0.29 | 0.19 |
| Serbia | Social Innovation Observatory | 0.95 | 0.64 | 0.28 | 0.12 |
| Serbia | Ministry of Construction, Transport and Infrastructure | 0.03 | 0.61 | 0.25 | 0.21 |
| Serbia | Environmental Protection Agency | 0.34 | 0.66 | 0.23 | 0.25 |
| Serbia | Municipality of Velika Plana | 0.02 | 0.49 | 0.26 | 0.22 |
| Serbia | Center for Sustainable Communities | 0.18 | 0.27 | 0.31 | 0.28 |
| Serbia | Municipality of Gornji Milanovac | 0 | 0.42 | 0.27 | 0.29 |
| Serbia | Ministry of Mining and Energy | 0.02 | 0.38 | 0.24 | 0.23 |
| Serbia | City of Leskovac | 0.88 | 0.45 | 0.26 | 0.18 |
| Serbia | Municipality of Topola | 0.08 | 0.84 | 0.29 | 0.16 |
| Serbia | City of Sombor | 0.07 | 0.79 | 0.33 | 0.17 |
| Serbia | Municipality of Arilje | 0.01 | 0.66 | 0.22 | 0.14 |
| Serbia | City of Sabac | 0.35 | 0.55 | 0.24 | 0.19 |
| Serbia | City of Vrsac | 0.35 | 0.69 | 0.21 | 0.2 |
| Serbia | Municipality of Arangelovac | 0 | 0.59 | 0.29 | 0.13 |
Declaration of Conflicting Interests
The author(s) declared no potential conflicts of interest with respect to the research, authorship, and/or publication of this article.
Funding
The author(s) received no financial support for the research, authorship, and/or publication of this article.
Ethical Approval
The author(s) declare(s) an ethics statement for animal and human studies is not applicable at our research