
Abstract
The aim of this study is to search for the relationship between the morphological character of urban space and the rhythms of everyday life. Initially, behavioral maps are created by observing daily life rhythms, video recordings are taken on weekend and weekday, the snapshot technique, video recordings, and the pedestrian count analysis are used. In the second step, morphological analyses of the study area are prepared by using space syntax approach. Connectivity, local, and global integration values are obtained through creating axial map, and, in addition, visibility graph analysis (VGA) is performed. Bursa Kent Meydanı Shopping Center (BKMSC) consists of a square and the shopping units surrounding it. This area was the main transportation point as Central Bus Station Complex until 2006. The area was selected within the scope of the study because its changing public use due to the functional transformation of the area plays a significant role in the identity of the Bursa. The behavioral maps obtained from the observational data give information about user mobility, various actions, and the activities’ locations on weekends and weekdays. By correlating and comparing behavioral and space syntax maps analyses, the relationship between the rhythmic character and the morphological structure of the urban space is tested. The study presents original data by revealing the effects of the morphological elements of Bursa on the daily rhythms of the square of BKMSC. The case study is limited to the surveys conducted in 2 days and three different times of the day. The relationship between observational data and space syntax data shows that daily life rhythms are not independent of the morphological factors.
Introduction
Aim of the Study
The research focuses on the question, “How do spatial configuration, urban equipment, and the functions of spaces in urban squares affect the daily rhythms of urban life?”. The squares, which play an important role in defining the identity of cities, are urban spaces where the change in the rhythms of daily life can be observed most clearly. The vitality of the squares varies depending on the parameters such as the variety of functions, the location in the city, and accessibility. Bursa is a city that has been the capital of the Ottoman Empire for many years. The city was added to the UNESCO heritage list in 2014 with the title “Bursa and Cumalıkızık: the Birth of the Ottoman Empire” and has many important historic urban areas and architectural buildings. Bursa Kent Meydanı Shopping Center (BKMSC), the threshold between the historic city core and the newly developed sub-centers, is one of the critical node points for the city. The square is located at the intersection point of the main urban roads and rail transportation points; therefore, it functions as an urban transportation and meeting hub. The square, a transition point for many city users, visitors, and tourists, has been chosen as a case study area because it reflects the city’s cosmopolitan identity.
The question “How the physical qualities of the urban environment are shaping human behaviors? “ is the subject of environmental behavior research. Analysis of human-environmental interaction is vital for improving the quality of urban spaces. This study reveals the effects of the physical characteristics of the city square on human actions and how different groups of users experience the urban space. It is expected that the research provides spatial and social data to architects and planners interested in square design in urban centers.
The study aims to question the relationship between the everyday life rhythms of urban spaces and urban morphology. To inquiry this relationship, the square of BKMSC is chosen because city squares offer extensive information about the daily life practices of the city. Firstly, the concept of everyday life, its components in various branches of science and its use in urban studies are discussed. Secondly, to enrich the theoretical framework of the research, the adaptation of the space syntax theory is explained to provide information about the city’s morphological character and social life.
Theoretical Background of “Everyday Life” Concept
Everyday life is a concept subject to urban research and involves rich content in terms of the characteristics and usage of urban space. Urban space becomes a living element with city users’ activities and preferences and organized activities and events. The physical boundaries of urban space, the actions of social actors, the rhythms of nature and urban life are constantly interacting within the context of urban space. Thus, everyday life studies offer the opportunity to examine all these elements of urban space.
From the beginning of the twentieth century, the concept of everyday life has become an important research topic in every field, from the sciences to the sociology and philosophy (Şahin & Balta, 2001). Bovone (1989) mentions three main trends in the search for everyday life in social sciences: American micro-sociology, phenomenological approach, and the Marxist approach, which have managed to maintain a holistic perspective (Gumuş, 2017).
Firstly, micro-sociology studies have turned toward cultural investigations involving everyday life experiences instead of the old social science approaches that put ordinary daily events far from the center of history (Iggers, 2012). Secondly, within the perspective of the phenomenological approach, Berger and Luckmann (1966) refer to daily life as a subjective world interpreted by the people. Similarly, Schutz (1962) notes that arises from combining different worlds such as dreams, fantasies, daydreams, play, fiction, and the theatre. In addition, Garfinkel (1967) introduced the concept of “ethnomethodology” and focused on the “discreet activities of the ordinary members of the society” and aimed to “expose the implicit rules of everyday life and its designed nature” (p. 36). Thirdly, as for the Marxist literature, it is accepted that production process and material conditions are the dominant factors shaping people’s everyday lives. Michel De Certeau, Agnes Heller, and Henri Lefebvre are the main figures who researched on everyday daily life theories through a Marxist perspective. De Certeau and Rendall (1984) examined the concept of everyday life through the activities such as eating, drinking, living, and consuming and stressed the ordinary activities regarding everyday life. For instance, Lefebvre (1971) focused on the concept of alienation by analyzing everyday life in modernity. According to him daily life is a moment that is composed of “desires, labors, pleasure - products and achievements - passivity and creativity - means and ends – etc.” (Lefebvre, 1971, p. 14).
Lefebvre put forward the “Rhythmanalytical Project” to develop a new perspective on understanding multifactorial aspects of everyday life. The concept of rhythmanalysis, developed by Lefebvre, referred to the definitions of Dos Santos and Bachelard, was the key term of this project and enabled analyzing space. The concepts of “rhythm” and “moment” introduced in the books, “Critics of Everyday Life-II” (Lefebvre, 1961/2002) and “Production of Space” (Lefebvre, 1974/1991) presented the starting principles of this project. He continued publishing articles on the concept of rhythmanalysis in the 1980s. However, the book “Rhythmanalysis: Space, Time and Everyday Life” (Lefebvre, 1992) was published after his death (Gumuş, 2017).
Everyday life theories display different aspects and multi-functional features of everyday life. This concept represents different meanings in different scientific schools, so it offers developing interpretations about everyday life of urban spaces. Everyday life concept enables to discern multiple aspects of urban spaces including physical and social parameters of urban life.
Literature Review
Everyday Life Theories in Urban Studies
Many studies performed about everyday life in urban scale (Gehl, 1987; Lynch, 1960, 1972, 1981; Whyte, 1980, 1988) are of great importance in terms of understanding the relationship between urban space, everyday life activities and everyday rhythms.
The daily rhythm of urban life is not considered separate from physical structures. Lynch (1960) analyzed the distinctive physical characteristics of cities through five different elements described as paths, edges, nodes, landmarks, and districts. In another study, he used the concept of “orientation in time” to analyze daily routines and temporal organizations in the city’s life and expressed temporal organizations having priority over spatial organizations (Lynch, 1981, p. 452). “The Street Life” project of William H. Whyte that started in 1971 and lasted 3 years was also crucial in showing the everyday life activities in public spaces with different scales and displayed the changing rhythm of the city according to time. In urban spaces, ordinary people’s behaviors, movements, rhythms, and social rituals were detected and depicted through maps.
Everyday life encompasses the whole set of actions people interact with each other and establish through social relationships. This interaction and communication constitute the everyday life space (Heller, 1986). Everyday use in urban spaces directly affects the rhythm and vitality of urban spaces, and urban spaces are reproduced through use (Carmona, 2014). Mobile practices that enable the reproduction of urban spaces (Tartia, 2018), repetitive actions, interruptions, and irruptions (Zayani, 1999) form the basis of everyday life. Everyday life (Highmore, 2011), described as a constantly changing area of experience, also forms the rhythm of urban space. Observing the rhythms of specific locations in an urban environment demonstrates the relationship between place and time (Crang, 2001).
The rhythmanalysis concept of Lefebvre is used to analyze the daily life rhythms of different geographies, different cities, and urban and architectural spaces. This concept which provides social reproduction of space (Lehtovuori & Koskela, 2013), has been the inspiration for many sub-concepts in the literature, such as urban rhythms (Mulíček & Seidenglanz, 2015; Simpson; 2012; Smith & Hetherington, 2013) and collective rhythms. Urban rhythms are produced from multiple and conflicting sources, arising from the tension and relationship between movement, space, and interaction, whereas collective rhythms generate common spaces (Stavrides, 2013).
The concept of rhythm analysis is used as a tool to measure the socio-cultural and concrete qualities of cities (Nash, 2020), and to analyze multiple urban rhythms which are social, non-human, corporeal, mobile, and institutional (Lager et al., 2016) and to determine individual, collective, and cultural social rhythms of pastoral societies (Rongna & Jiuxia, 2020). In addition to studies examining the theoretical nature of the concept of rhythm analysis (Crang, 2001; Lee, 2017; Mayer, 2008; Mendieta, 2008), studies using it as an analytical tool have revealed changing and repetitive daily rhythms in urban space (Cihanger Ribeiro, 2019; Simpson, 2008; Wunderlich, 2008, 2013). These studies have guided the determination of the character of the spaces by revealing the usage of public spaces. Commercial rhythms (Kärrholm, 2009) and rhythms of walking (Edensor, 2010), which play a decisive role in the daily use of urban space, combine with many other rhythms such as such as traffic, seasons, lunchtimes, working hours, climatic conditions in the squares, which are the critical intersections of the city, and form spatial rhythms specific to a particular place. Therefore, as Jacobs emphasized the more diverse the daily use and user diversity of a city’s public places, the more successful the public space (Jacobs, 1961).
Space Syntax and Everyday Life
The morphology and spatial configuration of urban space are the most important factors affecting human behaviors. Space syntax approach focuses on spatial configuration of urban or architectural spaces and reduce spatial characteristics of spaces to axial maps and convex spaces (Hillier & Hanson, 1984). In the axial maps, each line denotes the linear distance, which represents the furthest point that can be seen. The axial mapping technique is used to reveal the spatial characteristics of urban spaces stemmed from their morphological structure.
The study conducted by Miranda et al. (2020) revealed the relationship between historic urban centers and developing subcenters through syntactic analyses of urban form. In their research, McCartney & Krishnamurthy (2018) aim to solve spatial problems in contemporary cities by performing morphology and syntactic analysis of slums and informal settlements. Zheng et al. (2022) demonstrated the relationship between spatial configuration and urban agglomeration with their analysis on a regional scale. It should be investigated that urban and intercity transportation causes different spatial effects, although movement flow and socio-economic activity are directly related to transportation networks. Pafka et al. (2018) stated that the space syntax approach contributes greatly to understanding the relationship between urban morphology and social integration but should not be accepted as the only method because of its limitations.
According to this method, people’s movements arising from the morphological features of the space are defined as “natural movement” (Hillier, 1996). People’s perception of space guides their movements. Therefore, it is possible to explain the effects of spatial configuration on social life and social interaction by analyzing “integration” and “connectivity” parameters of the axial maps of urban spaces.
Integration value is the main subject of space syntax. This value, which allows an interpretation of urban spaces’ quality, density, and potential, is examined on two different scales: global (Rn) and local (R3) scales. Global integration value is defined as the depth of each line in the system; while local integration is defined as “integration values of axial lines at the radius 3 (root plus two topological steps from the root), which can be used to represent a localized picture of integration” (Hillier, 1996, p. 99).
Connectivity value “is the number of other lines with which an axial line intersects” (Hillier & Hanson, 1984, p. 103). Therefore, the high connectivity value means that the accessibility value of the axes is high. Visibility Graph Analysis (VGA), which provides information about the potential of the visual experience of space (Turner et al., 2001), is another parameter that affects pedestrian mobility. Visibility graph analysis “investigates the properties of a visibility graph derived from a spatial environment. The VGA can be applied to two levels, eye level for what people can see, and knee level for how people can move which is critical to understand spatial layouts” (Turner et al., 2001, pp. 108, 109). Within the scope of this study, VGA analysis is performed to characterize visible areas at eye level.
In the literature, case studies show that local integration value is significant in determining pedestrian movements, and the global integration value is measured at high values at the main arteries of the city (Kaya & Bölen, 2017). In addition, visual and spatial integration . . ., and experiences (Desyllas & Duxbury, 2001; Hillier et al., 1993; Mahmoud & Omar, 2015; Parvin et al., 2007).
The daily use of the urban space affected by morphology as well as social, cultural, and temporal parameters. Space syntax is used to understand the city’s socio-spatial structure (Charalambous, 2020; Topçu, 2019; Topcu & Kubat, 2012) and the the formation of the urban feature (Sakar & Ünlü, 2019) by revealing the structure of urban configuration that has evolved. Space syntax method applied to the urban squares (Arruda Campos, 1997, 2000; Major et al., 1999, 2000; Safari & Moridani, 2017; Yılmaz Çakmak & Topçu, 2018) reveals the daily rhythms and provides comprehensive data such as areas suitable for social interaction, accessibility level, pedestrian and vehicle traffic density, isolated areas, visible areas, and the visibility level of spaces.
Analyzing the Everyday Life of the Square of Bursa Kent Meydani Shopping Center (BKMSC)
Identification of the Site
Bursa Kent Meydanı (Figure 1) is designed as a shopping center and a public square by K2Y Architecture Office who was the winner of the competition held in 2006. Before the decision of making a center of attraction by Bursa Municipality, the area was a bus station.
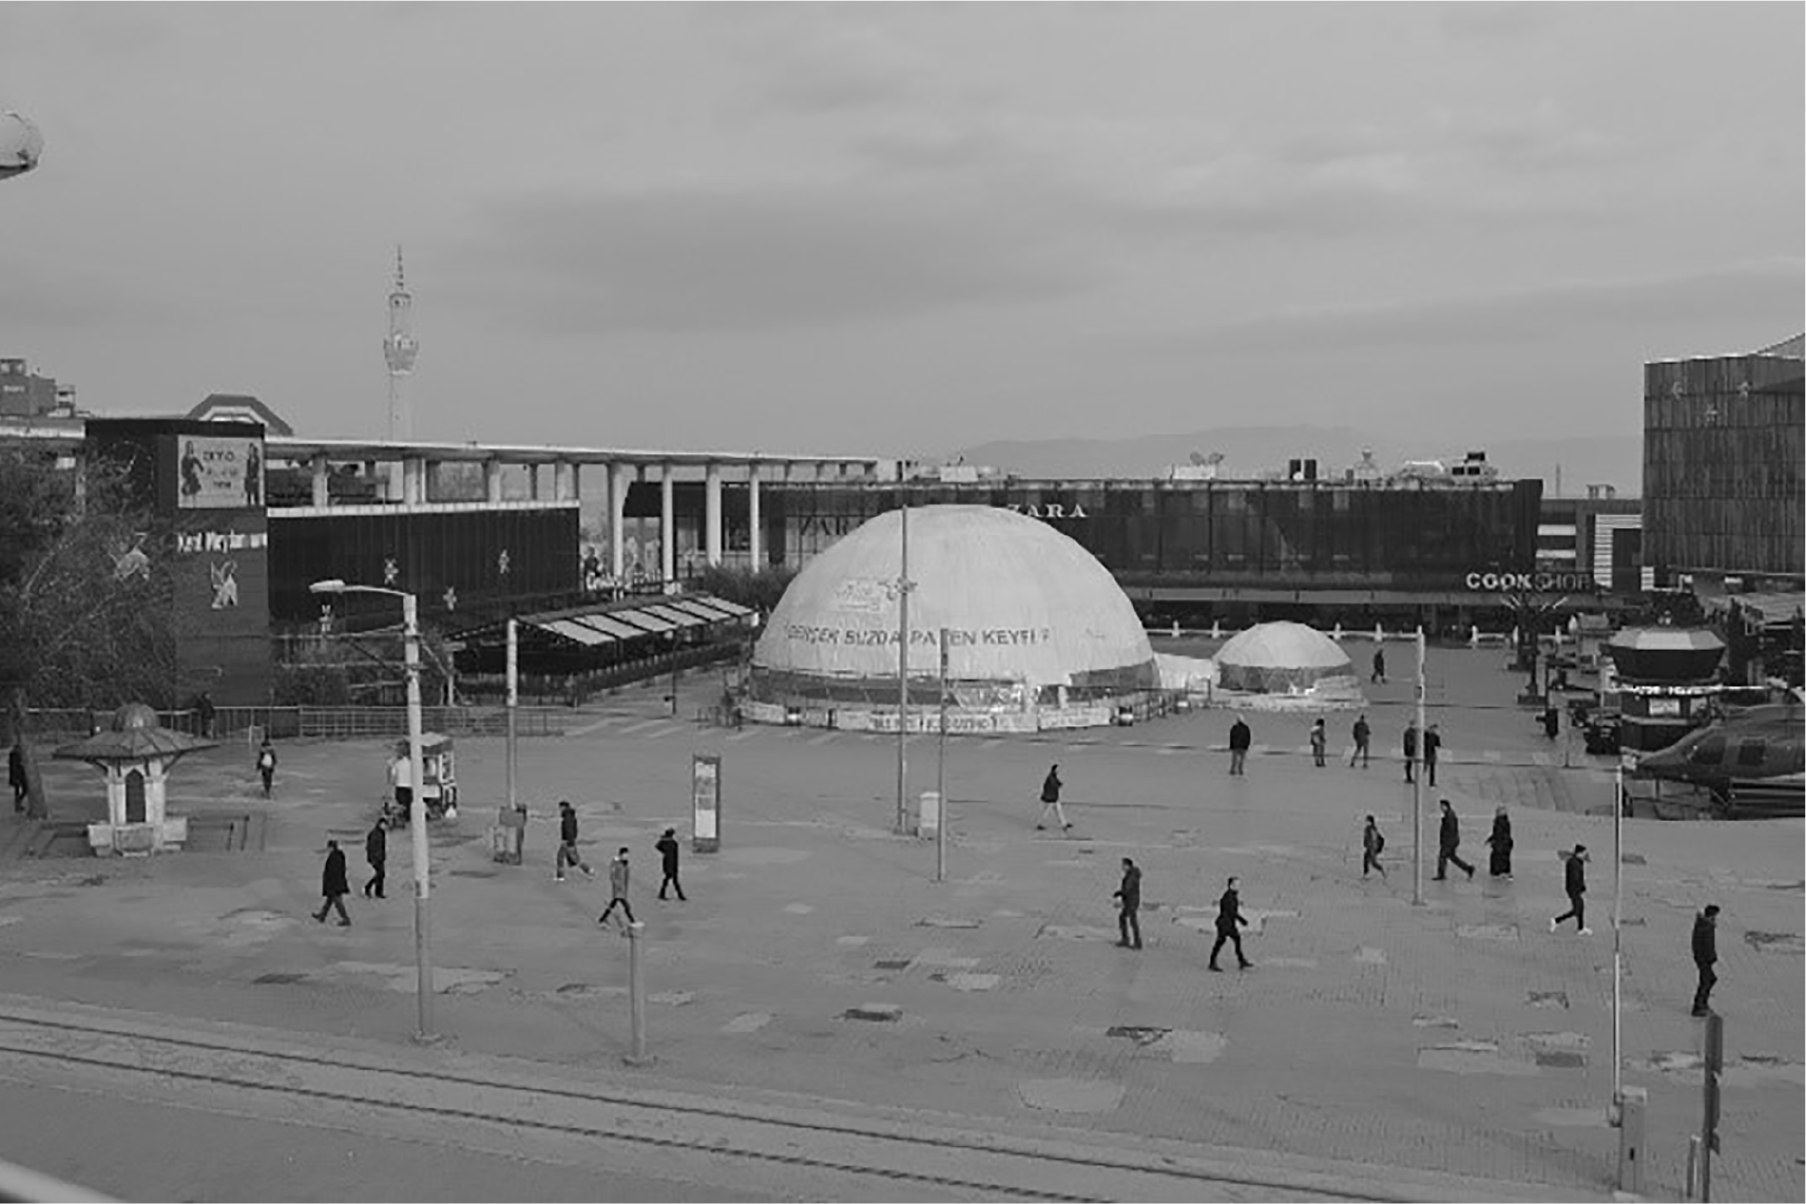
General view (by authors).
Bursa city received extensive migration by establishing industrial facilities in the 1950s. For reasons such as the inclusion of large industrial companies in the region and the collection of many automotive industrial companies in this neighborhood, Bursa Urban Square was planned as the terminal. The Central Bus Station Complex, founded in 1957, was activated in 1961, and is functioned as a transportation point that connects all the city’s garages. A large part of the building was damaged by a fire in 1978 in the part of the garage used as a tobacco warehouse. After that, Bursa Intercity Bus Station Architectural Project Competition was opened in 1987. This region, which is connected between the city of Istanbul and other northern cities of Turkey and the southern and western cities, is a transit center. With the expansion of the city over time, it was seen that the terminal building increased the traffic in the city. For this reason, the terminal building has been moved to Istanbul Road. In the development plan created in 1998, the region was declared as a central business area. Afterwards, with the development plan change approved in 2005, it was decided to use the old central garage area as an urban square. In addition, as a note to the development plan, it has been added that there will be offices, office buildings, entertainment, food and beverage units, cultural facilities such as bazaars, banks, cinemas, theaters, and management offices in the region. For this purpose, the region was opened to the “Bursa Central Bus Station Urban Square Architectural and Urban Planning Project Competition” in 2006, and some changes were made in the selected project as a result of the competition.
The project occupies 30.000 m2 land area with 6.500 m2 open-air space, 72.774 m2 indoor area in total. In the scope of this study, daily-life analysis of the square of BKMSC, as one of the most significant public space in the city, has been carried out through observations, video recordings, photographs, and behavioral maps. The effect of spatial components in human behavior and repetitive actions taking place in the square are interrogated. The primary purpose of this study is to reveal the unique urban features of the public space by tackling urban rhythms and everyday life routines through physical qualification.
Key Features of the Square of BKMSC
The square of BKMSC as a public area, consists of wide range of activity areas unlike many shopping centers. Cafés and restaurants located nearby the square contribute the vitality of space. As a result of observations, four different urban equipment has been identified that affect people’s actions: activity tents, sitting units, fountain, and staircases (Figure 2). Those four impact the daily rhythms of the users apart from their primary function.

Key features of the square (with the permission of K2Y Architecture Office).
The fountain
“Water should be accessible, touchable, splashable.” (Whyte, 1980, p. 49)
Whyte (1980) stated that touchable water sources are important in public spaces. For safety, water elements should be carried out carefully and the noise level should not exceed 75 decibels for people to hear each other easily. As a dynamic element, the fountain at the north edge is activated in different times a day (Figure 3).
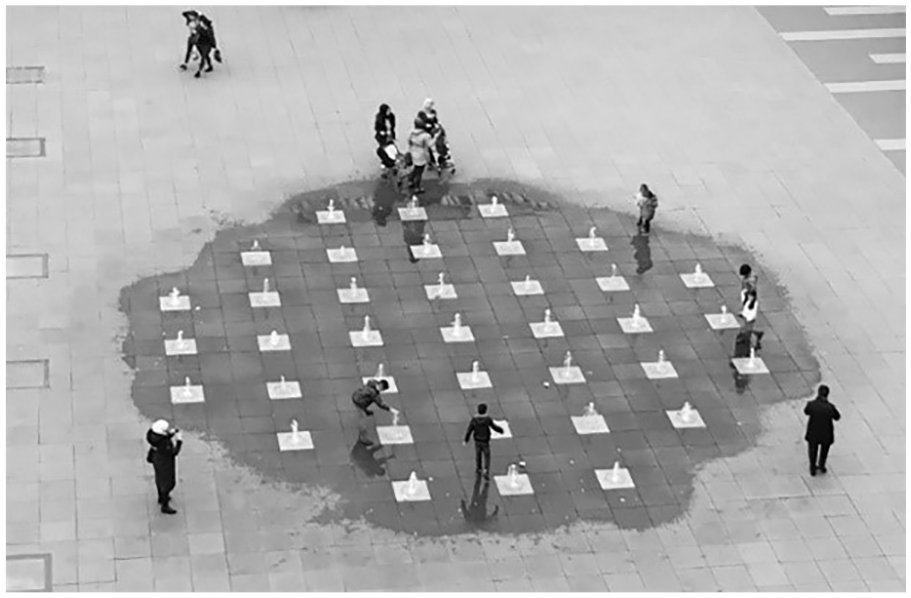
The fountain (by authors).
Free-seating area
“Fixed individual seats deny choice. The designer is saying you sit here and you sit there. This is arrogant of him. People are much better at this than designers.” (Whyte, 1988, p. 121)
According to Whyte (1988), giving people a choice in seating areas significantly influenced the quality of public space. For example, movable chairs can adjust their location due to sun rays or fix the distance between people. Likewise, Gehl (1987) states that there is a connection between the presence of seating activities and quality of the public space. According to him, if there are elements that encourage people for long-lasting sit in a public space, it can maintain its vitality.
In BUS, wooden seating units are positioned perpendicular to the square at different lengths underneath the lightning elements. Those units give a common resting space for activities like waiting, smoking, chatting, and reading books. Wooden material of the elements, in contrast with the concrete floor are used as a playing area by kids.
Gehl (2010) divides the living units into two groups, primary and secondary, regarding comfort parameters. The primary ones consist of designed seating areas, benches, and chairs. Secondary ones are not designed for sitting but are used by people (Figure 4).

Types of free-seating units—primary seating areas (by authors).
The staircase is used as a secondary seating area in the square. According to Gehl, while young people tend to feel comfortable on surfaces or places (secondary area), the elderly prefer the primary areas.
Food and beverage units in public space are also the factors affecting space use and pedestrian flow. Eating and drinking units in the square increase the number of people in the seating areas. Whyte (1980) mentions that “if you want to seed a place with activity, put out food” (p. 50). Thus, pedestrian flow is most affected by the food, beverage, and ice-cream kiosks.
Activity zone and urban stairs
“Optional activities – that is, those pursuits that are participated in if there is a wish to do so and if time and place make it possible –are quite another matter.” (Gehl, 1987, p. 9)
Ice-skating area with a detachable pneumatic system below (designed in two sizes of units for registration and activity) is one of the two different activity areas determined. The transparent material at the eye level of canopy allows people to monitor the activities inside. Other activity area is the helicopter simulation-unit located at southwest of the square which is used extensively by children, contributes the use of the square with its visual and functional effect (Figure 5).
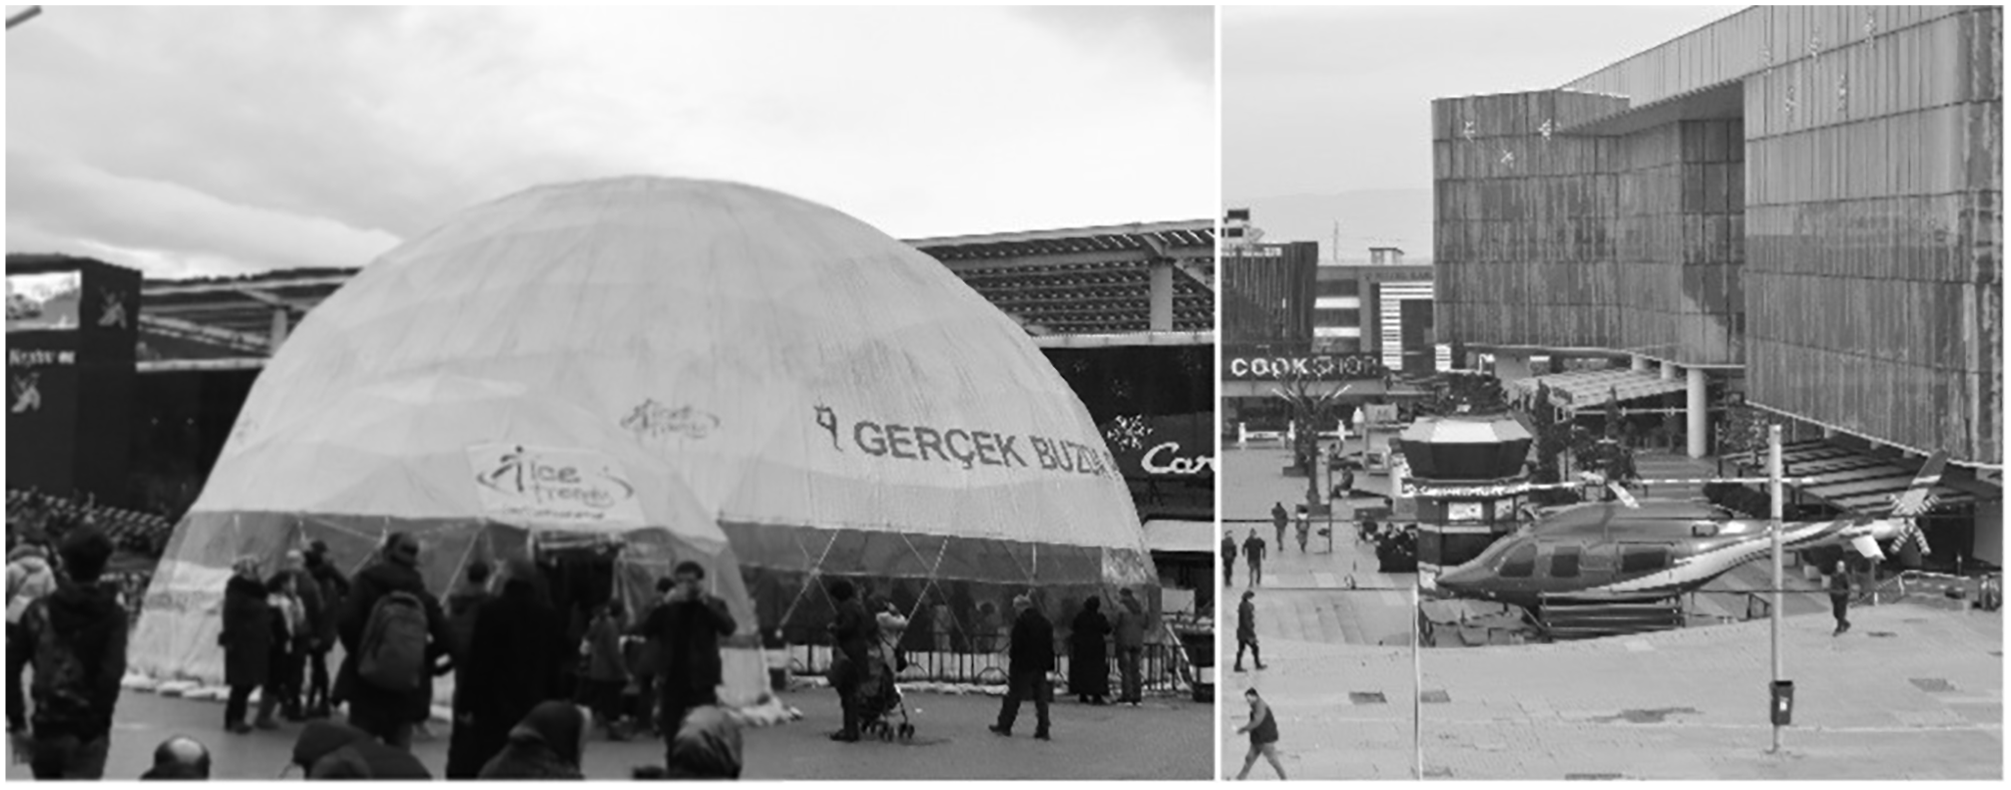
Activity zones: ice-skating rink and helicopter (by authors).
The urban stairs as a connection to the city, lead people to the square. Consisting 14 steps, the stairs, defines a U shape like an amphitheater used for accessing, meeting, waiting, and sitting (Figure 6).

Urban stairs (by authors).
Methods and Data Collection
Behavioral Mapping
The methods used by Whyte in his books “The Urban Life of Small Urban Spaces” (Whyte, 1980) and “City: Rediscovering the Center” (Whyte, 1988) are adopted for this study. He used the direct observation to create behavioral maps to comprehend intensity of usage of particular urban spaces.
Behavioral mapping has emerged to reveal the connection between the movement of people and the physical environment. It is based on Gibson’s (1977) concept of “affordances” and Barker’s (1968) concept of “behavior setting,” who are one of the pioneers of environmental psychology. The behavioral mapping technique is used in various urban studies (Cosco et al., 2010; Gehl, 2002, 2004; Hill, 1984; Malone & Tranter, 2003; Milke et al., 2009; Proshansky et al., 1976; Refshauge et al., 2013) In this study, behavioral mapping is adopted to determine and classify activities in the square.
In the study, firstly observation, counting, and video recordings were made to determine the rhythms of the square, and then the variety of activities, location preferences of pedestrians, space-time relationship were revealed. The behavioral mapping technique was used in the morning, noon, and evening time on Friday and Sunday. The pedestrian counts were obtained by shooting 30 minutes of video from the roof of the triangle-shaped building in the morning, noon, and evening hours on 2nd of February 2018 (Friday) and 4th of February 2018 (Sunday). The squarely flooring of the square was taken as a reference point for determining the location of pedestrians, and behavioral maps were created.
Space Syntax
Space syntax is an analysis method that expresses the relationship between the configurative features of urban spaces and human behavior through numerical values. For this reason, it provides information about pedestrian movements and potentials of urban spaces. As part of space syntax method, integration, connectivity, and visibility graph analysis (VGA) are used for evaluating everyday life rhythms of the square of BKMSC. Space syntax analysis is needed to reveal the relationship between spatial configuration and daily life rhythms in this study. So, axial maps and convex spaces are created to obtain local and global integration, connectivity values, and visibility graph analysis (VGA). The effect of these values on the daily rhythms of the square reveals the decisive role of the spatial configuration.
Findings of the Study
Behavioral Mapping Assessment
Basic activities in the square
This section demonstrated the number of activities and the number of people observed in the square on maps. The daily activities and intensity of use were expressed using behavioral mapping technique. These maps were obtained by video recordings on Friday and Sunday morning (10.00–10.30), noon (12.30–13.00), and evening (16.30–17.00). They were taken from the roof top of the main building which is marked on the following images.
Watching activity are defined related to activity areas within the scope of the study. As a result of the shots taken from the roof, the people sitting and watching their surroundings are classified in the “sitting activity” because it is not sure whether the watching activity has occurred or not. On the other hand, people prefer to watch the activities in the temporary activity areas in the square while standing.
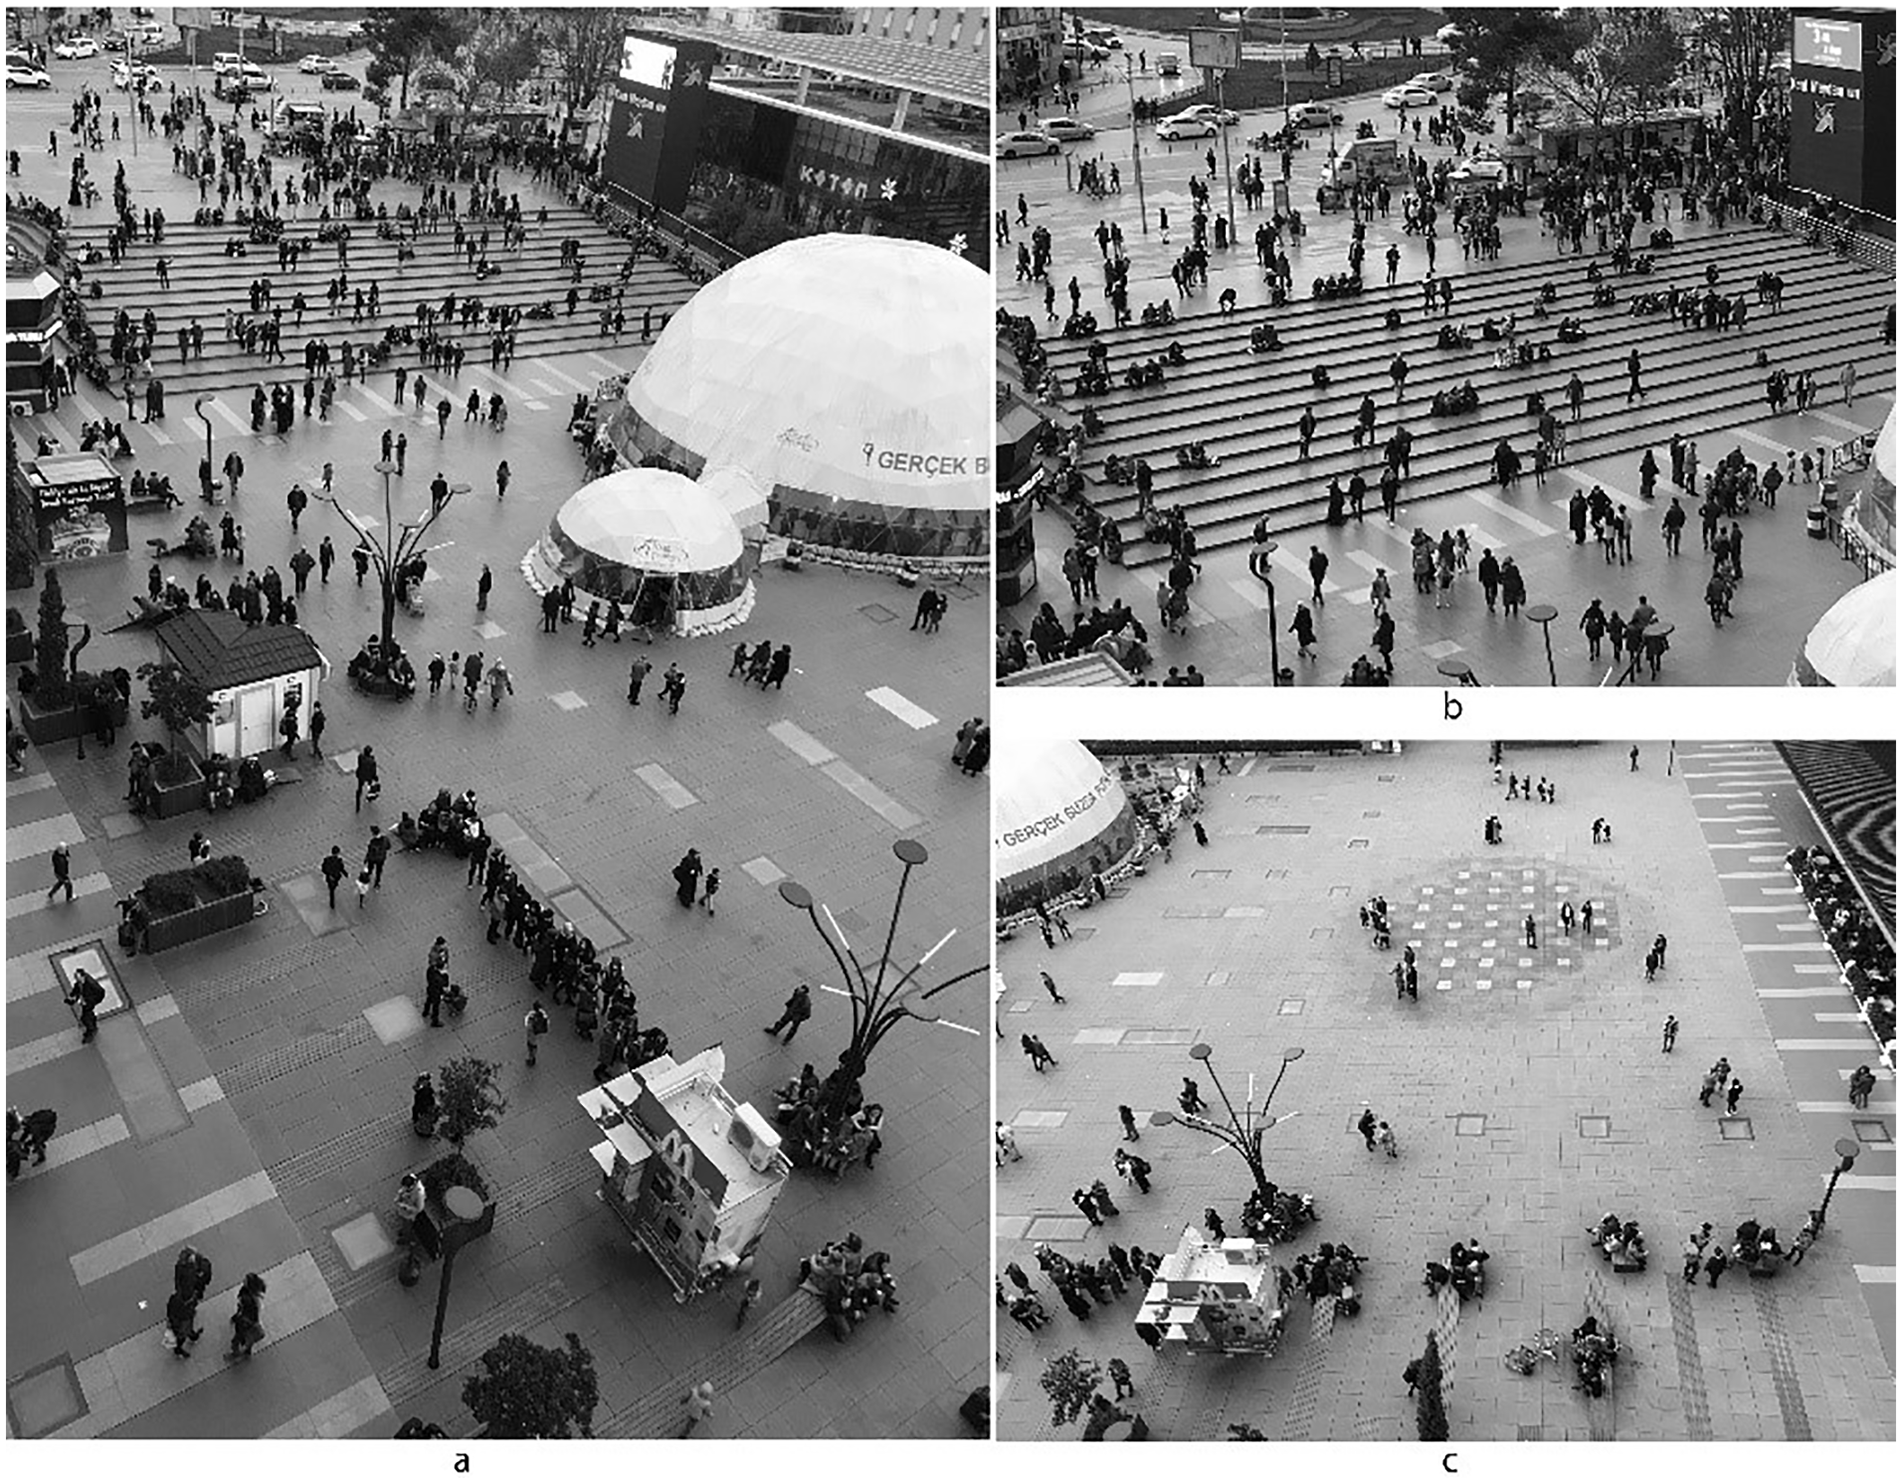
On Friday morning, the stairs hosted a high density. Some users monitored the activities, some stood nearby the helicopter simulation. The goods were carried by the time the mall opened. Fountain area was used by kids as a playground (Figure 7). The crowd, especially the young population around activity zones, increased at noon. People tended to take pictures there or just stood. Meeting and gathering became the main activity where more kids were seen around fountain (Figure 8).

Friday morning: (a) playing area for children, (b and c) waiting area, and (d) resting area for people.

Behavioral maps of Bursa Kent Meydanı Square on Friday.
The square was tranquil on Sunday morning. An increase was observed in pedestrian activity at Sunday noon. Employees and people taking photos around the helicopter were the main users. Seating areas served as a gathering place, fountain area was a passageway. The density and pedestrian mobility of the square reached their maximum level during Sunday evening hours. The square was a stage where all different activities took place. Queues occurred in food and beverage units. The square, used intensively by people of all age groups, serves as a shopping center and a public activity area for inhabitants (Figure 9). The square was transformed into a stage, where different activities occurred (Figure 10).
Sunday evening: (a) general view, (b) urban stairs, and (c) fountain.

Behavioral maps of Bursa Kent Meydanı Square on Sunday.
Type of clusters
In order to identify the groups of visitors, video recordings were utilized. The user groups were listed following the strategy of Kärrholm (2015). This was examined under 10 different headings: man, woman, man + woman, man + man, man + woman + child/children, children + children, children + group of three to five people (Table 1).
Types of Clusters on Friday and Sunday.

According to data based on video recordings, single men were seen more than single women; the area was used as a meeting point for both genders on Sunday morning. As groups, women were observed more than men that meant women did not prefer to be alone there. On Friday noon and evening, groups of three to five people were significant, larger groups mostly used this area on Sunday evening.
Friday afternoon and evening hours were the second most preferred intervals; the number of people was slightly double in the morning. On Sunday, the difference became more observable; evening was 3.5 times and lunch hour was 4.5 times the morning. General working hours and break times/holidays were the main factors in this difference. For Lefebvre (1971), daily life is reduced by numerical data such as numbers, measurements, and time intervals. For him, this situation is the result of the pressure of capitalism on daily life.
Observational results
The behavioral maps were based on the results of videos converted from numerical data as follows. The table showed the number of actions at different times throughout the day. According to the table, the square was used as a transition area on Friday and Sunday evenings. There was an acceleration seen on activity areas on Friday afternoon and evening and Sunday evening (Table 2).
Number of People Performing Different Activities at Different Times.
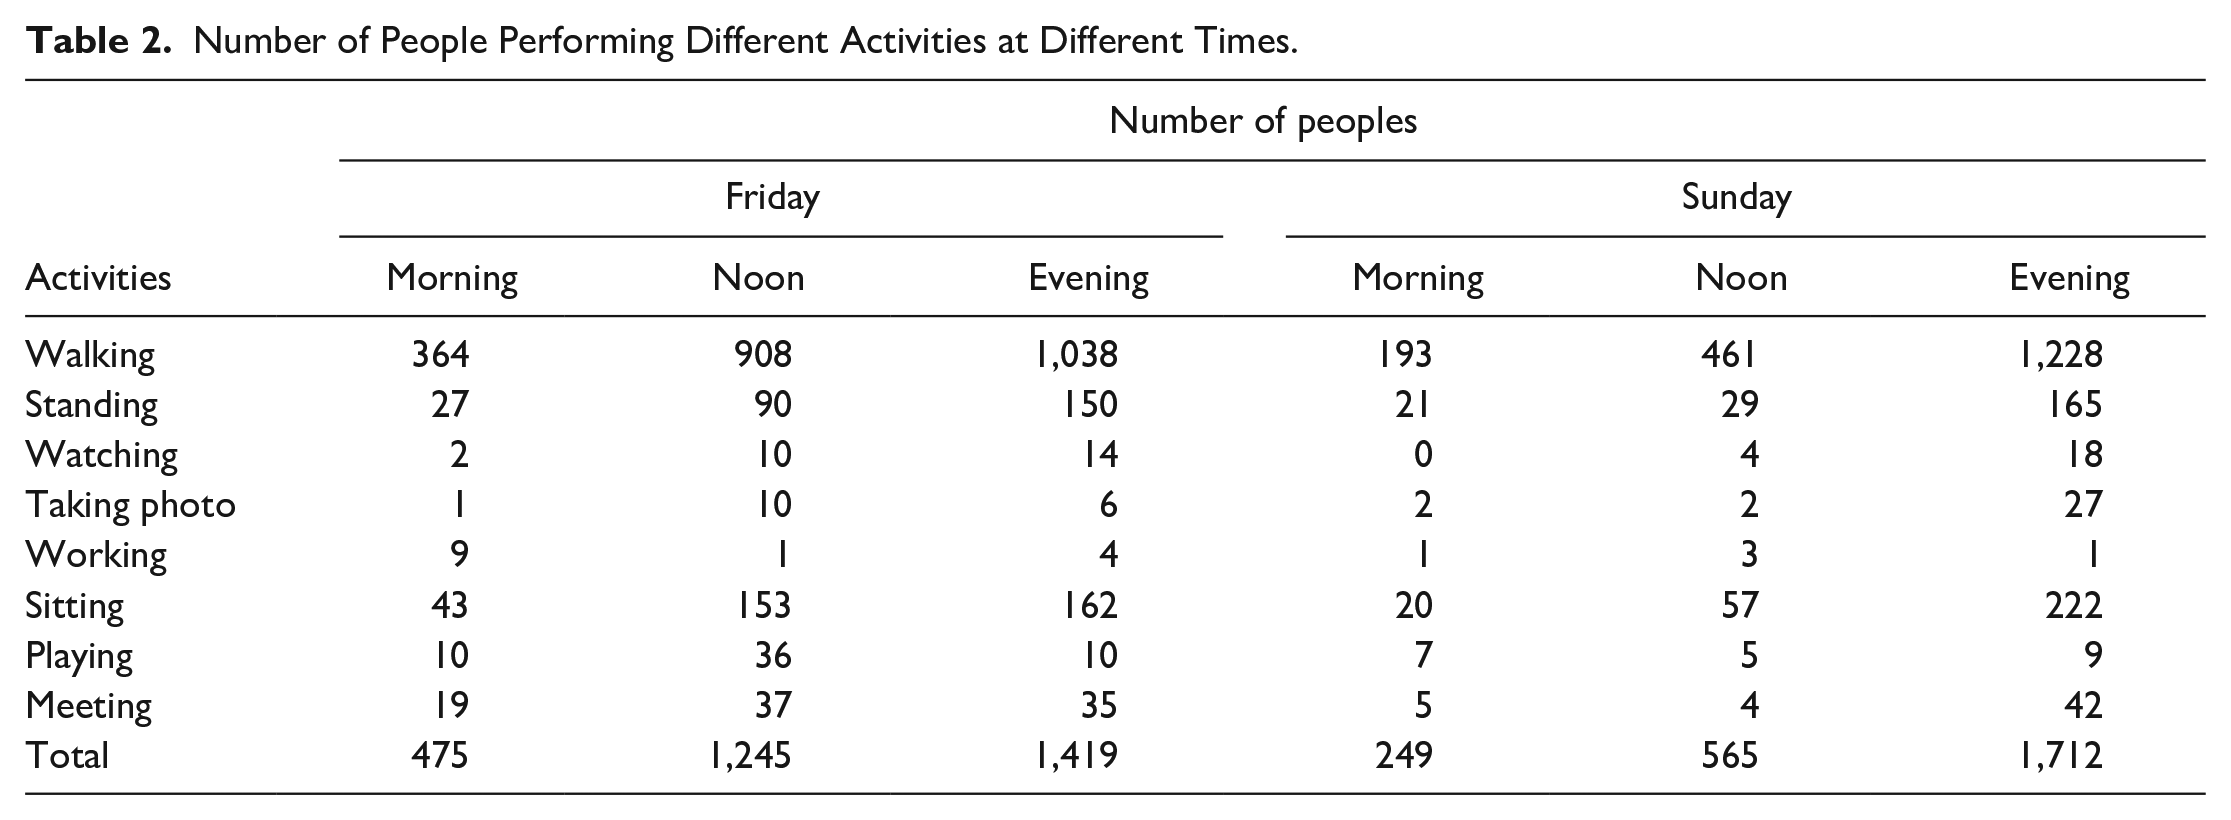
In this area, young population was quite high. The number of people taking photographs was reached the top level in Sunday evening. While the number of sitting people at Friday noon and evening were the same, it increased significantly in Sunday evening. Children were seen at maximum at Friday noon. Meeting citizens were mostly observed at Friday noon and in Sunday evening (Figure 11).

Comparisons of behavioral mappings of the square.
Table 3 shows the activity areas chosen on Friday. The urban stairs were the most used for walking. Around the seating units, standing was the most intensified. Monitoring took place only in activity zones and people tended to take pictures here and around fountain. Employees were observed around activity areas and seating units. Top score of playing activities were seen around fountain then the seating units which kids played.
The Distribution of Basic Activities at Each Location (Friday).
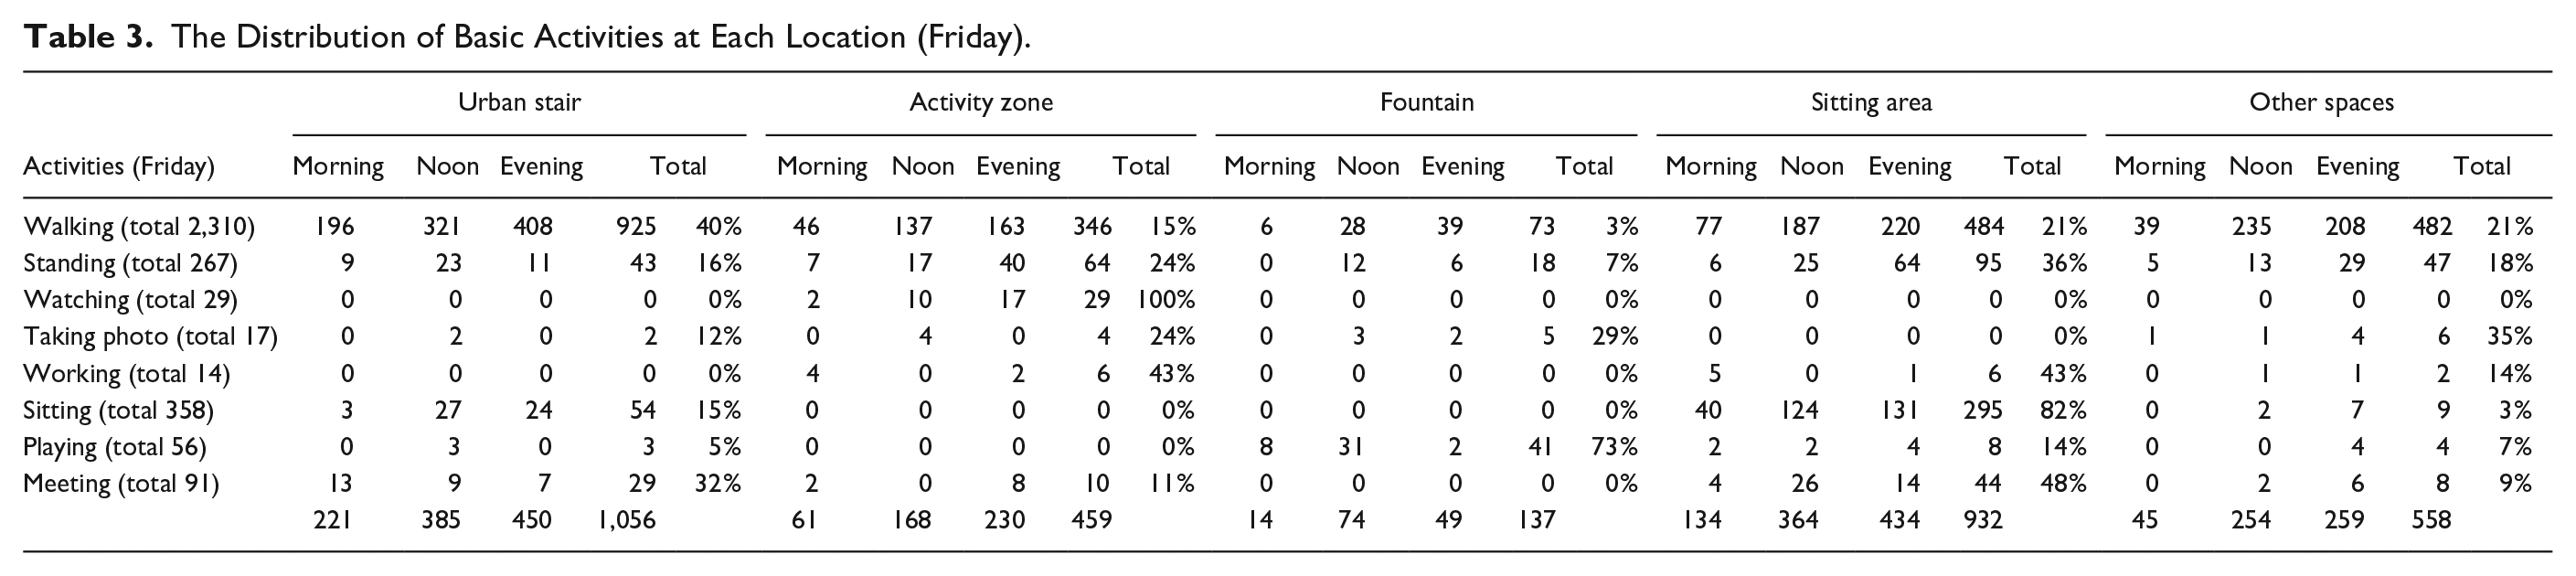
Table 4 shows the regions of different actions on Sunday. Walking activity was concentrated on the stairs where seating units were used by waiting and standing people. Monitoring activity took place around activity zone even the photographing was at most around the fountain. As the seating units were insufficient, stairs were used for sitting. Fountain, seating units and other spaces were used by children for playing.
The Distribution of Basic Activities at Each Location (Sunday).

In comparison, the number of people in weekend was less than the weekdays. However, the intensity of use of the square was higher than weekdays, people spent more time. The number of people passing through was higher in the weekdays. As the graphs above showed the changing rhythm, the pedestrian action observed at different times showed how the city was transformed into a living organism. Everyday life involves variable rhythms as a result of encounters in urban space and repetitive actions. Observations in the square, generated behavioral maps, photo, and video analysis have revealed that some regions are used intensively by certain age groups and some regions are specialized for certain purposes and actions (Figure 12).
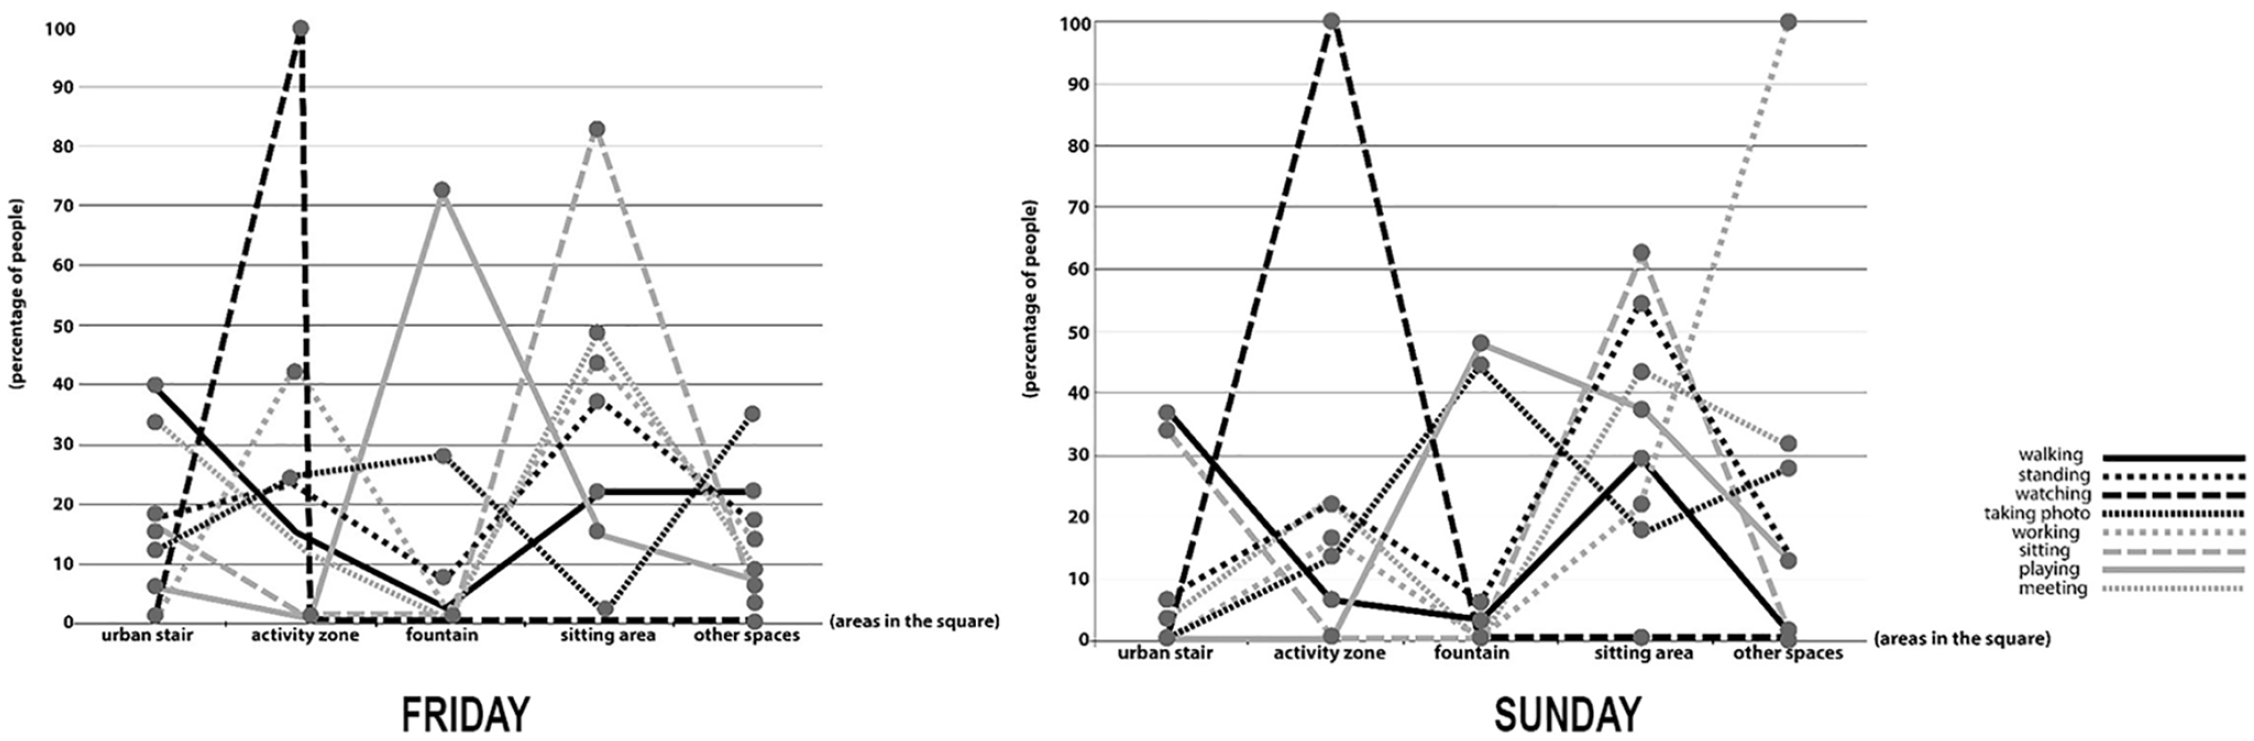
The diagramming of the distribution of basic activities at each location, from the behavioral maps, Friday and Sunday.
Morphological Analysis and Comparisons
Syntactic outcome
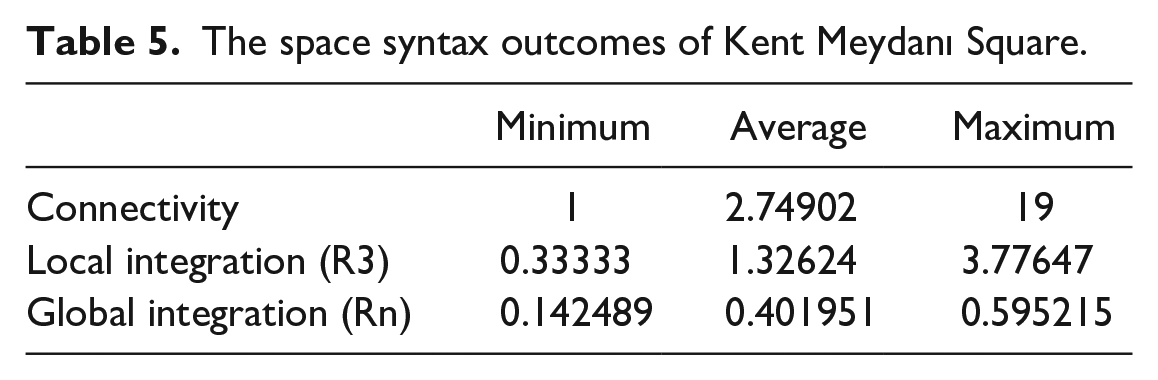
As a result of the space syntax analysis, it is seen that the square defines an accessible urban space in the urban context it is located. Connectivity and local integration analyses show that the square is an important urban space with high pedestrian mobility, user diversity, accessibility, and everyday life rhythm. Therefore, BUS has served as a social interaction hub in Bursa. Global integration value shows that the square is in the middle level of integration with the whole city. The space syntax (ss) values of the square are given in Table 5. The average connectivity of the field is 2,74902; local integration value is measured as 1.32624 and global integration value is 0.401951.
The space syntax outcomes of Kent Meydanı Square.
It has been seen in connectivity analysis that the square is accessed through the Kıbrıs Şehitleri Street which has a high connectivity value. L1404 and L1415 axes which are connecting shopping center to Kıbrıs Şehitleri Street have the highest accessibility value. These axes are the shortest routes preferred to reach the shopping center entrances.
The global integration value of Ankara and İstanbul Highways, which are the main axes of Bursa city, and Ulubatlı Hasan Boulevard leading to Mudanya and İzmir, has been measured as high. These axes are those that have high interaction with the whole city. It is possible to reach the square via these axes, by metro, and by foot from the city center.
The square has a high local integration value and creates an open urban space where citizens and visitors interact in Bursa. In the square, the axes drawn according to the entrances of the buildings and pedestrian flows have the highest local integration value in the studied urban context. The local integration value indicates the axes with high movement potential for local users. The square serves as an interaction point for city users (Figure 13).
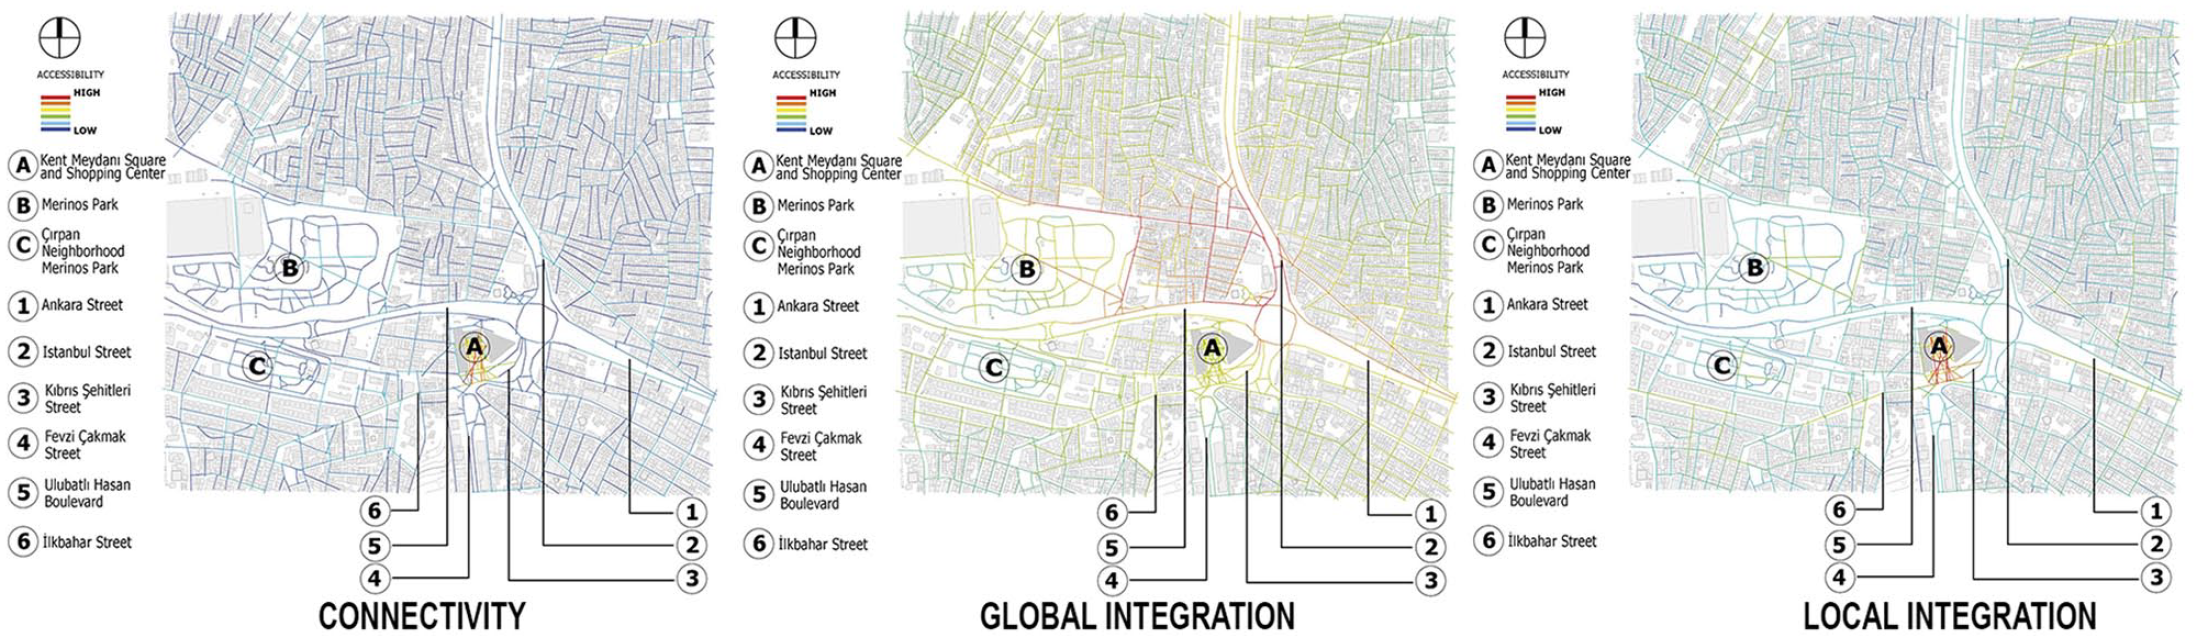
Connectivity, global and local integration maps of the square.
Three different building blocks define the shape of the square. The entries of the blocks and the movement routes in the square have determined the position of the axes. The accessibility value of L1400, L1404, and L1415 axis is the highest. The local integration value of the L1400, L1404, L1406, L1415, and L1429 axes are the highest; Local integration value of L1401, L1414, and L1482 axes are measured as medium high. Pedestrian mobility is envisaged as high on these routes. The global integration value of L1408 and L1482 axes are the highest (Supplemental Table 1) According to the VGA analysis, the urban stair area is the highest urban attraction, followed by the activity areas, the seating area and the area where the fountain is located, respectively. As long as fountain is active, it creates an attraction point in the square, however, it does not affect syntax analysis because it is an independent element (Figure 14).

(a) Connectivity map, (b) local integration map, (c) global integration map, and (d) visibility graph analysis (VGA).
Behavioral mappings and space syntax comparisons in the square
Behavior maps of the square and space syntax analysis were overlapped, and thus layered maps regarding Friday and Sunday has been obtained. According to the VGA analysis, it has been revealed that the urban stairs, which are the most attractive area, are also used extensively in the behavior maps. The locations and intensity of actions on the behavior maps confirm the SS data. Similarly, pedestrian density is observed on the axes (L1400, L1404, and L1415) with the highest connectivity and accessibility values. However, it is necessary to mention some exceptional situations. The areas built as temporary activity areas did not affect the space syntax analysis because the drawn axes were not interrupted. However, SS data is not different from observational data. On the axes with the highest local integration value, the high variety of activities are observed in the behavior maps made on Friday (Figure 15a and b).

(a) VGA + connectivity + behavioral mapping (friday), (b) VGA + local integration + behavioral mapping (friday), (c) VGA + connectivity + behavioral mapping (sunday), and (d) VGA + local integration + behavioral mapping (sunday).
Maps shown in Figure 15c and d are obtained by overlapping the behavioral maps and space syntax analyzes. In these maps, high pedestrian density is observed in the L1400 and L1404 axes with high connectivity value. Similarly, human density is observed in the L1406 and L1429 axes with local integration value. The sitting area on Sunday and the urban stair area are used more intensely on Friday.
When the pedestrian counts of the observational analysis and the space syntax data are compared, it is calculated that the average connectivity, local, and global integration values of the axes passing through each region in the square referred to five different sub-regions. Accordingly, the urban stair (3,489113), which has the highest local integration value, is also the region where the most pedestrian mobility (1,609 people) is observed. The urban stairs constitute the entrance of the square to access the other sub-regions of the square and the shopping center. This region allows the square to be integrated into the entire city. The measured highest global integration value in this region confirms the observational data. This region has the highest accessibility value concerning SS analysis and it has been verifying observational data. The activity areas (3,251970), which have the second highest local integration value, are also where group/interaction activities are most intense (80). Thirdly, fountain, whose local integration value is measured as 3,124747, has the lowest values in the activities in three different groups. This is because the active and passive state of the water element varies during the day. When the fountain is not active, a continuation is perceived on the flooring and does not directly affect the actions. However, SS data reveals that this region has high interaction potential (Table 6).
The Behavioral and Spatial Comparisons of Sub-Regions of the Square.

This study has shown the daily life rhythms of the square, the diversity of users and activities through qualitative and quantitative methods. In addition, unlike the work of Lefebvre, Lynch, Whyte, and Gehl, being superposed of the morphological character of the urban space with daily life rhythms has provided a multi-layered information. Behavioral maps provide comprehensive information on analyzing the character of urban space, while user profile and syntactic data contain multi-layered spatial information that guides everyday life. Analysis of public spaces at the crucial points of cities contributed to the understanding of socio-spatial practices that lead architectural and urban planning dynamics.
Conclusion
The changing rhythm of everyday life against the stationary morphological character of the space affects the usage and intensity of the urban space. Comparing observational data and SS analysis, pedestrian mobility, intensity of use, accessibility potential, urban attraction areas overlap considerably. For example, urban stairs, which provide access to the square, turns into an activity area, allowing the square to be used as a stage. This data overlaps with SS analysis. However, urban space elements that can change/transform at different times of the day are not visible in urban morphology. These transformable elements can only be understood by observation and experience of daily life, and their impact and contribution to the urban rhythm. For example, the running of fountain directly affects the pedestrian mobility in the square. Seating elements designed in the square are used out of their function and sometimes as a playground for children. This area is also located at the entrance point of the mall. The changing uses of urban furniture in daily life affect the quality of user actions and pedestrian mobility.
The relationship between SS analysis and behavioral maps are tested on the square. The square plays an important role in terms of the daily life of the city. Especially, the square provides a vivid urban space with high pedestrian mobility and offers people-to-people interaction through urban activities. The connectivity, local integration, global integration, and VGA analyzes, obtained with the axis maps drawn concerning the physical limits of the square and on the urban scale, provide data on the role of the square in the urban context, the pedestrian mobility and interaction potential in everyday life. Behavioral maps obtained as a result of observational data express the everyday life rhythm, user diversity, and pedestrian flow of the square. Analysis shows that the morphological and physical structure of the square is effective on everyday life rhythms, as a result of overlapping numerical data and observational data. SS provides data on the usage potential of urban spaces, social interaction, and everyday life rhythm. These data, which can be measured depending on the morphological character of the studied urban context, are reduced to the mathematical values. On the other hand, behavioral maps obtained by observational data, allow the testing of these reduced mathematical values. Consequently, this comparison reveals the effect of the morphological character of the urban space on the everyday rhythm of urban life. This study explains that everyday life rhythms of urban spaces are not independent of the morphological elements.
Limitations of the Present Study
The study was carried out by limiting in to 2 days, Friday and Sunday. Although the shots taken from the roof offer a holistic perspective in the analysis of human mobility, they make it difficult to detect some categories of activity. Therefore, it is important to perform eye level and top view shots simultaneously with two or more people in the study in order to achieve comprehensive results. Moreover, adding analyses performed in different seasons to this study can provide more data in terms of daily life rhythms.
Supplemental Material
sj-docx-1-sgo-10.1177_21582440221104090 – Supplemental material for An Evaluation of the Relationship Between Everyday Life Rhythms and Urban Morphology: The Square Of Bursa Kent Meydani Shopping Center, Turkey
Supplemental material, sj-docx-1-sgo-10.1177_21582440221104090 for An Evaluation of the Relationship Between Everyday Life Rhythms and Urban Morphology: The Square Of Bursa Kent Meydani Shopping Center, Turkey by İmran Gümüş and Ebru Yılmaz in SAGE Open
Footnotes
Declaration of Conflicting Interests
The author declared no potential conflicts of interest with respect to the research, authorship, and/or publication of this article.
Funding
The author(s) received no financial support for the research, authorship, and/or publication of this article.
Supplemental Material
Supplemental material for this article is available online.
References
Supplementary Material
Please find the following supplemental material available below.
For Open Access articles published under a Creative Commons License, all supplemental material carries the same license as the article it is associated with.
For non-Open Access articles published, all supplemental material carries a non-exclusive license, and permission requests for re-use of supplemental material or any part of supplemental material shall be sent directly to the copyright owner as specified in the copyright notice associated with the article.