
Abstract
The content analysis approach is well-established and acknowledged sociological research technique, although it is constantly evolving and its field of application is expanding. The aim of the article is to demonstrate the possibilities to use the content analysis method in urban studies. It includes the analysis of literature and the example of methodology design in the frame of case of the study of modernization of Lithuanian cities during the Soviet period. It can be concluded that the content analysis method is a flexible tool that can be integrated both with sociospatial (sociotope methodology) and spatial (Space Syntax, multimodal graph) research methods and reinforce social dimension in spatial analysis of cities.
Keywords
Introduction
The term content analysis currently is more than 70 years old. It was formalized in the 1950s (Berelson, 1952), however, according to Krippendorff (2004), the intellectual roots of content analysis can be traced far back in history and researchers practiced similar approaches earlier (e.g., Lasswell (1927, 1938) than Berelson and Lazarsfeld (1948) undertook the first codification of this method. Currently, it is recognized as one of the most important research techniques in the social sciences (Krippendorff, 1989, 2004). Content analysis can be broadly defined as “the scientific study of content of communication” (Prasad, 2018). The content analysis method is constantly evolving and its field of application is expanding. When the method had emerged in the field of communication research, it was seen as quantitative and objective (Trace, 2001). For example, Berelson (1952) suggested that content analysis is objective, systematic, and quantitative. However, the rise of qualitative approaches and the acknowledgment of subjectivity in social sciences in the 1970s had affected the content analysis methodology, and qualitative content analysis had been developed around 1985 (Mayring, 2000). Currently, both strongly quantitative and qualitative content analysis and the whole spectrum of intermediary approaches exist (Hashemnezhad, 2015). According to Mayring (2000), it is possible to preserve the advantages of quantitative content analysis (objectivity, systematic approach, generalizability) and to transfer and further develop them to qualitative-interpretative steps of analysis.
The object of content analysis is communication. According to Holsti (1969), the content analyst can describe the characteristics of communications in terms of “what,” “how,” and “to whom” to infer their antecedents in terms of “who” and “why,” and their consequences in terms of “with what effects.” Even if traditionally content analysis was applied to such forms of communication as narrative texts including political speeches, transcribed interviews, and published literature (Trace, 2001), the spectrum of potentially usable data currently has considerably expanded, and nowadays, content analysis may be used with different kind qualitative or quantitative, textual, and imagery data (Hashemnezhad, 2015; Ownby, 2013; Stepchenkova & Zhan, 2013), with manifest and latent content (Gavora, 2015). The data used in content analysis include various types of published and nonpublished texts including books and journal articles, transcripts of interviews and discussions, protocols of observations, letters, diaries, legislation, regulations, other public documents, and so on, the editorial and advertising content of newspapers and magazines, the narrative and form of films, TV programs and other audio and video material (Bielavitz, 2011; Mayring, 2000; Prasad, 2018; U.S. Government Accountability Office [U.S. GAO], 1989), all sort of other recorded communication (Mayring, 2000), paintings, maps, digital images (Zabulis & Orphanoudakis, 2001), software, Internet contents including user-generated content, and social media websites (Stepchenkova & Zhan, 2013). Even landscapes and cityscapes are often considered as a form of “text” (Stepchenkova & Zhan, 2013).
The spectrum of usable data demonstrate that the application of the content analysis method has long ago crossed the boundaries of communication studies; currently, the method is used in photo-documentation research, sociology, anthropology (Ownby, 2013), psychology, media research, historical and political research, language studies (Prasad, 2018), educational research (Gavora, 2015), applied by governmental agencies (U.S. GAO, 1989), and so on. The fields of landscape research and urban studies are not exception too.
This research is aimed at demonstrating the possibilities to integrate the content analysis method into urban research using the case of the study of modernization of Lithuanian cities during the Soviet period and its influence on contemporary urbanism. To reach this aim, the literature and examples of the use of content analysis in urban studies and related fields and the experience of integration of content analysis with other methods were reviewed, and the methodological part of the case study showing the use and potentials of quantitative content analysis in urban research and its integration with sociotope method and multimodal graph was presented. The content analysis of the accumulated visual material provided the information on the uses of the public spaces of Kaunas city (Lithuania) by different types of users in the past, which was integrated with the spatial data using geographic information system (GIS) and the correlations of content analysis results and multimodal models were determined. This allowed to successfully integrate the sociological data with spatial urban research.
Literature Review
Sociological research and various sociological research methods from surveys to observation are deeply rooted in the field of urban studies (Paddison, 2001), and content analysis method is not an exception. However, the analysis of literature revealed that the applications of content analysis in this field are relatively rare. Several below presented trends of application of content analysis in urban studies and related fields can be distinguished after the analysis of literature.
Analysis of urban planning literature and graphical and text parts of planning documents: Content analyses of urban planning literature were carried out from the initial stages of development of the method (Guttenberg, 1967). Various examples of such studies can be presented. For example, Ishikawa (2012) examined nine major textbooks in urban planning and identified 127 important terms from the textbook indexes, the degrees of similarity between pairs of the terms were computed through the analysis of the pattern of co-occurrence, and the important terms were further classified based on this similarity measure. Kumagai and Filion (2012) carried out the content analysis of the planning documents from the major urban areas in Japan and Canada in the frame of the analysis of planning and the risk of disasters. Da Silva Oliveira (2015) carried out the content analysis of development plans, strategic initiatives, and policy documents in the context of the study of place branding and strategic spatial planning. Norton (2008) developed the proposals for the adaptation of the content analysis method for the analysis of local master plans and zoning codes and developed a series of criteria for evaluation of these documents based on the case study of Central Michigan. Bielavitz (2011) carried out the content analysis of strategic plans of academic libraries to find out how academic libraries support their universities’ goals of urban engagement and community involvement.
Analysis of other types of media related to urban planning: For example, Velasco (2016) performed the analysis of contents of urban planning–related YouTube channels. The study analyzed how the U.S. City Planning Departments can involve citizens more comprehensively into planning processes by sharing educational videos through online platforms.
Content analysis of contemporary and historic maps: Muehlenhaus (2011) had analyzed 256 historic maps published since 1800 and used for persuasive purposes.
Understanding of different environments and related aspects through content analysis of photographs: Byrne (2014) analyzed the contribution of photography to understanding the mental health hospital environment. Stepchenkova and Zhan (2013) had analyzed and compared images of Peru collected from the destination marketing organizations sites (530 images) and from photo-sharing web site Flickr (500 images) in their analysis of destination photography.
Content analysis of interviews and surveys data: O’Neil and Gallagher (2014) used this method to analyze the views of practitioners at workshops in the field of development of urban green networks. de Alba (2012) used content analysis to understand urban collective memory, the experiences and social representations of the people who have lived in Mexico City for the last five or six decades.
The interdisciplinary nature of urban studies requires effective integration of methods applied. According to Xerez and Fonseca (2011), the integrated research methods matter to enrich theoretical and empirical urban research. According to Creswell (2009), mixed-methods approach can offer a better understanding of the research problem than either method on its own. Literature demonstrates that content analysis can be successfully integrated with various research methods and tools. For example, Xerez and Fonseca (2011) carried out the analysis of the contents of movies, photographs, maps, literature in their study of community networks in Alvade (Portugal) and integrated the content analysis in their methodology design encompassing qualitative and quantitative data, interviews, ethnographic observation, research in archives and identified it as a mixed-methods approach (Creswell, 2009; Xerez & Fonseca, 2011). Creswell (2009) even identifies the mixed-method approach integrating the qualitative and quantitative methods as the third perspective in research methods in addition to the qualitative and quantitative methods. Rucks-Ahidiana and Bierbaum (2015) discuss the integration of spatial analysis of environment and social sciences. According to Leetaru (2012), spatial analysis is a relatively untouched topic in the discipline of content analysis due to the complexity of necessary GIS tools; however, geocoding and spatial analysis can play an integral role in any content analysis project, creating a new and rich dimension of locative information.
Case Study
The identified potential of content analysis as a flexible tool for integrated research, the experience of its application in urban studies as well as its potential of combining with spatial analyses justifies the further analysis using the case of the study of modernization of Lithuanian cities during the Soviet period and its influence on contemporary urbanism. The study was started in 2017 with the aim to study the fundamental changes of genotypes of Lithuanian cities, which had occurred due to the impact of modernistic urban planning of the Soviet period. Genotype here is seen as the basic set or model of the features of urban spatial structure that have a fundamental influence on the processes occurring in the city and their location. Meanwhile a phenotype is the aggregate of both fundamental and nonfundamental features of particular space. The interdisciplinary theory of networks and mathematical network models were selected as the main tool of the research. Space Syntax method (Hillier & Hanson, 1984) is often chosen to model the urban spatial structure because of the following reasons: perception of urban open space as a container of various social/cultural contents instead of analyzing space as a void between buildings or focusing just on logistic function; developed mathematical apparatus based on mathematical graph model and possibility to have qualitative indicators while analyzing qualitative aspects of spatial configurations; modeling of urban structure as a network of spaces thus reflecting nature of complex urban integrated system; a large number of tested Space Syntax models, which prove its correlations with a variety of urban processes.
Despite the abovementioned arguments, the weak point of Space Syntax models should be mentioned: it does not allow to reflect a multilayered, multimodal nature of contemporary city in one graph. It means that it is not possible to reflect in one map a difference between elements such as pedestrian paths (which are very important for functioning of typical modernistic housing blocks), streets (which could be used by both cars and pedestrians), streets with and without public transport lines, and so on. The need for multimodality of syntactic models was addressed and demonstrated by a number of researchers (Gil, 2012; Law, Chiaradia, & Schwander, 2012; Schwander, 2007; Zhang, Chiaradia, & Zhuang, 2014). Despite relatively small number of publications and final agreement on how to model multimodal graph not reached, the abovementioned researches have demonstrated the potential and relevance of the approach. During the Soviet period, the cities’ public transport in Lithuania was significantly developed and, as it can be expected, has made a significant impact on usage of public spaces. Therefore, it was decided to use a multimodal Space Syntax graph in this research.
The methodological outline of the study was the following: collection and systematization of historical data (different types of images, maps, etc.) concerning the development of spatial structure and the social processes in public spaces of the three largest cities of the country (Vilnius, Kaunas, and Klaipeda) before and during the Soviet era; adaptation and development of the innovative model of multimodal graph to analyze everyday functioning of the city and its changes brought by development of public transportation network and resulting large-scale separation of traffic flows; testing the developed model using the case of Kaunas by comparing the calculations of the multimodal graph with the historical and contemporary data on the functioning and uses of public spaces in the city; the application of the tested model to Vilnius and Klaipeda and evaluation of the transformations of the genotypes of urban spatial structure that had occurred during the Soviet period and their significance in a wider time frame of 1939 to 2016. The quantitative content analysis method and the sociotope method were selected as tools for analysis of the phenomena of functioning and uses of public spaces before and during the Soviet period and nowadays. The challenge was to design the content analysis study and to ingrate it into the overall methodology of the project, finding its meaningful and beneficial links with sociotope methodology, GIS, and multimodal graph.
Design of Content Analysis Study and Integration With Sociotope Method
The analysis of literature demonstrates that studies using content analysis usually involve three main phases: preparation, organization, and reporting of results (Elo et al., 2014). These stages can be further subdivided into a series of steps (Prasad, 2018; U.S. GAO, 1989), for example, formulation of the research question or objectives, selection of communication content and sample, selection of units of analysis, developing coding categories, coding the material, analyzing and interpreting the results.
The main research question and general objectives were formulated in the methodological framework of the study, where the decision was taken to use the content analysis in the research. The aim of the content analysis of this case study was to determine the types of activities by a variety of users in different public spaces of Kaunas (Lithuania) in the past periods. In such case, the direct sociological observation is not possible. These uses, users, and the types of public spaces were identified in each of the collected images under analysis. In the following stage, GIS was employed and the information from the content analysis was transferred on the maps identifying the geographical location of the spaces identified in the images under analysis and attributing the specific users and activities identified in the content analysis to these specific locations in the city. This followed by the analysis of correlations of the mapped content analysis results and the multimodal models developed in the context of this case study.
The selected communication content for the analysis was the material accumulated in the course of the study: a volume of historical and contemporary photographs, postcards, images from newspapers, books, and other media that constitute the evidence of activities; functions; and users in public spaces of different types. In the first stage of the study the majority of accumulated material is related with the city of Kaunas, which was selected for testing the multimodal graph model. The collected images were classified according to the period, which they represent: interwar photographs taken around the year 1939 showing the urban spaces and life in them before the modernist interventions, photographs of the Soviet period of the year 1960 to 1990 representing the most intensive modernization, and contemporary photographs showing the present-day functioning and uses of modernist and modernized urban spaces. All the available images of public spaces around the year 1939 were collected; when collecting the images of the later periods, the attention was focused on representing all the possible types of activities in all types of public spaces. The collected material was placed in the online database used for the purposes of the study. 234 photographs representing Kaunas of the interwar era around 1939, and 909 photographs representing the modernized city of the Soviet period and 713 contemporary photographs from publicly accessible media sources are currently accumulated.
Development of coding categories is very important stage in the process of content analysis. For the development of content categories, the directed approach as identified by Hsieh and Shannon (2005) and Hashemnezhad (2015), when initial coding starts with a theory or relevant research findings and then, during the data analysis, the researchers allow additional themes to emerge from the data, was selected. According to them, the purpose of directed approach usually is to validate or develop a conceptual framework or theory. In this case, the aim is to test the developed multimodal graph model. Researching the phenomena of functioning and uses of public spaces, the interaction between three sets of categories—typology of public spaces, typology of their users, and typology of activities taking place there—is important. Thus, these three types of categories were distinguished.
The classification of public spaces was developed based on literature and the peculiarities of Soviet era urbanism and the general overview of contents of accumulated material. The research by Sandalack and Uribe (2010) was used as a basis for distinguishing such public space types as streets, other linear elements, such as paths, trails, bikeways, urban squares, representative spaces in front to buildings, parks and gardens, natural and seminatural territories in the city, cemeteries, and outdoor sport facilities. Considering the features of modernist urban planning, such categories as publicly accessible spaces around buildings and publicly accessible yards in modernist residential blocks were distinguished. The nationalization of land of the Soviet period had determined that traditionally closed private spaces, such as inner courtyards of perimetric urban structure, became public and accessible; consequently, these were also included into classification. The typology of users was developed based on the general overview of collected historical material and existing classifications (UrbSpace Project, 2017) and includes adults, seniors, preschool age children, schoolchildren, teenagers, youth, parents or childcarers with children, people with disabilities, tourists and visitors, and uniformed officers. For the development of categories of activities in public spaces, the existing sociotope methodology was used. The methodology of sociotope map was developed by Swedish urban planners and has been first of all developed and applied in Stockholm (Samuelsson et al., 2018), then in Goteborg (Ask, 2013), and elsewhere. The term “sociotope” derives and is an extension of the term “biotope,” the sociotope is seen as a place of human activities, a distinct environment in its sociocultural context. The main purpose of such map is to collect, through dialogue, enhance, and disseminate the knowledge of how open spaces function as habitats for the people who live and work in the city (Stadsbyggnadskontoret Gatu- och fastighetskontoret, 2002). Different versions of sociotope maps identify slightly different use values of public spaces. For example, the sociotope map of Stockholm has 31 sociotope values, meanwhile Goteborg’s map has 20 values (Ask, 2013). By analyzing and comparing different sociotope map examples and the contents of the collected material, we have distinguished 21 use values based on sociotope methodology and 11 additional uses identified from the analyzed material. The distinguished use values can be seen in Table 1.
Use Values of Public Spaces Used for Coding the Images Distinguished Using Sociotope Methodology (Ask, 2013) and General Overview of Collected Material.

The sociotope methodology is simultaneously applied to study the contemporary functioning and uses of public spaces in Kaunas in the frame of this project and is mutually integrated with the content analysis. For example, the sociotope methodology provides the list of activities or use values of public spaces that are used in content analysis; meanwhile the typologies of public spaces and users from content analysis are used in developing and adapting to Kaunas context the sociotope methodology tools, such as questionnaires and checklists. Moreover, the content analysis of historical images contributes to the selection of the most characteristic urban areas for sociotope mapping. This shows that both methodologies—sociological and sociospatial—can be well integrated in urban research.
Integration of Content Analysis With GIS
The content analysis allowed both general overview and detailed analysis of collected material, coding the images, and tagging the types of users, use values, identifying precise geographical locations represented in photographs, and classifying them into standard types of spaces mentioned above. This approach allowed to link the specific use values and types of users identified in photographs with particular places in the city and the types of public spaces. However, the accumulated and generated data require spatial representation for both the integration with the outcomes of sociotope mapping and the comparison with the developed model of multimodal graph.
GIS software ArcMap was applied for this research to link the findings of content analysis with spatial data. The axial maps of Kaunas in 1939, 1970s, and in 2016 showing the axes of automobile roads, pedestrian paths, and the locations of buildings were created using historical and contemporary reference maps. Public spaces were traced on these maps using polygon function in the layer created for this purpose. The same classification of public spaces was used for outlining the public spaces on the maps. Attribute tables with the series of attributes were created using the same categories applied in the content analysis—i.e., the typology of users and the typology of use values (Table 1). This allowed the presence of specific types of users and activities identified in the images in the content analysis to be linked with the geographical location in the maps (Figure 1) and further development of research, where GIS serves as a medium for integrating the content analysis and sociotope mapping results and comparing them with the multimodal graph model.

The window of ArcMap showing the fragment of the axial map of Kaunas representing the Soviet period with the outlined polygons representing the typology of public spaces and the attribute table showing the presence/absence of specific types of users and activities in the spaces outlined in light blue color.
Content Analysis and Multimodal Graph
Dependencies between the results of content analysis and spatial configuration in Kaunas around 1939 were already analyzed and are used here as the example of compatibility of content analysis and multimodal graph. The traditional Space Syntax segment analysis (Turner, 2004) was used for modeling of spatial urban network. According to it, any straight street segment between two crossroads or changes of direction of movement were considered as a node of the graph. The segment analysis is based on so-called secondary approach in urban graph modeling (Porta, Crucitti, & Latora, 2006). It models street segment as graph nodes instead of crossroads (primal approach) and thus allows more straight focus on public spaces as containers of street culture. The following improvements were made in the Space Syntax methodology to create a multimodal graph model of the network of public urban spaces:
Three types of traffic (pedestrians, individual cars, public transport) were incorporated into the same radius, while the traditional Space Syntax segment analysis allows to focus on it indirectly through the application of different radiuses, for example, the most realistic radius for pedestrians might be 2,000 m, for cars—maximum radius n, for public transport—depending on its routes, and so on.
The abovementioned incorporation of three types of transport into one radius was performed by marking the possible maximum travel speed on each street segment as an additional attribute. Walking speed was considered equal to 5 km/hr, car speed = 40 km/hr, and public transport speed = 30 km/hr. It is important to note that such approach allowed to show pedestrian paths in the parks, funiculars, rafts, railroad bridge accessible for pedestrians and public stairs as part of the same network besides the streets. Speed was transformed into travel time, which was used as the custom distance in graph calculation instead of accumulated angular, topological, or metric distance in traditional Space Syntax segment analysis. Three different travel scenarios were identified: (a) walking and using public transport, where it is available; (b) walking and using individual car, where it is possible; (c) just walking everywhere, where it is possible. The second scenario was considered not so relevant in the period under analysis because of very small number of individual automobiles in Kaunas in 1939. The third scenario was abandoned because of the city size, which makes it impossible to function just on the basis of pedestrian movement. It is important to note that in the further research with focus on the Soviet period and the present situation all three scenarios will be combined in the final multimodal graph as the reflection of more advanced technological development level of urban infrastructure.
The most actual travel radius was identified in a similar way as in radius–radius method proposed by B. Hillier (1996): the mean distance from the area of Kaunas, which was found to be closest to the rest of the network was taken as the common radius. It was found to be equal to 4,000 m.
The graph with the total number of the nodes equal to 9,348 was constructed (Figure 2).

Kaunas in 1939: Network of public spaces with public transport routes marked in red.
Various types of centralities were calculated for the graph of public urban spaces based on Scenario Number 1 including the following:
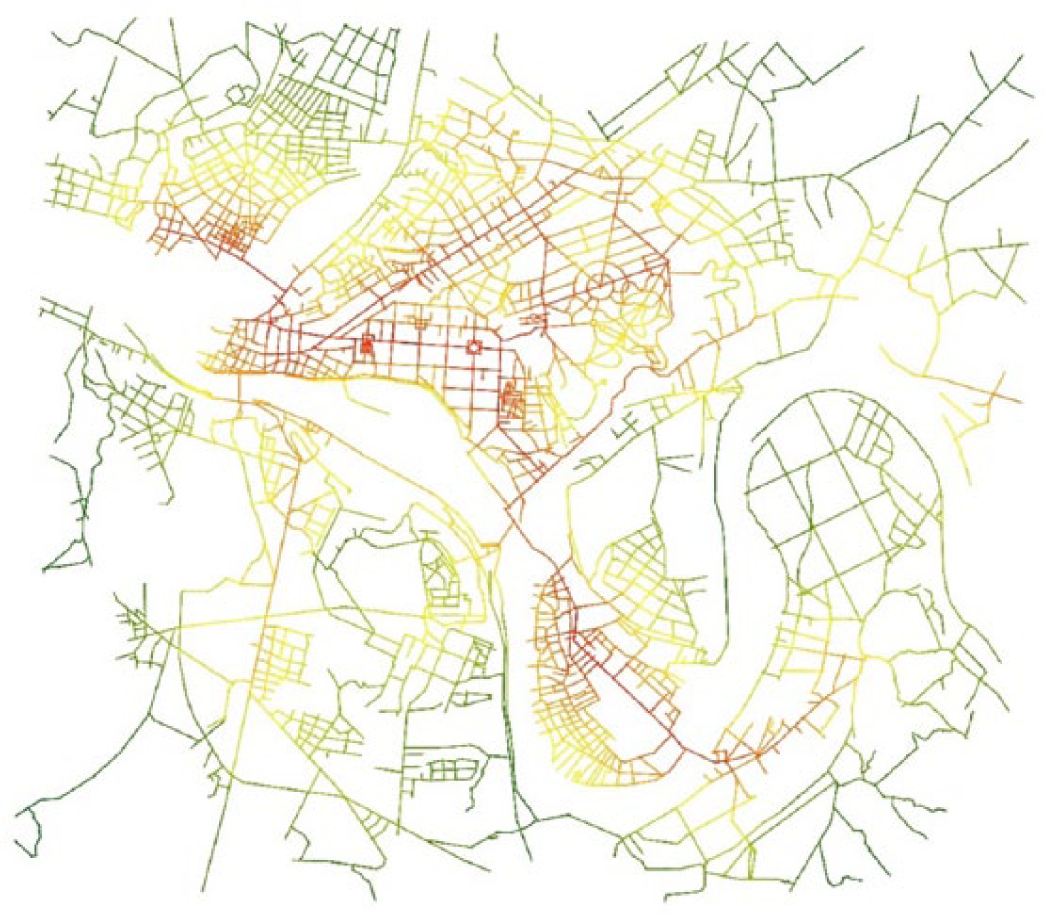
Farness/closeness centrality as a sum of custom measured distances from each node (street segment) to the rest of the nodes (Figure 3). It corresponds to the mean depth in Space Syntax analysis or is approximately converts to not normalized segment integration (Hillier and Iida, 2005). The essential difference here is the abovementioned calculation of distance in time instead of angles, steps, or meters. In essence, this indicator shows probable objectives of all journeys or the most reachable spaces in the terms of spatial configuration.
Few types of betweenness centrality or choice in Space Syntax analysis, which shows the most often chosen transit routes. For each node x, it is calculated as a sum of all shortest journeys in terms of distance from all y to all z and from all z to all y nodes within the selected radius.
Mean geodetic length centrality (Figure 4) as mathematically converse version of metric reach by Peponis, Allen, Haynie, Scoppa, and Zhang (2007). Metric reach is calculated as a sum of all reachable street length within a certain radius. According to Peponis et al. (2007), areas with the higher metric reach values could be seen as catalyzing zones for social interaction in public spaces. Mean geodetic length is calculated as a ration between the length of the precise street segment and the total length within certain radius so smaller numbers identify denser urban fabric and could be seen as the abovementioned socially catalyzing urban zones.
Two phase destination (Figure 5). It measures the proportion of origin weight received by each destination and is equal to x weight divided by total weight of all destinations y (sDNA Manual, 2018). As a weight the hypothetically reconstructed density of inhabitants in different areas of Kaunas in 1939 was chosen. The reconstruction was based on the number of land plots in the typical urban blocks in the known neighborhoods in Kaunas, approximate number of flats in a plot, and probable household size.
Mean custom depth within 4,000 m.

Mean geodetic length with radius 4,000 m.

Two-phase destination within radius 4,000 m.
All the abovementioned information was entered into GIS database. At this stage of the research to see more generalized picture, the results of content analysis were grouped into six larger groups according to the age groups of users and similar type of activities: all users doing all types of activities, adults practicing in sports or involved into another type of physical activities; adults involved in passive recreation, adults involved into socially oriented activities, children doing sports or playing active games, teenagers doing sports or playing active games (Figure 6). To neutralize the probable accidental information collected from photos, it was decided to weight the grouped data of content analysis by the hypothetically reconstructed density of inhabits as a factor, which definitely is related to the intensity of street culture.

Users and activities in public spaces: (a) all users doing all types of activities; (b) adults practicing in sports or involved into another type of physical activities; (c) adults involved in passive recreation; (d) adults involved into socially oriented activities; (e) children doing sports or playing active games; (f) teenagers doing sports or playing active games.
To see if the modeled spatial characteristics are related to the documented usage of public spaces in Kaunas in 1939, the correlation between calculated centralities and weighted content analysis results was performed. The following most important findings could be mentioned:
Negative moderate correlation with the mean custom depth within radius 4,000 m was found. It varies from −0.354 for socially oriented activities of adults and −0.433 for passive recreation. It looks logical within the general statement of various Space Syntax models stating that higher integration/lower mean depth “bring” more people and activities together.
Significant strong positive correlations were found between the activity/users groups and two-phase destination within radius of 4,000 m. It varies from 0.610 for teenagers doing sports to 0.718 for adults doing sports. It means that the street or another public space is not only larger in spatial terms, but also has a higher number of inhabitants in neighboring land plots and is reachable from smaller and less inhabited spaces.
Moderate negative correlation was found with mean geodetic length within radius of 4,000 m. It varies from −0.348 for social activities of adults to −0.533 with children playing active games. It looks logical from the perspective of the catalyzing of the social interaction concept by Peponis et al. (2007). The full results of the calculation are presented in Table 2.
Pearson Correlation Calculation Results.

It is visible that the abovementioned correlations prove the obvious dependencies, but they can help create more complex understanding of spatial–social interaction if used together. It might be logical to expect that the other calculated centralities could be related to the investigated social–spatial phenomena, for example, betweenness centrality; however, this was not confirmed during this research. It means that the results of calculations demonstrate, from the first sight, that the obvious relation between configuration of the network of urban spaces and theirs social–cultural content, in essence is not so straightforward and subtler. At the same time, it is possible to predict that different centralities will demonstrate different correlation in different spatial structures and different societies. It will be tested in the future research with focus on Kaunas in 1990 and 2016 as well in Vilnius and Klaipeda.
The question may be asked: if the created multimodal graph would be compared with one-layered graph while using traditional distance metrics, will the correlations be different? To get the answer, the correlations between the same activities and the same types of centralities in the graph with simple Euclidean distances within the same radius and without weighting were calculated. As we can see from Table 3, we have only significant positive and negative weak correlation with the similar types of centralities. The example of mean Euclidean depth could be seen in Figure 7.
Pearson Correlation in One-Layered Graph.


Mean Euclidean distance within radius 4,000 m.
Despite the limited amount of available data, it can be concluded that the multimodal graph model is working better if compared with traditional syntactic single-layered graph model and shows promising results and prognostic capabilities. Moderate and strong correlations encourage to look deeper into spatial–social interaction and the possible causes of these relations and demonstrate the potential of content analysis bringing additional important data into spatial analyses.
Conclusion
The analysis of application cases of content analysis in urban studies has revealed that despite the potential of this method, it is still rarely used in this field and its full potential is not employed. In the majority of analyzed examples, the content analysis was applied to texts and planning documents. However, the flexibility of the method and its potential of integration with other research techniques allow suggesting its wider and more creative use in urban studies for both the better understanding of the social dimension in urban research and its integration with spatial data.
The idea of the case study was to demonstrate the framework for creative integration of quantitative content analysis with sociospatial and spatial methods for complex urban research to deepen its social dimension. The study of modernization of Lithuanian cities during the Soviet period involving content analysis, sociotope method, GIS, Space Syntax, multimodal graph provided the context for methodology design. The overall scheme of the integration of the methods is presented in Figure 8.
In this study, the content analysis of historic images was integrated with sociospatial sociotope methodology at first through the development of coding categories and other classifications, which are shared between content analysis and sociotope analysis. Part of the coding categories (the typology of activities in public spaces or use values) were adapted for the sociotope methodology; meanwhile the typologies of public spaces and users from content analysis were used in developing and adapting to Kaunas context the sociotope methodology tools, such as questionnaires and checklists. The content analysis of historical images contributes to the selection of the most characteristic urban areas for sociotope mapping as well.
The content analysis method was used for the investigation of the accumulated visual material documenting the uses of public spaces in the past in the context of the study of modernization of Lithuanian cities. The coding categories—different types of users, the activities they are involved in, and the types of depicted public spaces—were identified in each image under analysis. For further integration of the methods GIS was used as a medium: The results of content analysis and sociotope surveys were mapped on the axial maps of Kaunas identifying the geographical location of the spaces identified in the images and attributing the specific users and activities identified in the content analysis to these specific locations in the city. The classifications of public spaces, users, and activities applied in the content analysis were maintained outlining the public spaces on the map. The GIS maps were further used looking for the correlations between the distribution of types of users and activities and the multimodal graph model developed in the frame of this research. The initial test of the correlation of results of quantitative content analysis and multimodal syntactic graph of the network of public spaces in Kaunas in 1939 confirms the rightness of the spatial determinism approach while looking for regularities of allocation of social activities in public spaces.

The scheme demonstrating the integration of content analysis with sociotope methodology and GIS in the wider frame of the study of modernization of Lithuanian cities during the Soviet period and its influence on contemporary urbanism.
Footnotes
Declaration of Conflicting Interests
The author(s) declared no potential conflicts of interest with respect to the research, authorship, and/or publication of this article.
Funding
The author(s) disclosed receipt of the following financial support for the research, authorship, and/or publication of this article: This research was funded by a grant (28 02 2017 No. S-MOD-17-16/SV3-0364) from the Research Council of Lithuania.