
Abstract
In Latin América there are large exporting companies intensive in natural resources which do not connect with the SMEs in the territories. The aim of this study is to provide elements that explain the limits to the productivity of small and medium enterprises located in bio-based territories, providing inputs for a public policy that enhances local development. The case of sawmills located in the Province of Arauco, Bío-Bío Region, Chile, is studied. The results of a survey applied to 42 companies are analyzed, in the context of an initiative financed by the Regional Government of Biobío, which represent 84% of the total sawmills in the Province of Arauco. Different data science algorithms are used to generate clusters and decision trees. Based on the results, a heterogeneity within the group of companies is verified from the perception of the main problems, the processes that are internalized, the number of sectors it sells to and the cost of raw materials. Public policies recommendations are presented aimed at building support networks, improving quality standards through certifications, attracting, and retaining qualified human capital and promoting collaborative design among companies.
Introduction
This paper analyzes the factors that explain the limitations to productivity in small and medium-sized enterprises (SMEs) in territories whose economies are based on renewable resources. The case study focuses on sawmills from the Province of Arauco in the Biobío region, Chile. The companies studied present a high level of vulnerability due to the fact that they produce standardized goods without added value, they have low bargaining power, and their technological obsolescence is high, presenting low contribution margin.
These companies are in relatively less developed territory without an urban center that pulls economic flows, making it difficult to sell to the domestic market. From the Community Development Index (ICHEM, 2020), three out of seven communes in the province of Arauco show a low level of development and four communes are in the middle range. It is remarkable that the commune of Arauco, where a large forestry company is located, is only in the middle range, evidencing the type of development that occurs around export chains with intensive use of natural resources. This work analyzes the case of SMEs in a territory where large export companies with intensive use of renewable natural resources are also located, in this case the forestry industry.
Our main objective is to determine which factors are limiting productivity in small and medium-sized sawmills in the province of Arauco by using data science algorithms. Identifying these factors is an input for shaping public policies in the territory in the context of strengthening of endogenous development (Gatica, 2020).
The combination of company types and territory is present in other Latin American countries and requires the development of a more active type of public policy to promote the environmentally sustainable territorial bioeconomy (Wohlfahrt et al., 2019).
When searching the Web of Science (WOS) for the keywords “SMEs,” “productivity,” and “data science,” 94 publications were found, out of which 10 were selected for our theoretical review (see Table 3) based on a criterion of relevance. When searching for “sawmills,” “SMEs,” and “productivity” only one publication is found, which deals with efficiency and clean production strategies in a sawmill.
This work begins by reviewing concepts such as productive exclusion, neoliberal State, technical change, and small and medium production. The disconnection among large companies and local SMEs is analyzed, which adds to the absence of public policies that allow linking different companies, resulting in an increase in productivity gaps, since there are different sizes and compatibility, affecting the adoption of new technologies, which ultimately makes it difficult to improve the profitability and sustainability of production processes in territorial SMEs. In the field study, the survey data from 42 companies that represent 84% of the total sawmills in the province of Arauco was considered (INFOR, 2019).
The methodology is based on works with algorithms used in data science to generate clusters and classifications from trees. For these purposes, the researchers worked with the free software Weka, accessing a library of algorithms that allow them to reach findings without the need of generating hypotheses that may condition the analysis.
The results obtained verify that the cost weight of raw material does not affect the productivity of the companies but jeopardizes the SMEs continuity of operation. A second conclusion is that the main type of problem declared by the company changes depending on the levels of productivity they have reached. The data presented in the theoretical framework is corroborated, in which the quality deficit, insufficient equipment, the absence of skilled human capital, and financial tightness are factors that limit the productivity of these companies.
Finally, this study proposes a public policy that not only seeks the installation of networks around SMEs to visualize business opportunities but the implementation of a quality certification plan, the generation of a mechanism to attract and retain qualified human capital and the development of collaborative designs among small sawmill companies.
Productive Exclusion, Neoliberal State, Technical Change, and SMEs
The research points to one of the “knots” of Chilean economic development, the concentration of natural resources and their exploitation. At least four factors that determine the current state of SMEs are displayed.
Productive exclusion: There is strong pressure on the demand for productive factors from the large exporting company intensive in the use of natural resources (e.g., copper, forestry, fishing, among others), which has a negative impact on local SMEs. This pressure is part of the so-called “Dutch disease,” Rehner and Vergara (2014), which is characterized by a series of negative externalities such as the increase in the price of raw materials, shortage of capital, pressure on skill labor, among others. All of these externalities limit the productivity improvement of local SMEs, which do not participate virtuously in global value chains (Coe et al., 2008), therefore, they are excluded from the circuits of accumulation favored by neoliberal growth models. These SMEs have a low production complexity, leading to a low diversity of products, a limited number of production processes involved and less variety of skills to produce locally (Hidalgo et al., 2009).
Neoliberal State: A State that has renounced public policies that actively intervene in the economy is added. In the Chilean case, there are macroeconomic policies that can be classified as successful, centered on controlling inflation and the rate of GDP growth. Unfortunately, in Chile, the neoliberal model has not developed policies that stimulate specific industrial sectors, discontinuing industrial policies as they are considered ideologically associated with the definition of a growth model based on import substitutions and State intervention (Falabella et al., 2014). A neoliberal slant currently prevails in public policies, which has prevented the State from assuming a more active role in the economy (Calderón et al., 2016). The emphasis of current economic policies in Chile is to preserve macroeconomic equilibrium, ignoring the meso-economic level as a space for building competitiveness (Arthur, 2013). Specifically, no initiatives that stimulate endogenous development with a synergistic and territorial logic are observed in Chile, where a compartmentalized sectoral approach is the one that currently prevails (Gatica, 2020). In this regard, a framework of policies that facilitate territorial industrial learning around new technologies is essential to be generated, being a fundamental element the role that the “Entrepreneurial State” (Mazzucato, 2017; Mazzucato et al., 2019) can play, which, to our mind, should operate in a decentralized way.
Technical change: Lastly, strong technical change is added, which might accelerate the gap amongst companies based on accumulated capacity. The Fourth Industrial Revolution may open a window of opportunities for industrial SMEs to improve their competitiveness, depending on their ability to absorb new technologies (Schwab, 2016) and it will be the same technological revolution which may permanently expel a group of SMEs from the market, having a severe impact on employment (Nedelkoska et al., 2018). Several studies have shown that the size of the company has proven to play a crucial role in adopting this type of technology due to the financial barriers and skills required, especially by technological compatibility requirements (Arnold et al., 2018; Reyes et al., 2016; Rogers, 1995). The adoption of digital technologies undoubtedly represents an opportunity and SMEs, with different motivations, may obtain great benefits from it. A recent comparative study by UN-ECLAC shows how manufacturing SMEs can reach higher stages of development and competitiveness by joining the digital world 4.0 (Maggi et al., 2020).
Limitations to productivity in SMEs: Among the factors underlying the low productivity of SMEs are the cost of raw materials, low quality products, the limited attraction of new clients, operational results, and difficult management of working capital (Schaefer et al., 2020). On the other hand, Calza et al. (2019) account for the deficit in the management practices of SMEs as a limitation. In most cases, the owners concentrate all the strategic tasks and there is clearly a bias in the operational issues. In this regard, Immawan et al. (2019) raise the importance of SMEs implementing a good performance measurement system to facilitate management. The author proposes to analyze productivity per worker, product quality, income per sale, market share, production costs, labor training, among other key factors. Furthermore, Forth et al. (2019) find that the incorporation of new management practices in SMEs, especially in human resources and operations, generates high profitability. However, there are barriers in the adoption of these practices which are explained by the high economies of scale and the weak networks that business managers have. In this respect, Ingaldi and Ulewicz (2019) determine that 80% of SMEs face shortages of skilled human resources. Meyer et al. (2018) find that the main constraints in SMEs’ growth are the shortage of skilled labor, insufficient business training and lack of opportunities to establish contacts that help to proactively detect opportunities. Finally, Rojas-Córdova et al. (2020) determine that in SMEs, the lack of own resources, the absence of technological information and the perception of a demand for products not very inclined to innovate are highly relevant.
These theoretical axes transversely cross our work and will be discussed in the light of the field study results. The dimensions associated with productivity per worker, productive complexity and cost structure from the respondent companies are presented below (see Table 1) providing context to the previous review of data that will be addressed in the next point. In this regard, De la Fuente et al. (2020) states that one way of working on productivity is by relating sales levels with the number of workers related to the production process, generating a distinction with the concept of technical efficiency.
Dimensions of Analysis.

Source. Compiled by authors.
These theoretical axes transversely cross our work and will be discussed in the light of the field study results.
The main variables are described below and subsequently, data clusters and classifications are generated using some data science algorithms.
Previous Data Review
The disconnection with large companies, the absence of public policies that assume a more active role and the spread of new technologies that require a certain size and compatibility deepen the productivity gaps and create an uncertain scenario for local SMEs, which makes it difficult to project a sustainable view of production in Arauco territory. In this regard, there is a need to develop productive systems in the territories that allow the sustainability of biomass (Wohlfahrt et al., 2019).
It should be noted that the territory where they are situated has a clear forest profile. However, it is an area that lags behind Chilean economic growth. Currently, its level of development can be classified from medium to low (ICHEM, 2020). Despite the fact that in the same territory, one of the world’s largest forest industries is located, the density and richness of local economic circuits are relatively low.
This work analyzes 42 companies classified as small sawmills situated in the province of Arauco and which do not belong to any large forest industry complex. This group has a low demand for products at a local level and, at the same time, they have a shortage of raw materials due to being neighbors of a large forestry complex.
Some characteristics of the analyzed company group are presented below.
61% of companies produce sawn timber which is the product with the lowest level of complexity. Furniture production is only present in 2% of the respondent companies. This low percentage is explained since these companies must access another type of wood, require a higher level of technology and demand to handle design elements, which implies having a deeper knowledge of customers. The other products identified present a low level of complexity and show the productive vulnerability in this type of company.
The companies under consideration present an average annual turnover (sales) of $238 million (US $290,000), which gives a monthly income of $19 million (US $22,891). In the study group, this variable shows the greatest dispersion, based on a coefficient of variation of 183%. This amount is low considering the productive nature and it demonstrates that these are SMEs which do not have room for maneuver to face the financial contingency.
On average, companies hire 12 workers, and the coefficient of variation is 122%. This reaffirms that we are dealing with small companies. If we consider that the monthly income is $19 million (US $22,891) and that 25% of these cover direct labor costs and bearing in mind that generally we have 12 workers per company, it allows us to infer that on an average basis the monthly income is $395,000 per direct worker, which is equivalent to about US $475 per month. This remuneration is below the average income of the employed population in the Biobío region which amounts to $431,460, equivalent to US $519 (INE Bio-Bío 2017).
In relation to size, two indicators are generated. The total area and the built surface area are considered, the latter being the factory, plant, or storage shed. On average, these small sawmills have a total area of 17,000 m2, which can be an industrial plant or a storage yard. The sheds are on average 1,655 m2. In general, 9.7% of the total land is covered. In the built surface area, the coefficient of variation is 175%, which shows dispersion in the sizes (Graph 1).

Percentage distribution of main products.
In the field of productivity, two global approaches are built. Regarding productivity per worker, we have an annual average of $22,368, which is equivalent to US $27,274, with a coefficient of variation of 121%. In the other dimension, we have the annual productivity ratio per built square meter of $530,356 (US $638) and the coefficient of variation is 170%.
In the productive complexity dimension, two indicators are considered. Each company sells its production to 2.2 sectors with a coefficient of variation of 76%. The companies have an average of six production processes within them, with a smaller dispersion (coefficient of variation of 43%).
In the cost structure it is observed that the highest percentage corresponds to raw material in which 36.6% of the total is explained by such an item. This percentage is relatively similar in the companies analyzed on the basis of the low coefficient of variation (27%). The second most important item is explained by direct labor, which accounts for 25.2% of the total cost. It is interesting to observe a greater dispersion of data (coefficient of variation of 41%). In a third level we have the energy costs that present an average of 16.9%, but it evidences a greater dispersion. Finally, we have “other costs” that on average explain 20.3% of the total and which is the aggregation of different fragmented items. Its coefficient of variation is 47%.
As a complement to this diagnosis, we present the main problems declared by each company analyzed, broadening the view around the explanatory factors of productivity. It is found that 31% of the surveyed companies state that their main concern is insufficient equipment, which demonstrates the technological gap of these territorial SMEs, impacting their commercial and production complexity, as well as the environmental sustainability of their processes. At a second level, 21% consider that the main problem is the limited access to financing, which also affects the investment capacity in different aspects of the company and explains the previously mentioned technological gap.
About 16% of companies declare the lack of staff training as the main problem, further limiting the ability of these SMEs to adapt to customer requirements and to adopt technology that allows them to improve productivity and sustainability. The quality deficit is in fourth position, which limits the possibility of accessing more complex and therefore more profitable clients.
On the other hand, a block of factors is identified, which are below 5% of the responses. In this group these factors are the lack of sales strategies, absenteeism problems, organizational problems, lack of design, and administrative problems (Table 2).
Key Indicators for the Study Group Under Examination.

Source. Compiled by the authors based on the surveys.
The coefficient of variation is equal to the standard deviation divided by the average.
At the time of writing the document, each North American dollar (US$) is worth $830 Chilean pesos.
In short, we are dealing with small companies based on their turnover levels, which explains a higher level of vulnerability, little reinvestment capacity, and labor income that are below the regional average. Dispersion in productivities found may serve as an explanatory variable in our classification analysis. In general, they are companies characterized by the low complexity of their productive and commercial activities due to the number of internalized processes and the low number of sectors it provides to. The most relevant cost is the raw material, which reaffirms the possibility of a “productive exclusion” developed previously: large companies push to raise the price of wood, generating a negative externality in the small sawmills operating in the territory (Graph 2).

Main problems distribution.
Thus far, our approach has been based on the average values and coefficients of variation around critical indicators. The present methodology takes a more complex look at the variables that explain the limits of the productivity of these SMEs. The key variables will be analyzed using data science techniques to explain the different levels of productivity from the identification of data clusters and classification trees.
Methodology
At this point, we begin by reviewing 10 case studies related to the object of study and mentioning aspects about the collection of information. In addition, methodological aspects of the attribute selection process, clustering and construction of decision trees are developed.
When reviewing Table 3, it is found that most of the studies use performance indicators, perform a quality analysis, present exploitative statistics, or use multivariate analysis. We highlight the study by Rojas-Córdova et al. (2020), who uses the C.4.5 classification algorithm, similar to the J48 that we will use in this study. Meanwhile, the study by De la Fuente et al. (2020) uses an algorithm that combines the Cronbach’s Alpha and the correlation matrix to select the variables. In this sense, our study uses a Best-First variable selection algorithm available in Weka.
Research Review Relevant to the Object of Study.

The fieldwork will apply various Data Mining algorithms (Han, 2006) seeking to deepen the new relations that may arise from the analysis. Therefore, a hypothesis is not formulated to approve or reject the relationship among variables, but the results are derived from an exploratory analysis in order to generate new lines of work.
These techniques have a wide field of application. The algorithm selection depends on the type of problem and the data set (Vabalas et al., 2019). For this work, those algorithms reported in the literature that have been shown to be efficient and easy to implement are selected.
For these purposes, WEKA 3.8.3, Waikato Environment for Knowledge Analysis software is used, developed by the University of Waikato (New Zealand), freely available on the internet, under GNU-GPL license, and which has a wide range of algorithms that allow it to generate learning.
In this regard, the following preliminary steps were developed.
In the pre-process, it was decided to discretize the different analysis dimensions from the application of an unsupervised filter on the numerical attributes. In all cases, four ranges or bins were distinguished.
The analyzes seek to explain the productivity per employee understood as = Annual turnover/number of direct employees.
The following productivity grades are identified: very high, high, low, and very low.
The productivity ranges are distributed in a relatively homogeneous way, weighing between 28% and 38% of the cases. Working with productivity ranges corrects the size of each company and allows having a comparable indicator between different units. It should be noted that companies within the group studied are being analyzed and not on frontier performance.
The variables were selected using the Best-First method, in which the attribute to evaluate is labor productivity. The variables analyzed are summarized in the following table
The results of the survey taken from 42 sawmill companies in the province of Arauco are featured below. This information gathering process is done in the context of the Productive Development Committee (CORFO-Regional Government of Biobío). All logging SMEs in the area registered as such by public agencies were consulted. This list was supplemented with the records of the Arauco Wood Industry Association. Based on the forestry yearbook, a total of 50 sawmills are identified in the province of Arauco, therefore, our study successfully surveyed 84% of the total.
Additionally, the surveyed companies represent 21.1% of the total manufacturing SMEs in the province of Arauco, marketing year 2019, based on the analysis of the information available in the Internal Revenue Service records. (https://www.sii.cl/sobre_el_sii/estadisticas_de_empresas.html).
The surveys were applied to the SME’s owner or manager by a professional expert in the wood industry. The data were tabulated in an Excel spreadsheet. Subsequently, they were ordered and taken to a CSV format that is read by Weka, converting them into an ARFF format. No data is lost in this format conversion process (Graph 3; Table 4).

Distribution of productivity per employee.
Reduction of Analyzed Variables Using the Best-First Algorithm on Weka.

Source. Compiled by the authors based on Weka results.
From the selected variables, two types of analysis were conducted using the data from the 42 firms surveyed: clusters and classification. A brief methodological explanation is featured below for each case.
Clusters
In machine learning, several algorithms have been proposed. In this study, these proposals are used by the authors and tested in many applications.
First, K-means algorithm was selected. It allows grouping from similar but different traits from the others that integrate other groups (Lara et al., 2016). K-means is used in many applications and works good with either big or small data sets. It is efficient and easy to implement.
The algorithm used by Weka consists of the following steps (Sharma et al., 2012):
K points are in space representing the objects to be grouped. These points represent the centroids of the initial group.
Each object is assigned to the group that has the closest centroid.
The positions of K centroids are recalculated.
Steps 2 and 3 are repeated until the centroids do not move.
This produces a separation of the objects into groups.
Various iterations were generated, and the results are synthesized in Table 5. The attributes considered were cost percentage of raw material, number of sectors, number of internalized processes, the main problem and productivity range.
Number of Analyzed Clusters.

Source. Compiled by the authors based on Weka results.
Based on these results, it is estimated that the identification of four clusters allows achieving a lower error between them (71.0) and in parallel having groups that show a relatively homogeneous distribution among themselves (subgroups of 14, 10, 7, and 11). Using this last homogeneity criterion, the generation of five clusters is excluded, since incorporating an additional subgroup does not significantly reduce the error between the subgroups
Classification
Two supplemented algorithms were applied.
A tree classifier was used, specifically Weka’s J48 algorithm. The analysis allows to have a pruned tree that facilitates the interpretation of results.
A Bayesian network (Bayes Net) was built using the k2 algorithm. The results and the corresponding graphs were generated. Bayes Net can consider multiple variables to classify predictors and assume that they occur independently of each other (but they are not always correct). The conditional probabilities of Bayes’ theorem are the basis of this approach.
The following are presented for each model: the hit rate, the statistical Kappa, and the mean absolute error (Table 6).
Adjustment Results of Each Classification Method.

Source. Compiled by the authors based on results.
Depending on the rate of correctly classified instances, the J48 method and the Bayes Net present a similar level of success (71.42%). However, the J48 algorithm showed an average error below the Bayes Net. There is no database to train the algorithm from an artificial neural network (ANN), limiting the application of this methodology (González-Ruiz et al., 2015).
The aim of our study is not to generate a model to make decisions, but to address the productivity of small and medium sawmills. This research does not contemplate the gathering of new information in the future or in another territory that allows to generate new learning processes from the training of an artificial neural network. Therefore, providing explanatory information, we will work with the results from the J48 algorithm due to its ease of interpretation.
The application of the J48 algorithm which would indicate the existence of a good agreement between the analyzed attributes. For adjustment quality purposes, the Confusion Matrix (Table 7) is presented, whose diagonals that represent the correctly predicted instances are, in all cases, above the other numbers in each column and/or row. Therefore, the classification made by the tree makes it possible to discriminate the correctly predicted cases for each productivity range.
Confusion Matrix.

Source. Compiled by the authors based on Weka software results.
Results
The cluster and classification analysis results are presented on the data of 42 surveyed companies, which is equivalent to 84% of sawmills located in the province of Arauco (INFOR, 2019).
Statistical Cluster Analysis
It must be noted that this grouping is not based on any particular attribute, but rather arises from the application of an algorithm that groups companies together seeking greater proximity within the group itself and greater distance among groups (Hair et al., 1999). As mentioned above, four clusters were identified, which were presented in Table 5.
The main features of the total data are presented (first column). In general, the group of companies analyzed has the following characteristics: they satisfy the needs of less than 2.2 economic sectors, the productivity per employee is very low, the number of internalized processes is 5.5 to 7.7 per company, the main problem is insufficient equipment and finally, the cost of raw material is below 32.5% of the total cost (Table 8).
Presentation of Cluster Centroids.

Source. Compiled by the authors based on Results.
Four groups are identified.
- Cluster 1: It includes 14 companies (33.3%). The main feature of this group is the “low productivity” range. The main problem is difficult access to financing. The number of internalized processes is 3.2 to 5.5. The other attributes are similar to those of the other groups; therefore, they do not offer differentiating features.
- Cluster 2: It contains 10 companies (23.8). This group has a “very high productivity.” The cost of raw material ranges from 32.5% to 45% and its main problem is the lack of staff training. The other attributes are similar to the whole group.
- Cluster 3: It comprises seven companies which are mainly characterized by having a “very low productivity” (16.6%). This group has companies with more than 7.7 internalized processes and insufficient equipment is regarded as the main problem. The cost of raw materials ranges from 32.5% to 45%.
- Cluster 4: It encompasses a number of 11 companies that show a “high productivity,” which represents 26.1%. Regarding the number of internalized processes, they range between 5.5 and 7.7. The main problem is insufficient equipment, and the cost of raw material is below 32.5%.
In the cluster analysis, which is not supervised, the productivity range clearly appears as a discriminating attribute among the subgroups.
On the other hand, the attribute “cost percentage to pay for raw material” does not have a destabilizing effect in the definition of productivity per worker. Although high (45%−57%) and very high (>57%) ranges in the cost percentages are seen, it is unclear whether it is destabilizing or not. The proof is in the fact that both the “very high productivity” and “very low productivity” clusters have the same raw material cost range (32.5%−45%).
The foregoing rejects the first impression of an increasing cost of raw materials, as a result of the pressure on the production factors that Large Production Complexes can exert. Despite the fact that this goes beyond the limits of the investigation, there is the possibility that the pressure on the raw material, exerted by large conglomerates does not mean an increase in the input costs for smaller companies, but affects the continuity of operations due to shortage of the main input. The demand for wood from these small companies does not constitute a purchasing power for the large forestry companies and also owners of the land, therefore, they do not influence on the determination of the sales price. On the other side, the raw material cost can have an impact on the company net profits (difference between income and total costs) and not to affect the income per sale, used as an input to calculate the productivity ratio per worker. The information available does not allow estimation of the company final profit.
Another result is that “very high productivity” companies see the need for a more skilled workforce as a problem. By having a high level of productivity, the incorporation of personnel into the production process must comply with a similar production standard. This difficulty also has an implication in the local labor market where high productivity companies do not find a supply of qualified labor in the territory of Arauco, which, as we mentioned before, is of medium-low development (ICHEM, 2020), which also makes it difficult to retain skilled labor in this area.
Lastly, the coverage of economic sectors to which it sells does not significantly condition the productivity range. In all subgroups, companies satisfy the needs of less than 2.2 economic sectors. In this regard, there are two explanations: targeting a few sectors does not translate into higher sales income and at the same time, high-productivity sectors do not have incentives to expand their commercial coverage. This result is consistent with the distribution of products sold by this sector, where 61% of the companies surveyed mainly offer sawn timber, which is a product with low added value.
Although the analysis makes it possible to distinguish subgroups of companies with a certain homogeneity, the identification of these conglomerates turns out to be still too broad, without clearly showing the relationship among different attributes with each productivity range. Hence, a decision tree explaining the relationship between the attributes and the different productivity ranges is presented in a hierarchical way.
Classification
It is found that there are minor differences by company range among the four clusters identified in the previous point and those observed in the classification analysis based on the confusion matrix (see Table 7). This difference is associated with the fact that the K-Mean conglomeration is made from the approximation of a set of variables, in which the productivity range is just one more parameter, assuming an error that has already been optimized in the different clusters (see Table 5).
From the confusion matrix (see Table 7) it is confirmed that:
In the case of “very high productivity” there are 9 cases correctly classified out of a total of 11 observations, therefore, the J48 algorithm success rate was 81.8%.
In the case of “very low productivity” there are 9 correctly predicted cases out of a total of 12 instances, which shows a success rate of 75.0%.
For the “low productivity” category, there are 7 correctly predicted cases out of a total of 10 instances, therefore the hit rate was 70%.
In the “high productivity” category there are only 5 correctly predicted cases out of a total of 9 instances, representing a success rate of 55%, the lowest of all the categories analyzed. In this case, the algorithm presents a regular result, evidencing the complexity of generating predictive models in intermediate areas where it is more difficult to discriminate among instances. Despite the above, the successful cases exceed the instances incorrectly classified for this range.
The pruned tree is presented in Figure 1. Those branches that have a greater explanatory power regarding productivity gaps and that are capable of explaining at least three instances will be analyzed.
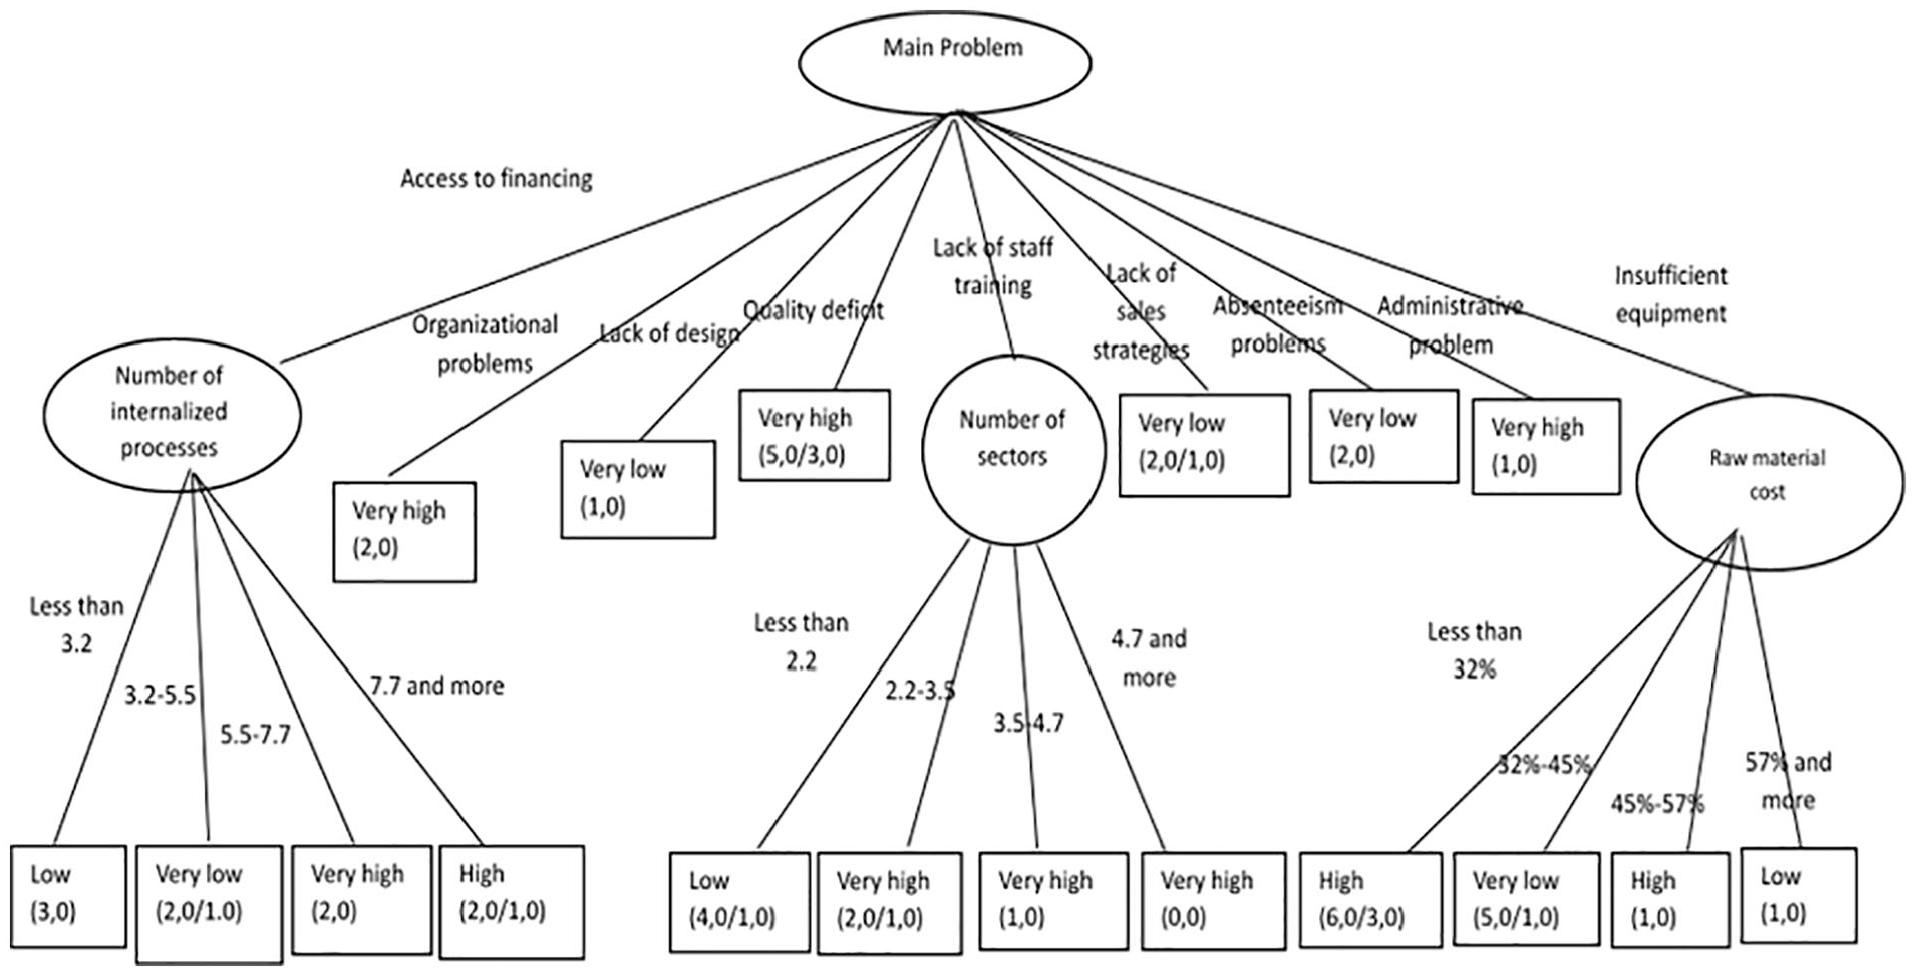
Pruning decision tree based on J48 algorithm.
The following results emerge from the decision tree:
(a) The “main problem” attribute is the one with the greatest explanatory capacity, above the number of internalized processes, number of sectors and cost of raw materials. The algorithm, when classifying by “main problem,” improves its prediction capacity but increases the branches horizontally (see Figure 1), making the analysis more complex. Hence, a first conclusion is that the instruments of productive development must be differentiated, responding better to each problem within the group of small sawmills in the province of Arauco.
(b) It is noteworthy that the answer “Deficit in quality” explains five companies that have a “very high productivity,” representing 45% of this section, with a limited predictive capacity in which there are three out of five classified companies whose algorithm is imprecise. In this case, the companies that reach a certain level of productivity see the quality of their products as a limitation to achieve greater competitiveness. Quality gaps become a “bottleneck” when a certain level of business development is reached.
(c) When the main problem is “access to finance,” the J48 algorithm associates it with the “number of internalized processes” attribute in order to achieve a better classification. In this branch there are 9 out of 24 cases, which represents 21%. In this regard, it is observed that companies with few internalized processes (less than 3.2) and problems of access to financing present low levels of productivity, which efficiently explains 30% of the total instances in this section. It is probable that the company size, added to technological delay, prevents access to financing so as to invest in new innovation processes, generating a negative reinforcement circuit, which increases these companies’ vulnerability.
(d) When the main problem is the “lack of staff training” the algorithm associates it with the number of sectors to which the company sells. In this case, eight companies are classified, which represents 19% of the total. When training is lacking and additionally the company meets the needs of few productive sectors, less than 2.2, there is a low productivity per worker. It is observed that out of four classified companies, in just one the J48 algorithm presented an imprecise result. Finally, this branch accounts for the vulnerability of this type of companies: small units, with low-skilled labor that are trapped in few sectors.
(e) When the main problem is “insufficient equipment” the algorithm associates it with the cost of raw materials. This link explains 13 cases on a base of 42 companies representing 30.9% of the total. When the equipment is insufficient and the cost of raw materials is below 32%, productivity per worker tends to be high. The above is explained in six cases, which means 66.6% of that section. However, the algorithm presents precision problems in half of the classified cases. Companies with a smaller gap and very high productivity value being able to have new equipment to take a technological step forward.
(f) When the company has “insufficient equipment” and increases the cost of raw materials, in the range of 32% to 45%, the existence of five cases with very low productivity is verified. This represents 55% of the total cases in this section, presenting a good level of precision. Fundamentally, companies that are trapped by raw material costs and have an old technology present low productivity per worker.
Owing to the large number of branches that the generated tree has (Figure 1), when linking them to the different types of problems, the strongest combinations only explain a part of the cases, leaving out those combinations of attributes that are of little significance and do not contribute to the analysis. It must be noted that we are working on a selection of variables generated by the Best-Fire algorithm (see Table 4), leaving only those parameters that can better explain the productivity ranges.
Discussion
The cost of raw materials, by itself, does not affect the worker productivity level, which is rather inconsistent with the explanation that a limitation to the competitiveness of SMEs is a consequence of the high wood prices produced by operating in the same territory with large forestry complexes. This result contradicts what Schaefer et al. (2020) indicates regarding the strategic cost of raw material. Accordingly, for these sawmills the lack of wood does not translate into higher prices for the input, but rather, given the absence of an efficient and equitable market mechanism, the continuity of operations for SMEs is jeopardized.
The foregoing is the result of the development of large forestry complexes which are also the forest owners. They show high vertical integration and generate an aggressive land purchasing process from small forest producers (Falabella et al., 2014, Gatica, 2012, Donoso et al., 2005). Ensuring access to quality raw materials in the long term is essential for the viability and value addition to these small sawmills in Arauco.
On the other hand, the perception of problems is linked to productivity ranges. In the higher levels of productivity, product quality deficiency, insufficient equipment when the cost of raw materials is low or the lack of trained staff when more than 2.2 sectors are needed to be covered, begin to be considered problems. These results reinforce what is indicated by Calza et al. (2019) who states that the product quality certification can help to facilitate the insertion in the SMEs markets. It is also consistent with that indicated by Forth et al. (2019), Meyer et al. (2018), and Ingaldi et al. (2019), who argue that having qualified human resources could significantly increase productivity, improving the adoption of new technologies.
In the opposite sense, when productivity ranges are low, access to financing becomes important, especially when there are less than 5.5 processes. This result is in line with what was expressed by Hietala et al. (2019) who highlights that the limited financial resources is a barrier to seeking new markets, making it difficult to improve income.
The main problems change depending on the levels of productivity. The above information is crucial when guiding public policies, especially when support tools should be better targeted, increasing institutional complexity in order to stimulate the endogenous development of this territory.
The analysis of clusters and decision trees made it possible to sensitize the main problems, based on productivity ranges, constituting a contribution of our research.
The study finds that 61% of the companies only produce sawn timber, 11% can produce processed wood and only 2% of the companies can produce furniture. Therefore, there is an important opportunity to add value to local production with products that contain a higher-level design. In our view, the implementation of new designs, despite being little seen by companies, would allow to generate new linkages, improvements in productivity per worker and facilitate the levels of associations among companies of a similar size (Ramos et al., 2019). The possibility of generating collaboration among companies would allow to reach an operation size that ensures a level of efficiency in the various innovation processes, coinciding with that indicated by Hojnik et al. (2017).
These figures show that the number of economic sectors it sells to does not explain a particular productivity range. This result complements that indicated by Immawan et al. (2019) who had defined market segmentation as a key indicator.
In our opinion, the analyzed companies are “caught in the middle” from a strategic point of view: having a sales focus does not translate into higher revenues and, at the same time, greater commercial diversification does not improve sales volumes either. This situation is explained by the low added value of its products, mainly sawn wood. Based on customer-supplier relationships, a gap in design and innovation remains.
Conclusions
The findings of the study are summarized in three main points: managerial implications and public policies based on the results, comments regarding the methodology and the post-COVID 19 scenario.
Implications for Management and Public Policies
The results of our work confirm the need to work on different axes:
It is essential to have public policies that allow building networks around the forestry SME entrepreneur to open and take advantage of new business opportunities. In this regard, Hietala et al. (2019), in the case of small Finnish sawmills, sees the importance of having institutional networks that allow opening new international business opportunities in the forestry sector. Sawmill companies in general are low-margin, high-volume businesses in which competitiveness is centered at the beginning of the chain and does not have a customer-oriented focus. For this reason, personal networks must be built, horizontal between companies, vertical with buyers and suppliers, and institutional with business associations, the government, technological institutes, and universities.
It is suggested to implement a quality standards certification plan for small sawmills. In this sense, Calza et al. (2019) suggests that the certification that SMEs can achieve (e.g., ISO 9001 and ISO 14001) allows interaction with demanding markets and can improve their profitability. In the context of public policies, mechanisms must be created so that research centers help SMEs to improve the standardization and quality of their products.
It is paramount to generate incentives to attract and retain qualified human capital in the territories. The foregoing is in line with what was stated by Meyer et al. (2018) and Ingaldi et al. (2019) and is especially valid in non-central regions, as is the case of Arauco. This challenge clearly involves the educational system in the territory.
An opportunity to be developed by these SMEs, intensive in natural resources, is to promote innovation processes focused on collaboration among companies. In this regard, Hojnik et al. (2017) determines the importance of size to increase efficiency in innovative processes. An alternative is to have collaborative designs among a group of sawmill SMEs (Ramos et al., 2019).
However, for the Chilean case there are no long-term sectoral public policies to stimulate improvements of the wood productivity levels in SMEs in specific territories. Industrial public policies are currently being reviewed in the New Chilean Constitution context (process started at 2021). Our work contributes to the new policies discussion within the framework of the reformulation of the role of the Chilean State in the economy.
Regarding Methodology
With respect to the methodology, the data science algorithms used: (Best-First) Variable selection, (K means) Clustering, and (J48) Classification work better with large volumes of information. In this case, a sample of 42 companies participated in the study, which may condition the generation of new results with these new technologies, for instance, neural networks algorithms. It must be noted that the number of examined companies is associated with the number of sawmills situated in the province of Arauco, reaching a coverage of 84% of companies from this territory (INFOR, 2019). Thus, increasing the number of surveys would imply a change in the territorial scale of work, which is beyond our investigation.
Notwithstanding the above, it is claimed that the data science tools applied to meso-economic studies will allow the identification of new regular patterns that determine the productivity of small companies, facilitating the implementation of complex and differentiated public policies that foster the endogenous development in the territories.
The employee productivity ratio, used for attribute selection and decision tree construction, does not completely include more complex elements associated with company competitiveness, for example:
It may be the case that the company is experiencing an innovation process at the time of the survey implementation, affecting the employee productivity ratio momentarily.
The productivity ratio was not worked on a temporal dimension for each company; therefore, it does not capture improvements or decreases in productivity levels.
The survey applied does not consider all the linkages that may exist between small sawmills and the large forestry company, and which are beyond the purchase of raw materials (labor flow, transfer of new technologies, among others).
These limitations may be tackled in a forthcoming study, and they constitute an investigation line that deepens the flexible organization of production in bio-based territories of low-medium development, and which are situated in the same area of a large export production complex in the context of the endogenous development model.
Regarding the COVID-19 Scenario
Our research does not capture the impact of sanitary measures derived from COVID-19 in sawmills. In this regard, García-Contreras et al. (2021) establish that in the Chilean case, SMEs focused on financial capacity and maintenance of operations to survive. The forestry sector quickly incorporated health regulations. Despite not having information from the province of Arauco, according to INFOR records (2021) in the Bio-Bio Region there were 84 permanent sawmills operating in 2020, while in 2019 there were 86 companies operating in the same region. With this data it is possible to anticipate that in this productive sector the impact of sanitary restrictions has not been so pronounced. However, the final effect of the pandemics must be analyzed in the medium term to be able to identify the change in the productive fabric, which is beyond the limits of this research.
Footnotes
Acknowledgements
To the Arauco Wood Industry Association for its collaboration and participation, to CorpArauco as a strategic partner of the joint project with the University of Bío-Bío and to Biobío-CORFO, Productive Development Committee for sponsorship and support.
Author Contributions
FGN and MRM Conceptualization; MRM information gathering: FGN and MRM Information Analysis; Drafting of the FGN and MRM report.
Declaration of Conflicting Interests
The author(s) declared the following potential conflicts of interest with respect to the research, authorship, and/or publication of this article: Authors are required to include a statement at the end of their article to declare whether or not they have any competing financial, professional, or personal interests from other parties.
Funding
The author(s) disclosed receipt of the following financial support for the research, authorship, and/or publication of this article: This work is framed in the Innovation Project UBB INN I + D 21-39. “Development of a Tool for Production Planning in Small and Medium-sized Sawmills.” It has the support of the Action Agreement of the Faculty of Business Sciences of the UBB.