
Abstract
Presenting oneself visually is an essential part of online behaviors on social networking sites (SNSs), and this is also the case for organizational accounts. Examining organizational self-presentation on their SNS accounts can show the key instruments through which organizations communicate online with the public. Thus, taking startups’ Instagram accounts as examples, this study aims to explore what and how organizations present visually on the photos uploaded to their Instagram accounts. The photos were analyzed in terms of their content, texts in photos, and facial and pixel-level characteristics. Photos and accounts were clustered respectively and resulting clusters were compared as well. The results suggest that text and people are the major objects represented in startups’ Instagram photos. The text presented in the photos was mainly about startups’ efforts to realize social values that can benefit communities by aiding people to do something in a timely manner. Two photo clusters were found: one mainly represented people and people-related words and the other mainly presented texts. Two account clusters were also found: one mainly consists of IT companies that presented texts in their photos and the other mainly consists of human-related services that presented people in their photos. This study can contribute to the body of literature by identifying the visual characteristics of organizational SNS photos and expanding self-presentation research to organizational SNS accounts.
Accounts on social networking sites (SNSs) can be an outlet through which organizations present themselves, as individuals do. Organizational and individual SNS accounts are similar in terms of their online functions: they upload posts, become friends or followers of other accounts, and respond to others’ posts by liking, retweeting, or making comments. Among these functions, uploading posts is the most fundamental online activity, and posts uploaded to an account are the conduit through which account owners present themselves in terms of their opinions, thoughts, emotions, or actions. This self-presentation is a process by which individuals’ identities are formed and their relationships with others are built and maintained in an online space (Djafarova & Trofimenko, 2019), and this is also the case for organizational accounts.
Self-presentation is essentially goal-driven (Smith & Sanderson, 2015): individuals consider what to disclose about themselves and how to do so to both meet the expectations of others and make others perceive them in desired ways. This aspect can be particularly meaningful for organizational SNS accounts. Organizations have more direct and measurable goals than individuals, and they may want their online self-presentation to contribute to achieving those goals. In this respect, what organizations present on their SNS accounts can influence not only the public’s perception of the organization (Pakura & Rudeloff, 2023) but also their success in a diverse sense (Jung & Jeong, 2020; Park & Loo, 2022).
Thus, the literature has analyzed organizations’ SNS posts and investigated what is presented in them and how it is represented. Many studies, however, have analyzed SNS posts in textual form, and it remains relatively unexplored what and how organizational SNS accounts present (or represent) in visual form. While text is still the dominant form of SNS posts, it is also true that the number and impact of visual posts are rapidly increasing. Existing SNSs, such as Twitter and Facebook, are now providing functions for uploading photos and videos, and SNSs focused on visual posts, such as Instagram and YouTube, have grown significantly. Interpreting visuals is an innate ability, unlike reading and writing which are the skills to be learned after birth, and visuals can be more straightforward in expressing and understanding of one’s status. Thus, visuals can be another channel through which SNS accounts can present themselves. Further, visuals can be examined at the pixel level, as well as the content level, where information can be transmitted and meaning can be created. When investigating visual representations, both levels should be considered.
Meanwhile, this study pays attention to startups, which are generally defined as new and small-sized enterprises that encourage novel ideas and seek business opportunities based on innovative technologies (Cockayne, 2019). Because startups usually lack enough financial and human resources to execute advertisements or perform PR campaigns on a large scale, they can utilize SNSs as an alternative. SNSs can enable startups to engage with a wide range of stakeholders including investors, collaborators, customers, and employees (Mujahid & Mubarik, 2021). Thus, SNS are reportedly crucial for the success and even survival of startups (Banerji & Reimer, 2019; Gloor et al., 2020). The research focus, however, has been placed more on the SNS accounts of founders or CEOs of startups (Sindhani et al., 2019; Yue et al., 2019) than on organizational accounts, and there has been scant research on the characteristics of posts on startups’ SNS accounts.
Considering the above points, this study aims to explore what and how startups present visually on the photos uploaded to their accounts on Instagram, a photo-centric SNS. To this aim, we performed computational analyses based on an unsupervised learning method. We transformed the photos into vectors via a pretrained deep neural network (DNN) and clustered the photos and the accounts using the vectors. We then compared the clusters using computational features to identify their visual characteristics.
This study may contribute to the existing literature in the following ways. First, it extends the application of self-presentation theory to organizational SNS accounts. Second, this study reveals the key elements of the visual representations in startups’ Instagram photos and improves understanding of how organizations convey their activities visually in SNSs. Third, this study can suggest a model regarding how unsupervised learning methods can be used for photo analysis combining DNN-based and manually-extracted computational features. Fourth, this study can provide a way to examine organizations’ visual communications online and quantitatively compare them among organizations.
The remainder of this paper is structured as follows. First, we review previous studies on startups’ SNS posts, visual self-presentation, and the use of clustering methods for examining visual representations. Additionally, we describe how we selected the research sample, how we performed the clustering, and which photo features we used to compare clusters. Finally, we present the findings of the analyses and discuss the implications and limitations of this research along with suggestions for future research topics.
Related Works
Analyzing Startups’ SNS Posts
Previous studies that have analyzed startups’ SNS posts have mainly aimed to identify posts’ topics or communication strategies. For example, Singh et al. (2019) examined tweets from startup founders and revealed that their key topics included digital technologies, e-commerce platforms, and consumer experiences. Sindhani et al. (2019) investigated startup CEOs’ tweets and identified their significant themes: business situations, personal emotions, and societal issues. Peixoto et al. (2023) analyzed tweets of Portuguese IT startups and identified five topics including FinTech, product/service R&D, and funding. In terms of communication strategies, Yue et al. (2019) analyzed startup CEOs’ tweets and showed that the dialogic principle was limitedly established in their Twitter communication. Chen et al. (2017) also analyzed the content of startups’ SNS posts on Weibo and WeChat and identified thought leadership building, co-branding, and influencer endorsement as their social media engagement strategies. Saura et al. (2019) analyzed tweets with startup-related hashtags and found their themes included business plans and relationship with investors.
Other studies have investigated the relationship between startups’ SNS use and their performance in various aspects. Jung and Jeong (2020) reported that the activity level, measured by the number of tweets, retweets, and likes, of startups’ Twitter use was significantly related to engagement from other users. Wang et al. (2017) demonstrated significant associations between the informativity, persuasiveness, and transformity of startup founders’ tweets and their level of engagement. Rudeloff et al. (2022) showed that two-way communication strategy was essential for engagement from SNS users. Additionally, business performance was found to be related to startups’ SNS use. Studies have reported that startups’ funding outcomes are significantly related to their active uses of Facebook (Yang & Berger, 2017), Twitter (Park & Loo, 2022), and LinkedIn (Banerji & Reimer, 2019). Further, startups’ active use of SNS can be a predictor of the company’s survival: the number of likes received on Twitter stood out as the most significant digital trace that predicted the survival of a company after 5 years (Antretter et al., 2018). And the innovation outcome (Corral de Zubielqui & Jones, 2020) and crowdfunding success (Sahaym et al., 2021) of startups were found to be related to their SNS use.
However, visual posts on startups’ SNS accounts have not been actively analyzed. A photo can convey far more information than a word. Not only that, since words can be displayed more diversely in terms of size, color, fonts, and location in photos, the words in photos can more easily draw viewers’ attention than those in normally printed forms. While visual posts on SNSs can be significant for startups’ public communication, limited research has been conducted on their attributes. This study tries to fill this gap by investigating what and how startups present visually in their Instagram photos.
Visual Self-(Re)presentation
Goffman (1959) considered self-presentation similar to actors performing roles: they select which information about themselves to disclose. To behave appropriately or expectedly in the context of conventions and norms, individuals select the information strategically (Carpenter et al., 2017). The strategy encompasses suppressing specific personal information and substituting it with other information that is consistent with one’s desired image of oneself (Hong et al., 2020). In this regard, self-presentation can be inherently linked to self-‘re’presentation: information about oneself is filtered, processed, and even manipulated in order to achieve personal goals in social relationships. Online SNSs can be an ideal environment for this self-representation (Bullingham & Vasconcelos, 2013). Photos can be particularly relevant for it: for example, it is widely observed among SNS users that profile photos (Zhao & Jiang, 2011) and selfies (Hong et al., 2020) are edited to present their best appearances.
The literature has examined visual self-presentation by various kinds of SNS users. First, laypersons have been investigated in terms of their visual self-presentation in profile photos (Kapidzic & Herring, 2015; Tifferet & Vilnai-Yavetz, 2018) and selfies (Hong et al., 2020), and celebrities’ presentations of their private lives have been examined (Klostermann et al., 2023). In addition, sports players and politicians have been investigated. For example, Sadeghi and Leng (2021) analyzed the content of Iranian football players’ Instagram photos during the 2018 World Cup and identified their key themes, which were athlete, family, personal, and publicity. Geurin-Eagleman and Burch (2016) investigated self-presentation strategies in Olympic athletes’ Instagram photos: the photos were personal in nature, reflecting the backstage performance strategies suggested by Goffman (1959). Li et al. (2021) analyzed female athletes’ Instagram photos and demonstrated that Instagram feeds and stories were used for different communication purposes.
For politicians, Brands et al. (2021) compared the content of male and female politicians’ Instagram photos and revealed that female politicians’ photos that show themselves receive more likes than male politicians. Mendonça and Caetano (2021) analyzed the Instagram photos of Jair Bolsonaro, the Brazilian President, and identified eccentricity and unsophistication as the main way of his visual self-presentation. Steffan (2020) examined the visual self-presentation of political candidates in Western countries and concluded that candidates prefer the ideal candidate frame to the populist campaigner frame. Additionally, the literature has investigated the visual representation of “sharenting,” or the sharing of one’s parenting and children online (Holiday et al., 2022), and the difference in the visual representations on SNSs between employed and freelance journalists (Carpenter et al., 2017).
This investigation of visual self-presentation, however, has been applied only limitedly to organizational SNS accounts. To name rare exceptions, Ferguson and Greer (2018) examined the visual portrayals of commercial radio stations in their Instagram photos and identified the dominant themes, station promotion and community, which were visually represented through various objects including station staff, advertisers or community events, and listeners. Dhanesh et al. (2022) analyzed the visual meaning of airport brands’ Instagram photos in terms of representational, interactive, and compositional aspects and found that photos with narrative, long shot, and low point-of-view generated more engagement. The results in above studies suggest that the visual representations in organizational Instagram accounts can be investigated by the content of the photos and major objects in the photos. The photos can contain people who are performing particular activities or expressing particular emotions, or they can present texts which may state their events, activities, goals, or achievements. These elements can be the major outlet through which organizations present themselves and communicate with the public in online space. However, it has not been actively studied, except the above, what and how organizational SNS accounts represent visually in their SNS photos. Focusing on startups’ Instagram accounts, this research aims to address this gap by pursing the following research question:
RQ1. What is visually represented in the startups’ Instagram photos? (a) What is the overall content of the startups’ Instagram photos? (b) What texts are presented in the startups’ Instagram photos?
Clustering as an Analytical Strategy for Examining Visual Representations
Visual representations in photos can be investigated at the level of subcomponents as well as a total photo corpus. It can be examined how the entire dataset can be divided into subgroups according to their visual characteristics, and the resulting subcomponents would reveal the key elements of the visual representations. Thus, clustering is a useful strategy for examining the structure of visual representations. Clustering is an unsupervised learning technique that splits a dataset into subgroups by assigning similar units to the same group, and it is used to detect the structures or patterns in the dataset (Ezugwu et al., 2022). In this regard, clustering has been applied to examine a wide range of topics in social science research (Fonseca, 2013) and to analyze various kinds of SNS data.
First, SNS users have been clustered and analyzed in the literature. Bamman et al. (2014) clustered Twitter users by their words and decomposed their styles and topical interests. van Dam and van de Velden (2015) used liked pages on Facebook to cluster fans of a football club and showed their differences in preferences. Dietz et al. (2020) clustered Twitter and Foursquare users by their streams of travel locations and identified three clusters with distinct travel patterns. Next, SNS posts in textual form have been analyzed using clustering. Mostafa and Nebot (2020) clustered Spanish tweets on the Arab image and identified four distinct clusters which manifest different aspects of the image. Cruickshank and Carley (2020) clustered Twitter hashtags about COVID-19 to identify its topics and found that some topics persisted throughout the pandemic while others vanished or shifted. Kwon and Park (2023) clustered posts about COVID-19 side effects from Twitter, Reddit, and YouTube and discovered thematic differences across platforms.
Additionally, SNS photos have been analyzed using clustering in the literature. Ketonen and Malik (2020) clustered Instagram photos with the #vaping hashtag and identified seven clusters with different topics. Huang et al. (2021) analyzed SNS photos of the Tri-City region in Poland and found that the photos clustered consistently with the regional districts. J. Kim and Kang (2022) and Arefieva et al. (2021) clustered SNS photos of tourism destinations, Seoul and Austria respectively, and identified clusters visually illustrating their different aspects. Egger et al. (2022) compared the SNS photos of a tourism destination uploaded by the destination’s management organizations to ones uploaded by ordinary SNS users and found that the photo clusters from the two types of uploaders showed different themes.
Notably, various features can be used for photo clustering: for example, location coordinates determined by a global positioning system (Huang et al., 2021), content tags suggested by online artificial intelligence (AI) services (Arefieva et al., 2021; Egger et al., 2022), and parameter values of a layer in pretrained DNN models (Ketonen & Malik, 2020; J. Kim & Kang, 2022) have been used in the literature. This study uses DNN-based features for photo clustering because they have been reported to have better performance for document clustering (Curiskis et al., 2020). They, however, pose challenges for human comprehension and have limited utility in comparing subgroups. Thus, photo features that are more readily interpretable by humans were additionally extracted to compare photos among clusters (features are introduced in detail in the Method section). These features can reveal the differences in visual characteristics at both the content and pixel levels.
In this study, all photos in the research sample regardless of their accounts were clustered and compared in terms of their visual representations, and the accounts were additionally clustered using the mean features of their photos (more in the Method section). The resulting clusters were compared in terms of their content, texts in photos, and photo features. Since clustering is an unsupervised learning technique, no human supervision is involved and it cannot be known or directed how the photos and accounts would be clustered and how the resulting clusters would differ beforehand. Instead, it can reveal the clusters and their differences that can be observed only after clustering was performed. Certainly, how a dataset would be clustered would depend on the features used. This study uses DNN-based features for clustering and manually-extracted features for comparing how the found clusters differ. The found clusters and their differences are expected to reveal the key components of the visual representations in startups’ Instagram photos. We raise the following research questions:
RQ2. How are startups’ Instagram photos clustered, and how do these photo clusters differ in terms of visual representations: content, texts in photos, and photo features?
RQ3. How are startups’ Instagram accounts clustered, and how do these account clusters differ in terms of visual representations: content, texts in photos, and photo features?
Method
The research framework, including aim, research questions, key steps, and expected results, of this study is presented in Figure 1.

The framework of the present research.
Research Sample
The list of startups was obtained from Fundz, a startup database, specifically from their Best Startup Companies page (https://www.fundz.net/startup-companies-ultimate-guide, 2021). We visited the official website of each company to collect their respective Instagram account. Companies without Instagram accounts or with inactive accounts with less than 30 posts were excluded from the research sample. Consequently, a total of 108 Instagram accounts of startups were chosen as the research sample (see Table A1 in the Appendix for the full list).
The data were collected using Instagram-Scraper-2021 (https://github.com/aahouzi/Instagram-Scraper-2021), which is a tool designed to extract data from Instagram. This tool utilizes the HTTP Archive (HAR) file, which records the tracking information exchanged between the web browser and the website. For each Instagram account, the program opened the corresponding profile page, scrolled through it three times, and saved the HAR file. Because the profile page and each page scroll displayed approximately 15 posts, the aim was to gather 60 recent posts. Due to variations in the number of posts on some accounts, however, an average of 56.73 posts per account (SD = 5.87) were collected.
Clustering Photos and Accounts
To cluster the photos and accounts, a k-means clustering method was employed. Initially, all photos within the research sample were transformed into vectors using the ResNet50 model (He et al., 2016) which had been pretrained on the ImageNet (Deng et al., 2009) dataset. Each photo was infused into the pretrained model, and the parameter values in the model’s penultimate layer were utilized as a photo vector consisting of 2,048 dimensions. Subsequently, the optimal number of photo clusters was determined using the elbow and silhouette score methods (Yuan & Yang, 2019). Figure 2 illustrates that the elbow (a) and the highest silhouette score (b) were achieved when the number of clusters was two, indicating two to be the optimal number of photo clusters. Consequently, all photos in the research sample, irrespective of their associated accounts, were clustered into two subgroups.

Finding the optimal number of photo clusters using: (a) the elbow and (b) the silhouette score methods.
The accounts were likewise transformed into vectors. To generate an account vector, all photo vectors associated with an account were averaged across each dimension. Similar to the photo clusters, the optimal number of account clusters was determined. Figure 3 illustrates that the elbow (a) and the highest silhouette score (b) were attained when the number of clusters was two, indicating two to be the optimal number of account clusters. Consequently, the accounts in the research sample were clustered into two subgroups.

Finding the optimal number of account clusters using: (a) the elbow and (b) the silhouette score methods.
Determining Photo Content
As the principal way of investigating visual representations, the overall content of the startups’ Instagram photos was examined. Each photo in the research sample was categorized according to its content using the Computer Vision (CV) application programing interface (API), available within Microsoft Azure Cognitive Services. The pretrained AI classified a given photo into 1 of the 15 predetermined classes: abstract, animal, building, dark, drink, food, indoor, others, outdoor, people, plant, object, sky, text, or transportation. The frequencies of photos in the classes would then show the overall content of a photo corpus. Additionally, the content tags and the accompanying confidence scores suggested by the CV API were also utilized. The pretrained AI provided tags that aligned with the photo’s content, along with confidence scores indicating the level of alignment. The confidence scores of all photos were then averaged within each content tag, enabling another overview of the overall content of a photo corpus.
Generating Cooccurrence Networks of Words in Photos
As another way of investigating visual representations, the cooccurrence networks of words in photos were examined. While the idiom, “a picture is worth a thousand words,” is frequently said about the capacity of visual data, it is also true that many photos on SNSs have text on them. Text has been one of Instagram’s major content categories from its early history (Hu et al., 2014), and text embedded in SNS photos reportedly differs in terms of its content and function from caption text attached to photos (Y. Kim & Kim, 2020). Thus, previous studies that have analyzed SNS photos have also analyzed text in photos (Egger et al., 2022; Muñoz & Towner, 2017; Smith & Sanderson, 2015). This is also the case in this study, because words in photos can be a significant part in visual representations.
The cooccurrence networks of the words in the photos were built as follows (Drieger, 2013). First, English words presented in the photos were detected using the optical character recognition (OCR) function provided in CV API. Next, the words were transformed into lowercase, and punctuation marks, stop words, and web addresses (e.g., “www,”“http://”) were removed. Frequent but meaningless words (“0,”“1,”“2,”“3,”“4,”“5,”“6,”“7,”“e,”“c,”“g,”“n”) were also removed. Finally, the remaining words that appeared in a photo together were connected by a link. As a result, a network with 12,472 nodes and 324,129 edges was built and used for analysis. This same procedure was then implemented for the photos in each of the photo and account clusters.
Extracting Photo Features to Compare Clusters
The number of words (the feature names are italicized hereafter in this section) detected using OCR was used as an analytic feature. To compare only the account clusters, Gini coefficient for the shares of photos in the 15 content categories was calculated for each account: it stands for the degree of concentration (inequality) in terms of the photo content. Additionally, the following features were extracted.
Facial Features
Features regarding human faces appearing in a given photo were extracted using the Face API in Microsoft Azure Cognitive Services. For a given photo, the pretrained AI identified human faces and provided estimated attributes for each face, such as age, gender, and emotions. These results were then used to extract the following features: the number of faces in the photo, the closeup which compares the size of the largest face to the overall photo size, and the face ratio which compares the combined sizes of all faces to the overall photo size. Additionally, age, the average age of the detected faces, and gender, the number of female faces, were recorded. The facial emotions on all faces in the photo were also averaged for each emotion category (anger, contempt, disgust, fear, happiness, sadness, surprise, and neutral), which was assessed as a real number ranging from 0 to 1.
Pixel Color Features
In digital photos, pixels store color information that can be represented using color space models like RGB (red, green, blue) and HSV (hue, saturation, value). This pixel color information was used to extract the following features.
The means and variances of red, green, blue, saturation, and value (i.e., lightness) were calculated across all pixels in a given photo. This resulted in features such as red mean, red variance, green mean, green variance, blue mean, blue variance, saturation mean, saturation variance, value mean, and value variance. Because hue is circular data unlike saturation and value, hue mean direction and hue circular variance (Hanbury, 2003) were calculated instead of simple mean and variance. Additionally, the number of peaks in the hue histogram (hue peaks) was determined: a hue histogram was created, and kernel density estimation was applied to smooth it. The resulting histogram was then examined to count the number of local maximums, which represented the photos’ level of being monotonous or mussy (Mao et al., 2003).
Visual Attractiveness Features
The visual attractiveness of a given photo was assessed using the features in previous studies (Datta et al., 2006; San Pedro & Siersdorfer, 2009). The extracted features included brightness, colorfulness, naturalness, contrast, RGB contrast, sharpness, color diversity, and color harmony.
Brightness refers to the overall brightness of a photo and was measured by calculating the average luminance (Y values in the YUV color space) across the photo’s pixels. Colorfulness represents how colorful a photo is and was measured with the means and standard deviations of metrics composed of relative amounts of red, green, and blue in the pixels. Naturalness captures how closely a photo aligns with a human perception of reality and was evaluated by examining the proportion of pixels whose saturation and luminance fall within a specific range. Contrast measures the relationship between local luminance variations and the surrounding luminance and was determined as the standard deviation of the luminance in pixels divided by the total number of pixels. Additionally, RGB contrast was measured by extending contrast into the three-dimensional RGB color space. Sharpness refers to the clarity and level of detail in a photo. It was assessed by a function of Laplacian of each pixel’s luminance, which was then normalized using the local average luminance in the pixel’s surroundings. Color diversity indicates the diversity of colors presented in a photo and was determined according to the fractal dimension calculated using the box-counting method (D. Kim et al., 2014). Color harmony reflects how harmonious the dominant colors in a photo are and was measured using the geometric formulations generated by the dominant colors on the color wheel: the internal angle between the two colors corresponding to the highest and second-highest peaks in the smoothed hue histogram represented the color harmony (J. H. Kim & Kim, 2019).
Results
Overall Visual Representations in Startups’ Instagram Photos (RQ1)
Regarding the content of the photos, Figure 4 suggests that text was the major type of content: the text category had the largest share of photos, and text-related tags, such as “text,”“screenshot,”“font,”“design,” and “graphics,” were included among the content tags with high confidence scores. Additionally, people was another major type of content: the people category had the second-largest share of photos, and people-related tags, such as “person,”“clothing,”“human face,”“smile,”“man,”“woman,” and “people,” were also included among the content tags with high confidence scores. Further, the content tags illustrate how people were represented in the photos: smiling faces of men and women in some clothes mainly appeared, and the people in the photos might be located around walls and more indoors than outdoors.

Content of startups’ Instagram photos: (a) frequency (share) of photos by content category and (b) content tags with highest mean confidence scores.
Figure 5 shows the partial illustration (for better viewing) of the cooccurrence network of the words in the photos (a) and the nodes with the highest degree (b). First, we observe that time-related words such as “time,”“day,”“week,”“month,” and “2021” were included in the high-degreed nodes, suggesting that startups mentioned particular times that were probably related to their events or releases of product and services. Additionally, community-related words such as “us,”“people,”“community,” and “social” were included: the value of community might take a major part in startups’ public communication via Instagram photos. Moreover, other values were manifested through words like “new,”“best,”“first,” and “free,” in their photos. Correspondingly, in combination with other words, startups (“company,”“business,” and “team”) might be communicating to the public that they are trying to realize those social values by aiding (“help” and “support”) people to do something (“know,”“learn,” and “use”), and their major domains include “health” and “life.”
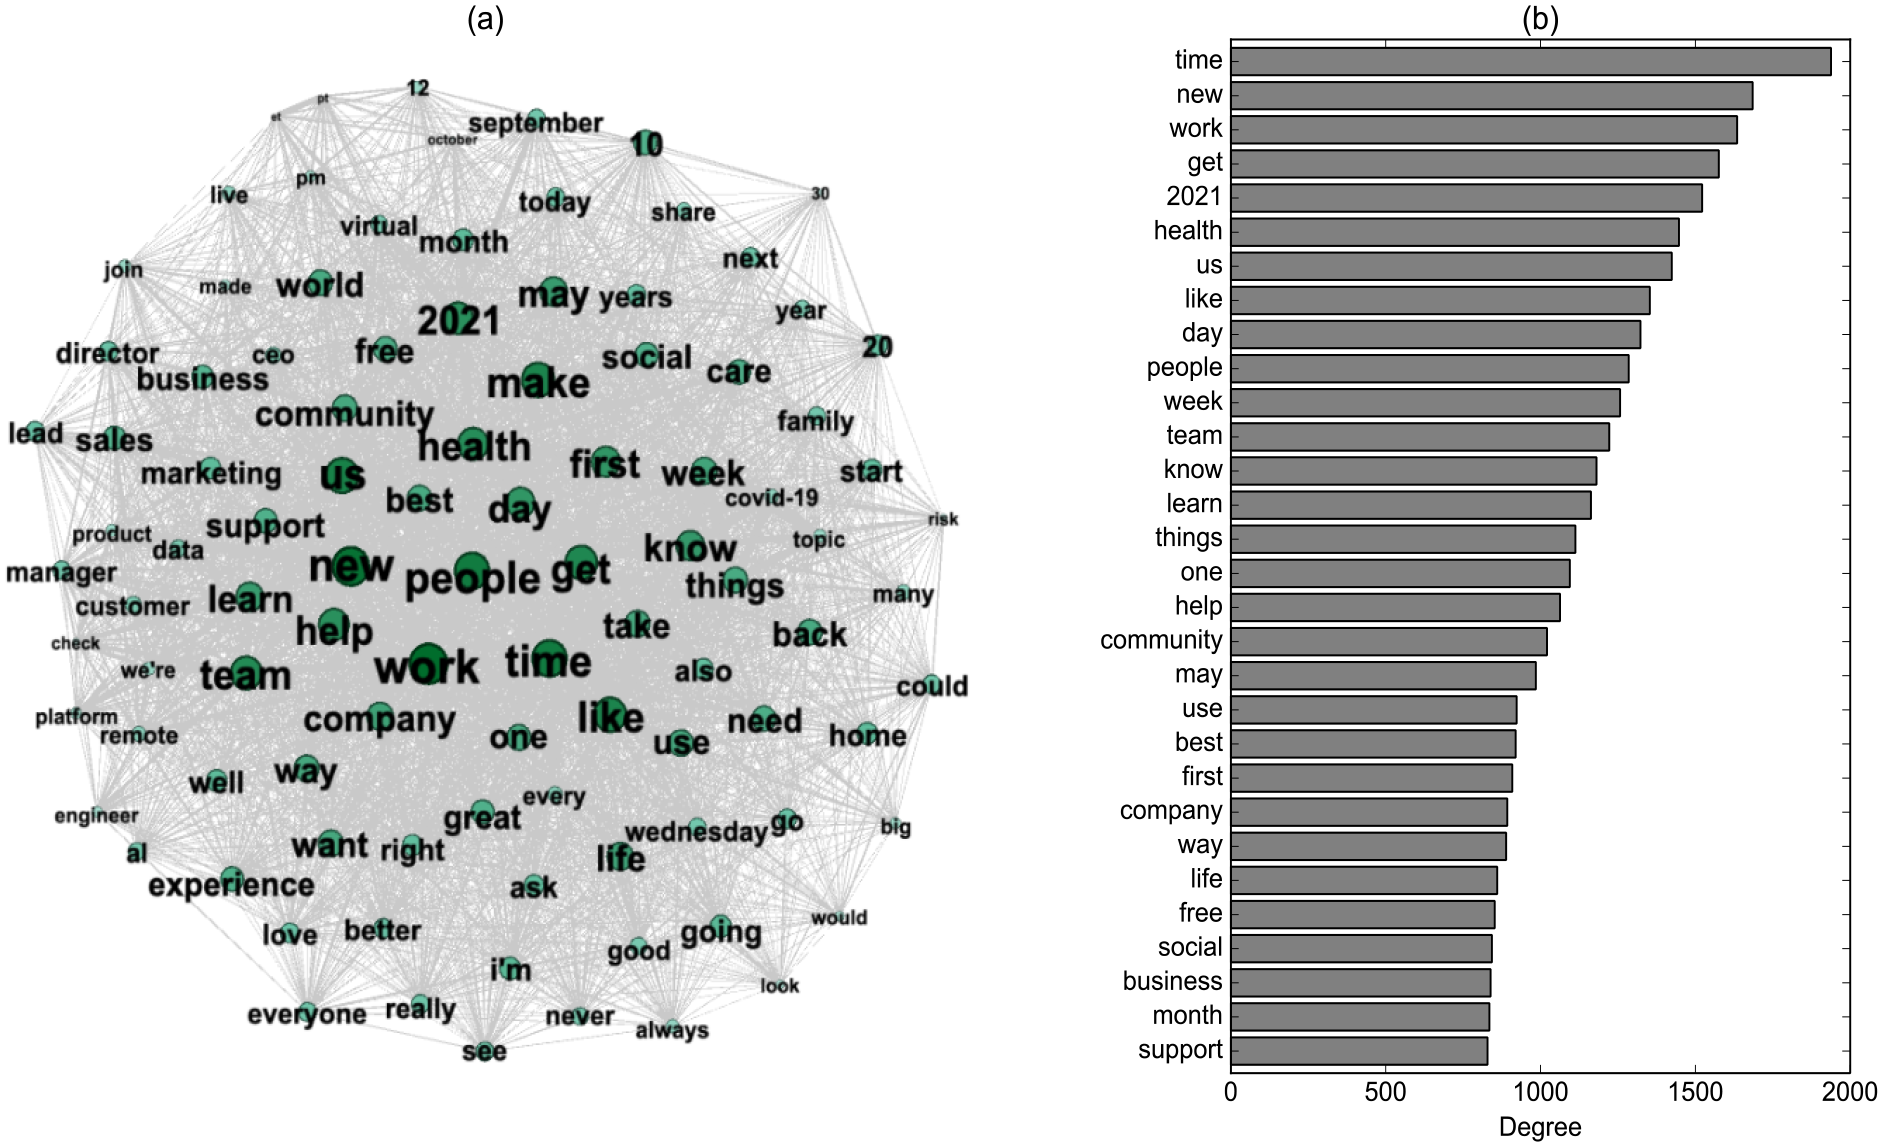
Cooccurrence network of words in photos: (a) partial illustration of the network and (b) nodes with the highest degree.
Comparing Photo Clusters in Terms of Visual Representations (RQ2)
First, photo clusters were compared in terms of their content. Figure 6 suggests that the content of the two clusters clearly differed. In the first cluster, people was the major content category: the people category had the largest share of photos, and people-related tags such as “person,”“clothing,”“human face,”“man,”“smile,”“woman,” and “people” were included among the content tags with high confidence scores. From the content tags, we can envision how people were represented in the photos: men and women in some clothes might be smiling, and they might be located around walls and more indoors than outdoors. Additionally, the “text” tag enables us to the envision that text might be presented along with people. This envisioning corresponds with the sample photos in the upper row of Figure 6c.

In the second cluster, text was the major content category: the text category had the largest share of photos, and text-related tags such as “text,”“screenshot,”“font,”“design,” and “graphics” were included among the content tags with high confidence scores. We can envision the way that the text was presented from the content tags: the text might be presented on graphical elements, such as “logo,”“poster,” and “illustration,” in diverse “fonts.” We can also envision that smiling human faces might be presented along with the text: tags like “human face,”“person,”“clothing,”“smile,” and “man” were also included. The sample photos in the lower row of Figure 6c are consistent with this envisioning.
Next, the cooccurrence networks of the words in the photos were compared (Figure 7). A network with 4,340 nodes and 30,858 edges and one with 10,179 nodes and 296,263 edges were generated from cluster 1 and 2, respectively: the people-centric photos in cluster 1 presented fewer words that were less connected to other words than the text-centric photos in cluster 2. Additionally, Figure 7b suggests that the nodes with high degree in the cluster 2 network were similar to those in the overall network, as shown in Figure 5b. In comparison, the words in the cluster 1 network were more about people. People- and community-related words that were not observed in the cluster 2 network and the overall network were presented: for example, “director,”“partner,”“customer,”“i’m,”“family,” and “world.” Further, the names of companies, such as Unite Us, Wrench, and Shield AI, were directly mentioned; presenting the company name with the smiling human faces would have been expected to make the company’s image more friendly and human-like.
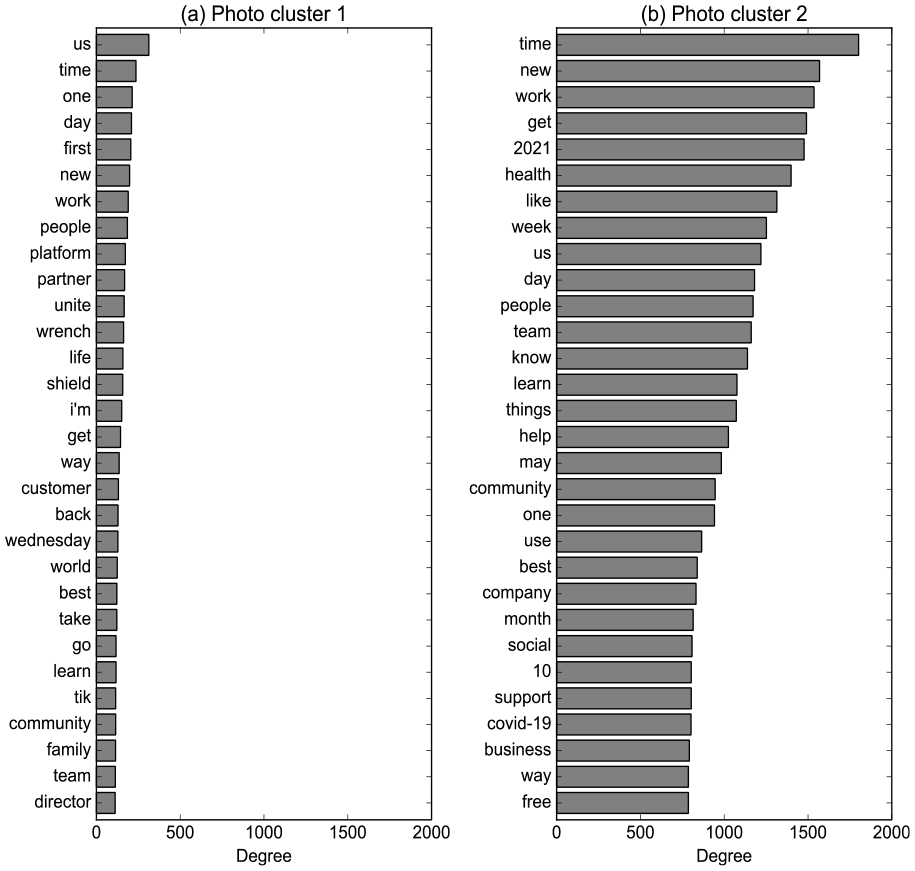
Nodes with high degree in the cooccurrence network of words in photos from each photo cluster: (a) photo cluster 1 and (b) photo cluster 2.
Finally, the photo clusters were compared in terms of photo features. The results in Table 1 suggest that the photos in cluster 1 had more and larger human faces in them; the number of faces, closeup, and face ratio were greater than those in cluster 2. Additionally, the photos in cluster 1 had older and more female faces on average: age and gender were greater in cluster 1. They also manifested stronger emotions except anger, disgust, and fear which were expressed extremely weakly in both clusters. Particularly, happiness was manifested more strongly in the photos in cluster 1. The photos were more diverse in color and luminance in cluster 1: variances in RGB, value, and hue were greater and color diversity was also larger in cluster 1 than in the other cluster. It would be because the contexts of people’s appearance in photos (cluster 1) are more diverse than those of text appearance in photos (cluster 2). This would be the reason why naturalness, contrast, RGB contrast, sharpness, and color harmony were greater in the photos in cluster 1; they were more natural, more contrasted, more detailed, and more harmonious in color.
Comparison Between Photo Clusters in Terms of Photo Features.
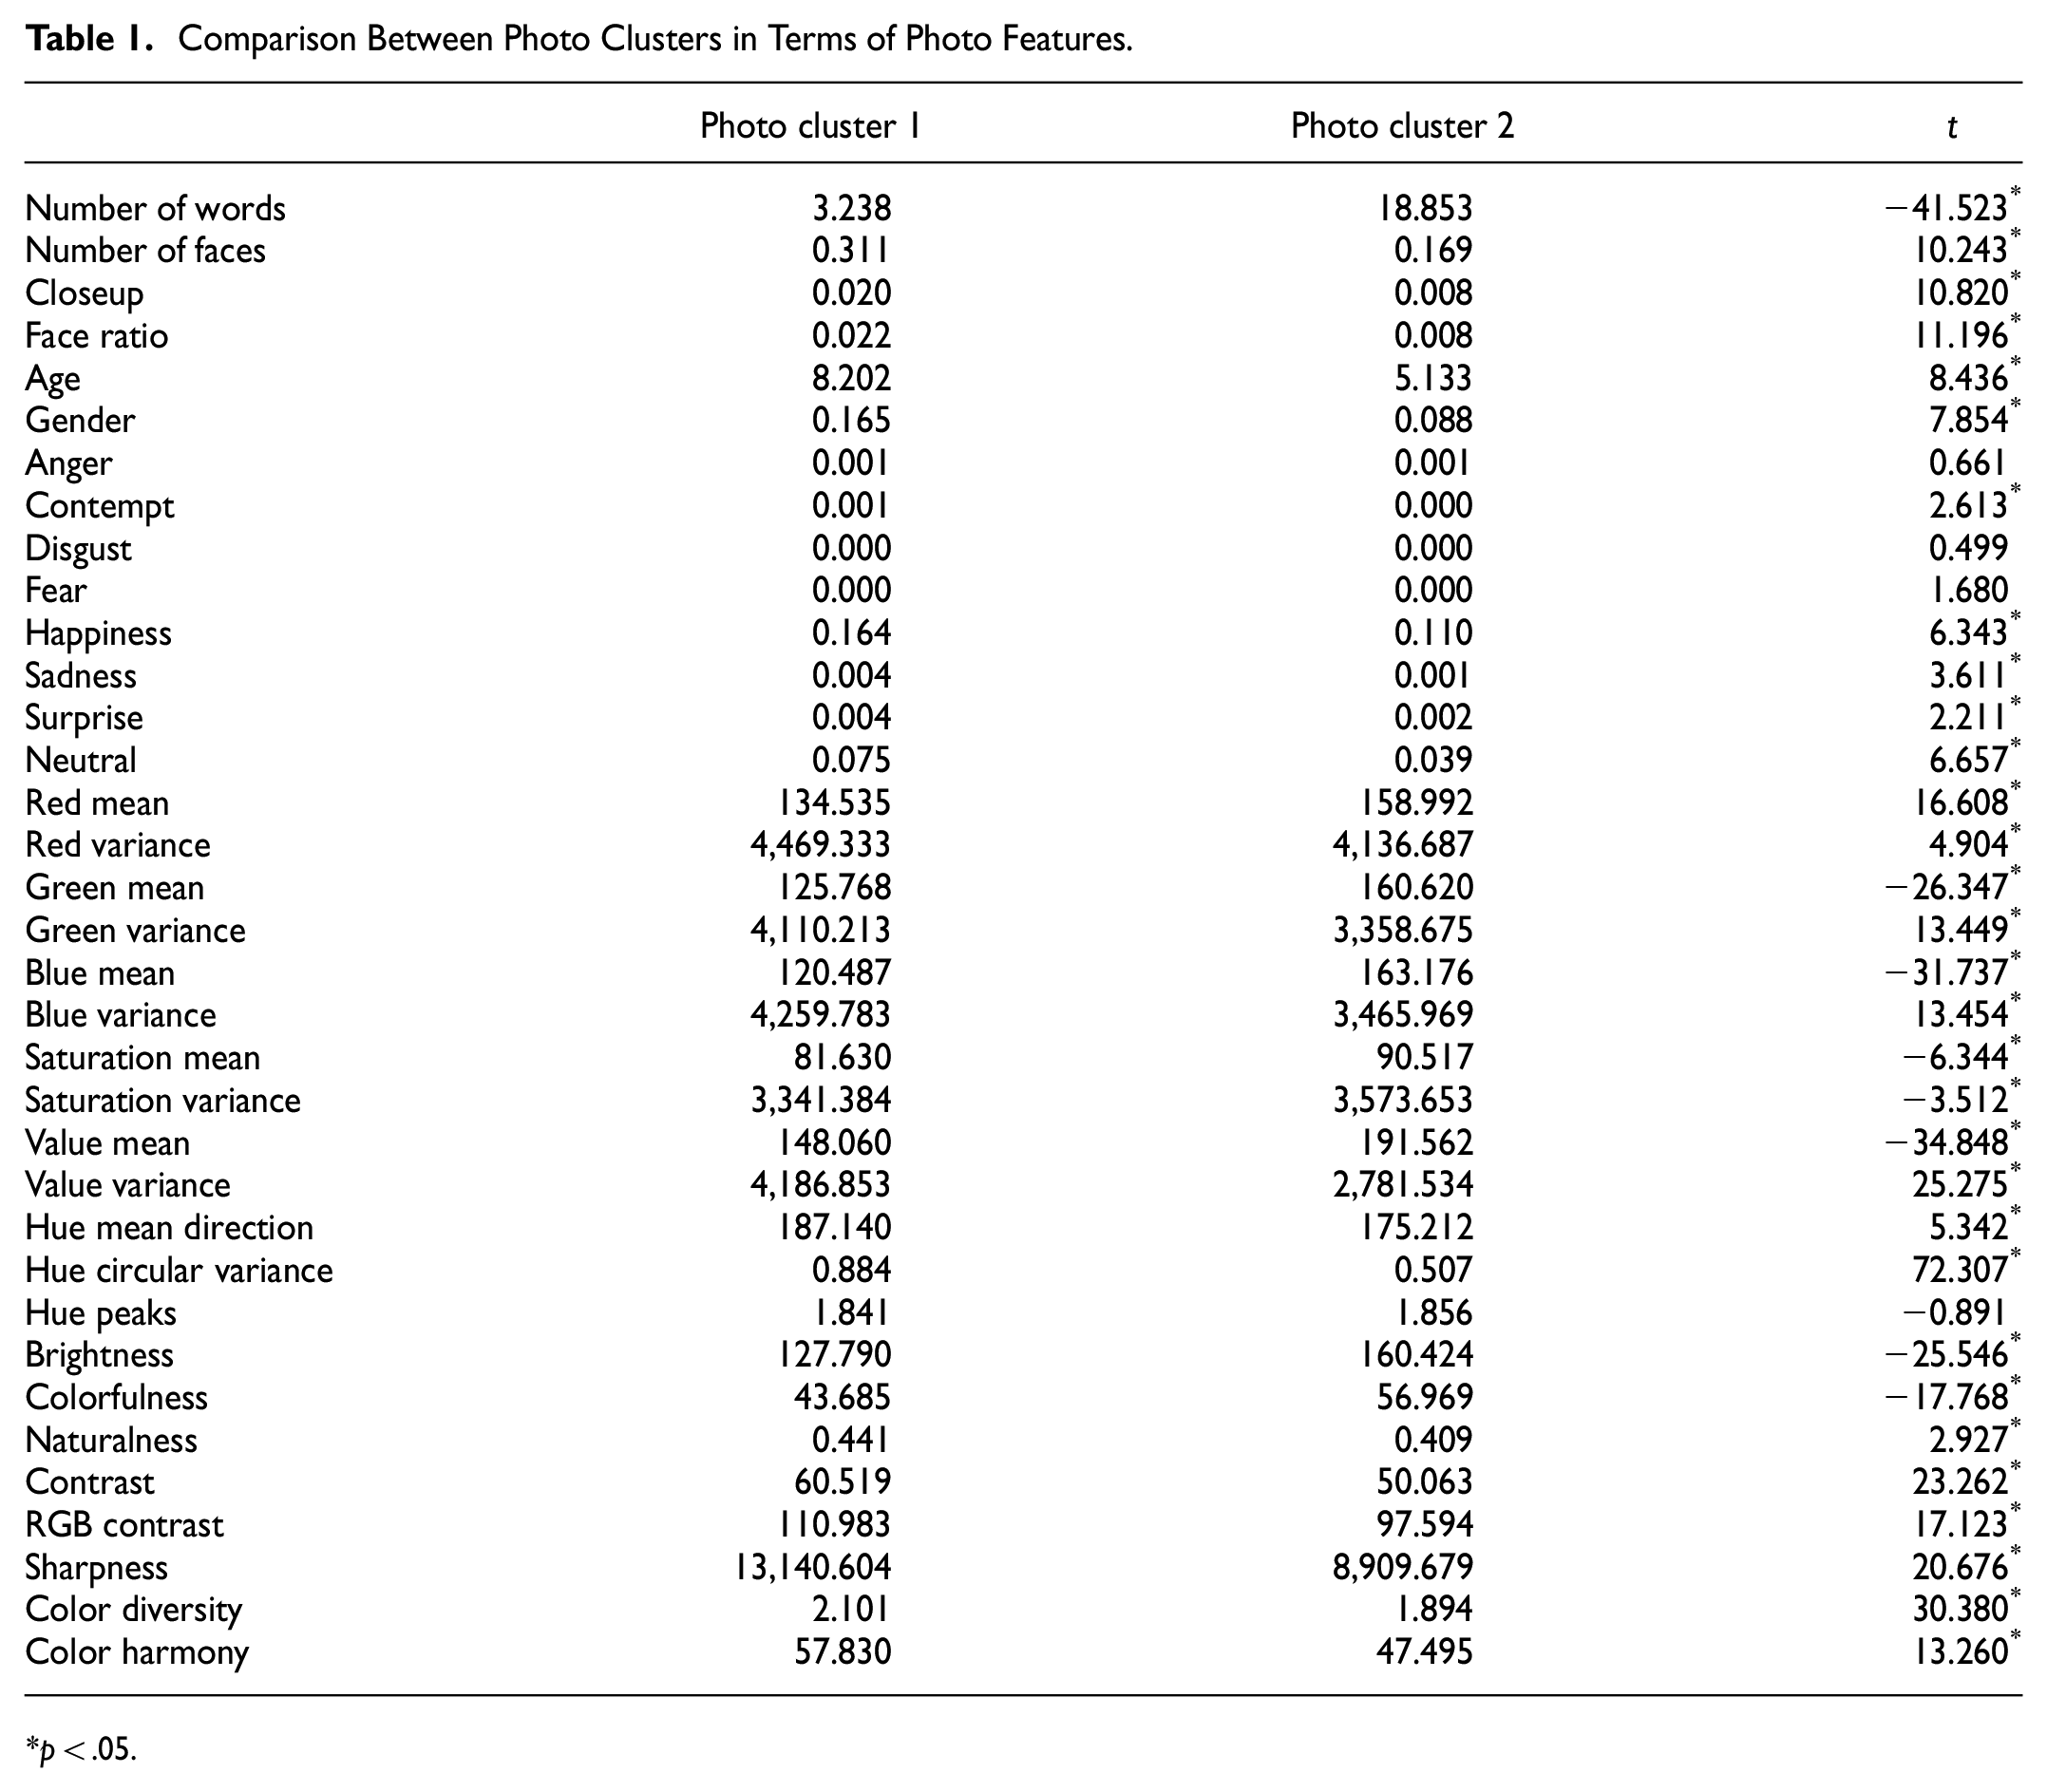
p < .05.
In contrast, naturally, the photos in cluster 2 had more words in them, considering that they were mainly text-centered. Additionally, they were brighter than the photos in cluster 1: their RGB mean, value mean, and brightness were greater. This might be due to bright backgrounds that the text was presented on (see examples in the lower row of Figure 6c). Furthermore, the photos in cluster 2 were higher in saturation mean, saturation variance, and colorfulness: ostensibly, text as well as backgrounds were presented colorfully to make them more noticeable.
Comparing Account Clusters in Terms of Visual Representations (RQ3)
Account clusters were compared in terms of their content. Figure 8 suggests that the photos in the two clusters had different content. In the first cluster, text was the major content type: the text category had the largest share of photos, and text-related tags such as “text,”“screenshot,”“font,”“design,” and “graphics” were included among the content tags with high confidence scores. People was the second major content type: people-related tags such as “person,”“human face,”“clothing,”“smile,”“man,” and “woman” were also included. There were fewer photos in the people category than in the text category while many people-related tags ranked high on the list: it is probably because a photo could be categorized into only a single class in terms of its content category while it could have multiple tags with high confidence scores simultaneously. Further, we can imagine that text accompanied by people was the major way of visual representations in the photos in the first account cluster. Additionally, the sample accounts in the first cluster mainly belonged to information technology (IT) companies. While they are diverse in application domains—for example, education (A Cloud Guru), data (Odetta and Lead Genius), health (Modern Health), financial (Capway and Brex), communication and management (Front and Lattice), and marketing (LeadIQ and Attentive)—, all their businesses centered around IT.

Comparison between account clusters in terms of content: (a) share of photos by content category, (b) content tags with highest mean confidence scores, and (c) sample companies with accounts closest to the centroids of each cluster.
In the second cluster, people was the major content type: the people category had the largest share of photos, and people-related tags such as “person,”“clothing,”“human face,”“man,”“smile,”“woman,” and “people” were included among the content tags with high confidence scores. Text was the second major content type: text-related tags such as “text,”“screenshot,”“design,” and “font” were also included. While there were much fewer text photos than people photos, many text-related tags ranked high on the list; this may be due to the difference between the content category and content tags, as in the first cluster. We can imagine that people supplemented with texts was the major way of visual representations in the photos in the second account cluster. Additionally, the sample accounts in the second cluster mainly belonged to companies regarding human-related services: for example, life insurance (Haven Life, Health Sherpa, and Bestow), health care (Carbon Health, Trella Health, and Flatiron Health), pharmacy (Capsule), nursing (Trusted Health), logistics (Emerge and Sendoso), user authorization (Auth0), and social commerce (Poshmark).
The cooccurrence networks of the words in photos were also compared between the account clusters (Figure 9). A network with 8,342 nodes and 214,024 edges and one with 6,596 nodes and 115,821 edges were generated from the photos in account cluster 1 and 2, respectively. The text-centric photos in account cluster 1 presented more words that were more connected to other words than the people-centric photos of account cluster 2; however, this difference between account clusters was not as dramatic as that between the photo clusters (Figure 7). Additionally, Figure 9a suggests that the nodes with high degree in the cluster 1 network were similar to these in the overall network (shown in Figure 5b), although the rankings differed slightly. In comparison, the cluster 2 network contained words about human activities: for example, “i’m,”“we’re,”“hiring,”“joining,”“service,”“everyone,” and “want.” The major elements, however, were shared across the clusters: words about time, community, company, and values comprised the major elements in both clusters’ word networks.

Nodes with high degree in cooccurrence network of words in photos from each account cluster: (a) account cluster 1 and (b) account cluster 2.
The account clusters were compared in terms of their photo features. Table 2 suggests that the differences between the account clusters were not as dramatic as those between the photo clusters (Table 1). In particular, almost no facial features differed significantly except sadness and surprise which were expressed extremely weakly in both clusters. This result may be because people was another major content type in the text-centered photos of account cluster 1; thus, both clusters contained photos of people as their major components of their visual representations. This is probably the reason why some pixel color and visual attractiveness features did not differ significantly between the two clusters; for example, RGB variances, naturalness, RGB contrast, and color harmony.
Comparison Between Account Clusters in Terms of Photo Features.
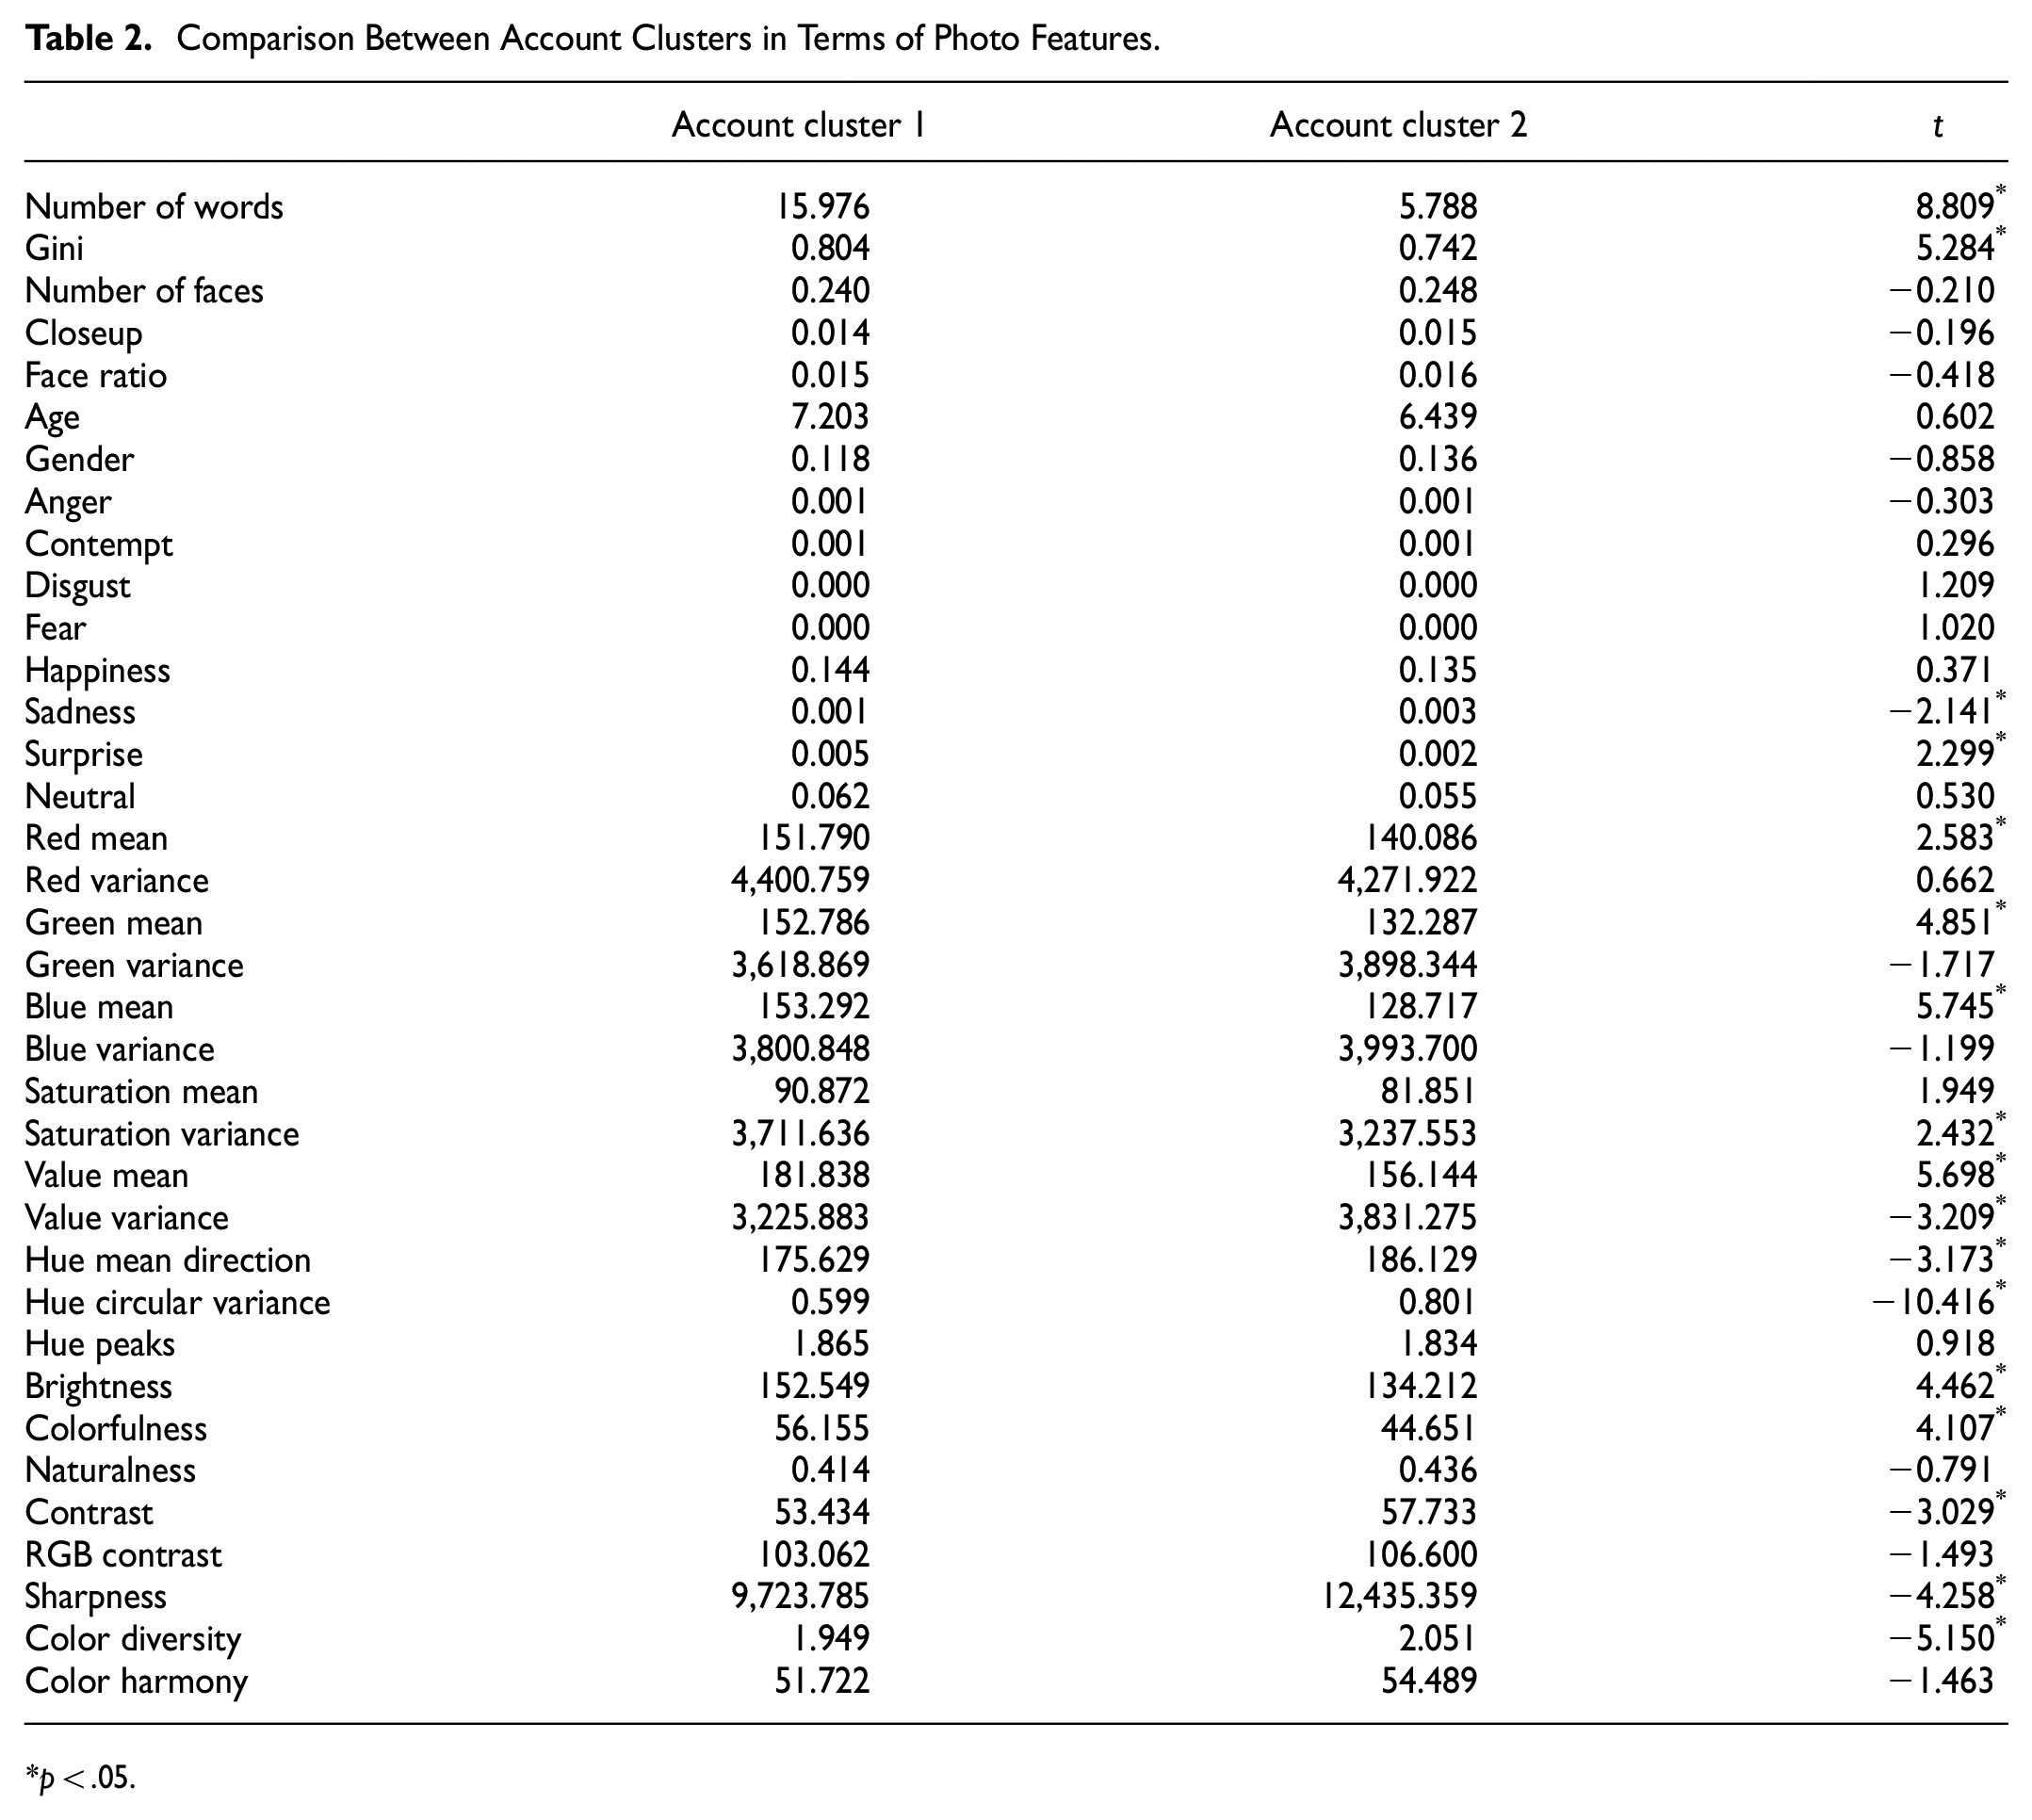
p < .05.
Nevertheless, the two account clusters differed in some aspects. The text-centered photos in cluster 1 contained more words in them. Additionally, the first cluster’s photos were generally brighter than those of the other cluster, probably because of the bright backgrounds on which text was presented; the RGB mean, value mean, and brightness were greater. Furthermore, the photos in this cluster were higher in saturation variance and colorfulness (and saturation mean, while insignificant); this suggests that texts and backgrounds were presented colorfully, maybe to draw more attention.
In contrast, the people-centered photos in cluster 2 were more diverse in content; Gini was smaller in this cluster. They were also more diverse in terms of color and luminance; color diversity, hue variance, and value variance were greater. This difference can be attributed to the fact that the contexts in which people appeared in photos were more diverse than those of the text that appeared in photos.
Discussion
The presentation of one’s feelings, thoughts, and activities are essential parts of online behaviors on SNSs, and this is also the case for organizational accounts. In particular, self-presentation on organizational SNS accounts can be linked to achieving organizational goals because the presented objects are the key instruments through which organizations communicate online with the public and stakeholders. The visual functions of recent SNSs have made this aspect more salient; organizations can more clearly and directly represent their status and activities through visual media such as photos and videos. Taking startups’ Instagram photos as an example, this study explores the visual self-representations in photos on organizational SNS accounts using computational analyses based on an unsupervised learning method. This approach can differ from previous studies which did not analyze the visual representations in organizational Instagram photos in detail (Guidry et al., 2017).
Summary of Major Findings
This study’s major findings can be summarized as follows. First, text was the major object represented in startups’ Instagram photos, suggesting that the key messages from the organizations might be presented directly through the text in the photos. The similar strategy can be found in populist parties’ communication via Facebook photos (Farkas et al., 2022). While this strategy may be limited in appreciating photos’ potential, it can be useful in that text in photos can be much more diverse in terms of its size, color, style, and location than the caption text. This is probably why text has been a major content type on visual SNSs (Hu et al., 2014). This can be especially the case for startups’ accounts, where increasing level of awareness can be critical to their success (Men et al., 2020); the level of awareness or word-of-mouth about the startups’ offerings may be their primary concern. Stating these directly in photos can be a better way to achieve this aim than attaching caption text below photos. In this regard, another of this study’s results regarding the key elements of text presented in startups’ Instagram photos is understandable: in general, startups might want to communicate to the public that they are trying to realize social values that can benefit communities by aiding people to do something in a timely manner.
Additionally, people was another major object represented in startups’ Instagram photos, suggesting that startups’ activities were presented through people, rather than products or locations, in their photos. Previous studies have reported that people, especially human faces, on SNSs can draw more attention (Tomalski et al., 2009) and promote more engagement (Bakhshi et al., 2014) from other users. Thus, it is natural that people was one of the major content types in startups’ Instagram photos, which is consistent with the previous studies that have shown that mentions about and from people are the major content types for startups’ accounts on text-centered SNSs (Chen et al., 2017; Singh et al., 2019). Furthermore, this study identifies how people were visually represented in startups’ Instagram photos: they were usually smiling, located around walls, and more indoors than outdoors. Sometimes, text was presented with people as a supplement. To the best of the authors’ knowledge, this study is the first to identify how people was represented in organizational SNS photos unlike previous studies that only coded photos whether people appeared or not (Malik et al., 2021).
Two clusters were detected respectively from photos and accounts in terms of their visual characteristics determined by a pretrained DNN model. The photos on startups’ Instagram accounts were grouped into two clusters, which differed in terms of their content, the words in cooccurrence networks, and their photo features. Additionally, the accounts, described according to the mean characteristics of their photos, were grouped into two clusters. It was found that the type of business of startups (IT or human-related service) was connected with whether people was the dominant content in their Instagram photos. This can be due to that startups can offer services without products that can be presented on the Instagram photos and this can be usually the case in IT companies. Besides, the account clusters showed distinct differences but they were less dramatic than those between the photo clusters. While the literature has utilized clustering methods to divide photo data into subgroups (Arefieva et al., 2021; Egger et al., 2022; Huang et al., 2021; Ketonen & Malik, 2020; J. Kim & Kang, 2022), the resulting subgroups have rarely been compared in terms of their visual characteristics. Further, it is hard to find studies using DNN-based features and manually extracted features in combination to identify the differences in the visual representations between subgroups.
Theoretical Implications
First, it expands the application of self-presentation theory to organizational SNS accounts by discovering what startups present in their Instagram photos and which kinds of photos, in terms of content- and pixel-level characteristics, are used for their self-presentation. Because self-presentation is inherently goal-driven and organizations have their own goals, the self-presentation of organizational SNSs can be directly linked to their business activities. Thus, this study may contribute to an understanding of the meaning of self-presentation in organizational and business contexts.
Next, this is the first study to analyze visual data on startups’ SNS accounts. While some studies have included startups’ Instagram accounts in their analysis (Robson & Banerjee, 2023), they have only coded posts for content analysis whether the posts contained visual materials and have not analyzed the posts’ visual characteristics. In contrast, this study identifies the visual characteristics of startups’ Instagram photos in terms of their content, the presented words in the photos, and their pixel-level characteristics. This identification can enhance our comprehension of how startups, and organizations in general, communicate their activities with the public via visual media, which has been overlooked in the literature.
Regarding methodological aspects, we conducted computational analyses to retrieve information that would either be too expensive or even impossible for human coders to retrieve. In particular, we employed an unsupervised learning method that makes no initial assumption about the data units and discovers the underlying structures in the dataset. Additionally, this study can serve as a model regarding how DNN-based and manually extracted features can be used together to identify key elements of visual representations in unstructured datasets.
Practical Implications
This study provides a framework for examining how organizations communicate online with the public; an organization’s methods of online communication can be quantitatively compared with those of other organizations. This comparison can be a hint to understand, or improve, the way of online communication conducted visually on SNSs.
Limitation and Future Works
This research also has a few limitations. The visual self-presentation in startups’ Instagram photos was not examined in terms of its relationships with the companies’ performance. Future studies should consider various performance measures, such as engagement or business profit, in their investigations of visual representations. Additionally, this research did not consider the growth level of startups and its impact on online visual representations. The growth level of startups is reportedly related to the information on the companies’ SNSs (Peixoto et al., 2023), and future research can examine whether this is also the case for visual representations. Furthermore, the process and dynamics of making decisions regarding which visual representations to display on SNSs should be examined; the influence of key players in organizations, such as CEOs or account managers, on these visual representations is a topic for further studies.
Conclusion
Based on the similarity between individuals and organizations in terms of online behaviors, this study examined the organizational account from the self-presentation perspective. It analyzed startups’ Instagram photos and explored the visual representations in them. It also provided photo clusters which showed the different aspects of visual representations, and it also identified account clusters which showed visual representations that differed by business domains.
Footnotes
Appendix
Sources of Photos in Figure 6c (From Top Left).
Declaration of Conflicting Interests
The author declared no potential conflicts of interest with respect to the research, authorship, and/or publication of this article.
Funding
The author received no financial support for the research, authorship, and/or publication of this article.
Ethical Approval
An ethics statement for animal and human studies is not applicable to this study.