
Abstract
The purpose of this applied naturalistic study was to determine the effectiveness of brief counseling, estimate the potential cost savings associated with select outcomes, and explore the client ratings and comments evaluating their experience. Follow-up survey data from 830 employee users of counseling services from a statewide employee assistance program (EAP) were analyzed. Paired tests examined changes in anxiety, depression, health status, life satisfaction, and work productivity. At the start, more of the EAP cases were above the threshold for at-risk status on each outcome than healthy employees in normative data. Significant reductions in risk were achieved for all outcomes after counseling. Improvements in health were correlated with improvements in work productivity. Most of the cases (82%) considered their experience to be positive and helpful. Results were used to estimate an ROI of $4.26:$1 for the EAP from avoided overall health care treatment costs for depression ($611/case) and avoided lost work productivity ($1,433/case).
Mental health issues are deeply disruptive for the individuals experiencing them as well as their friends, family, and coworkers. Employers are also concerned about how to best support employee mental health. The need for mental health support among working adults is well documented in the global literature (Attridge, 2019). Epidemiological data on the prevalence rates in the United States indicate that about 1 in every 5 (20%) working adults have diagnosable mental health disorders and/or substance abuse problems (Karg et al., 2014). In addition to high prevalence rates, the health care system in the United States has challenges in finding and properly treating people with behavioral health conditions. According to Wittchen et al. (2003), the medically-focused approach commonly used in primary care is “best described by the rule of diminishing halves: only half the patients with a threshold disorder are recognized; only half of those recognized are treated; and only half of those treated are effectively treated” (p. 115). This undertreatment problem for behavioral health has many consequences.
The cost to employers for behavioral health issues among members of the workforce is enormous (Blount et al., 2007; Greenberg et al., 2021; Roehrig, 2016). Numerous studies in the United States have demonstrated that people with behavioral health conditions have increased overall health care costs (Goetzel et al., 1998, 2012, 2020; Davenport et al., 2020). This high cost is driven in part by the comorbidity between mental health disorders and physical diseases (Thorpe et al., 2017). There is also evidence that behavioral health risk factors experienced by employees are associated with missing work and with productivity lapses (Allen et al., 2018; Boles et al., 2004; Mitchell & Bates, 2011; Mitchell et al., 2013). Work presenteeism is defined as a problem of not being psychologically present enough while working to perform properly (Aronsson et al., 2000). Most studies find that for employees with behavioral health risks, the hours of lost work productivity due to presenteeism are about four times greater than the hours lost due to absenteeism (Lohaus & Habermann, 2019; Attridge, 2020b; Nagata et al., 2018). Depression, in particular, is strongly linked with increased employee work presenteeism (Berndt et al., 1998; Attridge, 2020c; Stewart et al., 2003).
Employers in the United States are financially burdened by these health care treatment costs and lost work productivity costs. Unlike all other industrialized countries, the United States does not sponsor health treatment services as a right of citizenship (Niles, 2019). Instead, all but the smallest employers must pay for the health insurance of working-age adults and early retirees (Gabel et al., 1989). Only those who are poor and not working, or are on disability, or are active in the military or veterans qualify for government-sponsored health care services. Employees do share in paying for the cost of health insurance premiums with employers and also pay part of the costs incurred from the use of services, but most of these total costs in the U.S. are borne by employers (Davenport et al., 2020). In addition to productivity-related losses that apply to all employers, employers also pay indirectly for most of the costs of health-related short-term absence from work (i.e., paid time off days) as well as for longer-term absence due to disability and workers compensation related events.
The Role of Employee Assistance Programs
Employers have a range of behavioral health benefits and tools to choose from to address the rising tide of healthcare and workplace cost burdens from mental health disorders. The goal of EAPs is to provide personalized counseling, supportive resources, and referrals to health care providers (if needed) to restore the well-being and work productivity of employees with emotional health, family, and workplace challenges (Attridge, 2012). The EAP approach is especially popular employee benefit with most organizations now with more openness in society to discussing mental health issues (Greer, 2021).
Most employers in the United States sponsor employee assistance programs as a benefit for their employees and family members. More specifically, according to the most recent national random sample study of employers in the United States (Bureau of Labor Statistics, 2021), most employers have an EAP, but this status varies by the size of the company and sector type. About 8 out of every 10 employees in the public sector have access to an EAP, with the federal government, 94% of state governments, and 74% of local governments offering an EAP. In the private sector, 84% of large businesses (with 500 or more employees), 68% of medium-size employers, and 33% of small-size employers (under 100 employees) sponsor an EAP benefit. A 2019 survey by the Society for Human Resource Management (2019) found that 79% of its’ 2,700 employers in the U.S. offered an EAP. A recent survey of 237 U.S. employer members of the International Foundation of Employee Benefit Plans (IFEBP; Held, 2021) found that in year 2021 the majority had an EAP benefit, but it varied by type of organization: 91% of corporate employers; 92% of public sector employers; and 61% of multi-funded employers (medium and smaller size employers) had an EAP.
Part of the popularity of EAPs is related to their effectiveness. The evidence shows that users of EAP counseling services tend to be satisfied with the experience and find it effective in improving the kinds of clinical issues that prompted using the service (see Attridge et al., 2013). Brief counseling for employees also routinely yields positive outcomes for employers with modest reductions in absence days and substantial improvements in the level of work productivity (Attridge, 2016; Attridge et al., 2018; Richmond et al., 2015). Several literature reviews have all concluded that there is consistent evidence for the effectiveness of EAP counseling services on both clinical and work outcomes and these outcomes provide the potential for cost savings to the employer sponsors of EAP that more than offset the investment in the services (Blum & Roman, 1995; Csiernik, 2011; Csiernik et al., 2021; Joseph et al., 2018; McLeod, 2010). As this kind of counseling is generally effective in reducing various kinds of behavioral health risks, there are also possible cost savings associated with these outcomes when such risks are reduced over time (Blumenthal et al., 2017; Hargrave et al., 2008).
Health and Work Performance Are Linked
There is also evidence that common behavioral health risk factors (particularly depression; see Berndt et al., 1998; Attridge, 2020c) are associated with employee absenteeism and presenteeism (i.e., lost work productivity; Boles et al., 2004; Kowlessar et al., 2011; Mitchell & Bates, 2011; Shi et al., 2013). The relatively greater impact that behavioral health issues have on work presenteeism than on work absence also is a theme of the research in this area (Lohaus & Habermann, 2019; Attridge, 2020b). Three past research reports with data specific to EAP use also document the co-occurrence between improvements in employee health and improvements in work performance after counseling. Riedel and Attridge (2000) examined post-use survey data from 1,050 EAP counseling cases from a national EAP vendor in the United States and found significant positive correlations between the extent of improvement in self-reported health and well-being with the extent of improvement in both work productivity (r = .26) and hours of work absence (r = .12). Similar findings were obtained from analysis of 642 EAP cases at an EAP vendor in Canada (reported in Attridge, 2016), with significant positive correlations between the extent of improvement in self-reported health and well-being with the extent of improvement in work productivity (r = .29) and work absence hours (r = .24). A small longitudinal study of 46 employee users on onsite EAP counseling with longitudinal data (Attridge & Dickens, 2021) found that improvement in global health was positively correlated with improvement in hours of productive work time at each of three waves of data collection: at the end of treatment (r = .33); at 3-months follow-up (r = .35); and at 6-months follow-up (r = .50). These three studies all found that changes in health outcomes tended to co-occur with changes in work outcomes among employees who used EAP counseling. Other studies specific to EAP are needed to further explore the link between behavioral health and work outcomes.
COVID-19 Pandemic
Mental health and substance misuse issues have been exacerbated during the recent ongoing COVID-19 global pandemic (Abdalla et al., 2021). For example, results of the National Health Interview Survey and the U.S. Census Bureau showed that in the first half of 2019 (before the pandemic) 11% of Americans reported symptoms of depression or anxiety—but that after the pandemic had taken hold this rate jumped to 41% (Panchal et al., 2021). Since early 2020 when the COVID-19 global pandemic started, the EAP industry has responded by expanding the delivery of counseling services using remote technology options (Hughes & Fairley, 2020). The traditional emphasis on face-to-face interactions between the employee and counselor in an office switched to reliance on technological modalities of service delivery. This modality change coincided with most EAPs also experiencing higher utilization rates (Attridge, 2021).
Researchers have only started to explore possible changes in the level of the health and work related outcomes from counseling for users of EAPs since the pandemic started. One industry study of almost 8,800 cases across many different EAPs compared cases before and during the pandemic on workplace-related outcomes (Attridge & Steenstra, 2021). This study found the pandemic period cases in the year 2020 tended to have a very similar profile, in general, on the five outcomes measured by the Workplace Outcome Suite (WOS; Lennox et al., 2010) at Pre and Post use compared to cases in the year 2019. There were no differences in the work engagement or life satisfaction outcomes and just slightly higher levels of workplace distress, work presenteeism, and work absenteeism in the pandemic year. Note that overall EAP program utilization rates and clinical outcomes were missing from this EAP impact study by Attridge and Steenstra (2021).
Study Context
Invest EAP Centers for Wellbeing is a public, not-for-profit organization that operates within the State of Vermont’s Division of Vocational Rehabilitation. The program serves thousands of employees and their household members, including virtually all public sector employees in the state as well as numerous private sector organizations. Many smaller size employers are supported, with a median size of 45 employees among the private sector employer customers. Approximately 20% of the State’s entire population is covered by this organization. This EAP routinely collects follow-up survey data from its users of the counseling and other support services. In the fall of 2019, the standard survey was revised to include a more comprehensive set of brief items on multiple behavioral risks and work factors. Also included was a question to evaluate their EAP experience and the opportunity to provide a comment.
The state of Vermont is geographically located in the northeast region of the United States. It is the sixth smallest state in the country, based on the number of total square miles of land. It has a population of about 640,000 people (which is the second smallest in the country). The population in Vermont is mostly of White race (94%), evenly split by gender, and has a median age of 43 years—which is the second oldest in the country (United States Census Bureau, 2021). It is a mostly rural state, with only three cities of more than 10,000 residents. The average employee in Vermont in the year 2020 was paid $53,420 in wages (United States Bureau of Labor Statistics, 2020a, May), which is only slightly lower than the U.S. national average of $56,310 (United States Bureau of Labor Statistics, 2020b, May).
Research Questions
To explore some of the gaps identified in the research literature, we explored the following research questions:
RQ1: Do employee users of EAP counseling have higher levels of risks on behavioral health factors and work productivity than the typical worker?
RQ2: Is the counseling associated with improvements in health and work outcomes?
RQ3: Is there a relationship between improvement in health outcomes and improvement in work productivity?
RQ4: Do certain factors moderate the extent of improvement after counseling, such as the number of sessions with the counselor (clinical dosage) or the reason why the EAP was used?
RQ5: What are the potential cost savings to the purchaser of EAP services based on avoided excess overall health care treatment costs associated with depression?
RQ6: What are the potential cost savings to the purchaser of EAP services based on avoided workplace costs associated with health-related lost work productivity?
RQ7: What is the experience of the counseling from the perspectives of the clients?
RQ8: What impact did the COVID-19 pandemic have on the use of EAP services, outcomes, and evaluation of the experience?
Methods
Research Design
The design was a single group with a clinical intervention (1–5 or more sessions with a counselor) with quantitative and qualitative data collected at a follow-up approximately 2 months after the intervention. Respondents were asked retrospectively to rate five outcomes experienced during the 1-month period before starting counseling (pre use—designated as “Pre-R” in this paper) as well as rate the same outcomes for the current past month (post use). Also included was a question to evaluate their EAP experience and the opportunity to provide comments.
The cases were all obtained from naturally occurring experiences of employees who voluntarily used the EAP and completed an optional follow-up survey. The survey operational practices were done across many different employers and were not part of a formal research study. The follow-up surveys were completed anonymously by users of the EAP service. Thus, the privacy of all clients was fully protected. The only identifying data on the survey asked about the name of the employer (i.e., the sponsor of the EAP). In summary:
Post use of EAP outcome and evaluation data was collected at 30 to 60 days after the last date of contact with EAP with a self-report anonymous survey. Why the EAP was used and total contacts with the EAP were also assessed with questions on the Post survey.
Pre use of EAP outcome data was collected at the same time as the Post data, but with instructions for retrospective recall of experiences for each outcome for the period before starting the use of the service. This time point is designated as “Pre-R.”
Ethical Considerations
As this was an applied study of archival anonymized data collected from routine use of a commercial service, informed consent from individual client’s included in the study was not required. Project approval from a university internal review board (IRB) also was also not required. This context is shared with other applied studies of operational data from commercial mental health support programs (Attridge, 2020a; Carpenter et al., 2016; Lungu et al., 2020, 2021; Schneider et al., 2020). This study was conducted within the ethical guidelines of the American Psychological Association (2017) for applied research.
Survey Sample
The data was collected over a 23-month period between November of 2019 and the end of September 2021. When people first contact the EAP, they are informed of a follow-up survey and provided the option to not participate if the person has personal safety or other concerns. Generally, about 80% of users are in the survey pool. The general process is to offer an anonymous survey to clients of the service about 6 weeks after the final use date. Thus, the typical time lag for the survey was between 1 and 2 months post counseling. During the data collection phase, the response rate was 13% (1,069 of 7,942 cases in total in the 23-month period). Of the 1,069 total sample of completed surveys, 69 were disqualified for missing data or for not completing use of the service after being given a referral from the EAP to see a local counselor or a legal/financial specialist. The users of the legal and financial specialists (n = 170) were removed from the study as they did not use the counseling part of the EAP for clinical intervention. The final valid sample size was 830 employed users of individual counseling from the EAP service. The evaluation item of the client’s experience with using the EAP was not added to the survey until the start of the 2020 year and therefore this item had a smaller sample size of 717 responses.
Clinical Interventions
There was a variety of contexts in how and where the clinical treatments were provided (mix of counselor office locations, videoconference, or onsite at the employee’s workplace). The employees worked for many different employers in the local area.
Measures on Follow-Up Survey
Most of the self-report measures featured in the study were taken from other sources in the research literature or adpated from publicly available measures.
EAP issue
The reason for EAP use was assessed with this question on the survey: “What was the primary issue you worked on in EAP counseling?” With response options of: Family (e.g., relationship), mental health (e.g., depression/anxiety/stress), alcohol use, drug use, workplace, financial/legal, or other.
EAP sessions
The extent of EAP use was assessed with this question on the survey: “About how many EAP meetings did you have (Please count phone and in-person meetings with counselors, attorneys, and financial advisors)?” With response options of: 1, 2, 3, 4, or 5 (or more meetings).
Mental health—Depression and anxiety
The ultra-brief versions of the PHQ-9 for depression (Arroll et al., 2010; Kroenke & Spitzer, 2002) and the General Anxiety Disorder scale GAD-7 for anxiety (Spitzer et al, 2006) are combined as the Patient Health Questionnaire 4 or PHQ-4 (Kroenke et al., 2009; Löwe et al., 2010). Past research has determined each of these measures have acceptable psychometric reliability and validity (Arroll et al., 2010). Symptoms of depression were assessed with the following two items from the PHQ-9: How often were you bothered by little interest or pleasure in doing things? 2) How often were you bothered feeling down, depressed or hopeless? Symptoms of anxiety in were assessed with the following two items from the GAD-7: item 1) How bothered were you by feeling nervous, anxious, on edge?; item 2) How bothered were you by not being able to stop or control worrying? The depression measure and the anxiety measure both are scored by adding together the two items with a range of 0 to 6, with higher scores indicating greater severity and at-risk status defined as a score of 3 or more. Instructions asked for ratings at two different points in time: (1) “During the 2 weeks prior to contacting the EAP.” (2) “During the most recent 2 weeks.” The 2-item depression scale had good internal reliability (α = .85 Pre-R; .84 Post), as did the 2-item anxiety measure (α = .85 Pre-R; .85 Post).
General health status
One of the 10 items of the global health assessment component of the Patient-Reported Outcomes Measurement Information System (PROMIS) questionnaire was used to assess overall perceived health status in the past month (Hays et al., 2009). These measures have established measurement reliability and validity in general populations (Magasi et al., 2011) and in EAP counseling cases (Attridge & Dickens, 2021). The perceived health item is one of the most widely used self-report measures in all of health care research. Item = In general, my health is: Poor (1), Fair (2), Good (3), Very Good (4), or Excellent (5). At-risk status was defined as a rating of Poor or Fair. Instructions asked for ratings at two different points in time: (1) “During the 4 weeks prior to contacting the EAP.” (2) “During the most recent 4 weeks.”
Life satisfaction
The overall level of life satisfaction in the past month was measured by an adapted version of the single-item Life Satisfaction question from the brief version of the Workplace Outcome Suite (Lennox et al., 2018). Other research indicates this item has acceptable test-retest reliability and validity (Attridge, 2020b). Item = So far, my life seems to be going very well. Response options on a Likert scale: Strongly disagree (1), Disagree (2), Neutral (3), Agree (4), Strongly agree (5). Based on Attridge et al. (2018), at-risk status was defined as either of the two disagreement ratings (i.e., 1 or 2). Instructions asked for two ratings at different points in time: (1) “During the 4 weeks prior to contacting the EAP.” (2) “During the most recent 4 weeks.”
Work productivity
A single-item asking about work productivity in the past month was adapted for this study from the job performance question from the World Health Organization’s Health and Productivity Questionnaire (Kessler et al., 2003). Item = How would you rate your overall productivity at work? With the response options on a 0 to 10 scale, with 0 = Worst performance and 10 = Top performance. Other research indicates that the typical healthy employee is at about 85% productive on a scale of 0% to 100%, when rating their own level of job performance (see literature review in Attridge, 2020b). Thus, we defined a score on this item at below 80% level of productivity (i.e., ratings of 0–7) as having a “work performance problem.” Instructions asked for two ratings at different points in time: (1) “During the 4 weeks prior to contacting the EAP.” (2) “During the most recent 4 weeks.”
Evaluation of EAP experience
The level of user satisfaction with the program was assessed with the item: Overall, my EAP experience was positive and helpful. This was rated on a 1 to 5 Likert-type scale: Strongly disagree (1), Disagree (2), Neutral (3), Agree (4), or Strongly Agree (5). The end of the survey included an open-ended question that asked for any comments about their experience.
Measures Created Post-Hoc
COVID-19 pandemic periods
The study sample was divided into two groups that included cases who started their use of the EAP in the period before the pandemic (4-months of November 2019–February 2020; n = 178, 21%) and the period during the COVID-19 pandemic that started in March of 2020 and continued in our data to September of 2021 for 19 total months; n = 652, 79%).
Difference scores on outcomes
To explore the linkage between improvement in health outcomes and improvement in work outcomes, differences scores were created for each outcome measure. This was done by subtracting the Post score from the Pre-R score and if needed, reverse-scoring the metric so that each difference score had a higher (positive) score that indicated improvement over time. Each difference score had a near-normal distribution across cases, with most of the cases in the middle of the scale and fewer cases at the more extreme positive and negative score ranges.
External Norms for Risk Levels in Employed General Population
Appendix A lists the sources for normative levels of risk in the general employee population for each outcome. These risk levels were used to compare to the study sample.
Estimated Excess Health Care Cost Burden for Depression
Although our study did not collect health care use and cost data for the study participants, other large-scale research studies have done so. A typical finding of these studies is that people with behavioral health risks tend to be more costly in terms of overall health care treatment than those who do not have the condition. Most of these kinds of applied archival studies have relied on self-report methods to identify people with health risks status (from health risk appraisal surveys conducted at large employers). Appendix B presents a summary of the series of three studies conducted for the Health Enhancement Research Organization (HERO; Goetzel et al., 1998, 2012; 2020) that involved a combined sample size of over 273,000 people. Their average finding, when statistically controlling for many other relevant factors, was that a person with depression risk was 44.3% relatively more costly than someone without this risk.
We used these external findings to estimate the dollar value, matched to our study context, for the excess annual treatment cost associated with depression risk. This was estimated at $2,205 per case at-risk. The details for determining this figure are presented in Appendix B.
Estimated Employee Wages
The survey did not ask employees to report how much they were paid for work. Thus, the cost value for work time had to be estimated. The most relevant recent source for paid wages in Vermont was for the year 2020 (United States Bureau of Labor Statistics, 2021). Across all occupations and job sectors (private and public), the statewide average for wages paid was $25.68 per hour. To be conservative in the workplace cost savings analysis, our approach used this wage amount only and excluded the additional financial value of employee benefits for health care, vacation, and so forth that are also paid for by the employer and we also did not also apply a productivity value multiplier factor (e.g., Pauly et al., 2008) to the employee compensation rate.
Statistical Power and Effect Sizes
When expecting a medium effect size, a two-tailed probability level of .05, a repeated measures two-wave model, and a sample size of 830, the level of statistical power (Cohen, 1988) in this study was 0.99. Statistical effect sizes were also calculated for most tests. The Cohen d statistic was obtained for paired t-tests and based on Sawilowsky (2009) were interpreted as: Large size effect if d > 0.80; medium-size effect if d between 0.79 and 0.50; small-size effect if d between 0.49 and 0.20; and trivial size effect if d > 0.20. The partial eta squared (
Results
Part 1: Methodological Issues
Profile of survey sample
Mental health issues were the most common reason why the EAP was used (41%, n = 339). The mental health category included topics of anxiety, depression, trauma, emotional distress, personal stress, and other psychological issues. This was followed by relationship and family issues (36%, n = 296). The relationship category included topics of marriage/romantic, family relationships, children, elders/parents, separation or divorce, illness or grief for a family member. About one in every seven employees used the EAP to address a workplace issue (14%, n = 117). The workplace category included topics of workplace-related stress, conflicts with co-workers and supervisors, job performance issues, harassment, customers, and other work issues. Finally, “other issues” (8%, n = 67) and substance use (less than 2% had alcohol or drug, n = 11) completed the reasons why the EAP was used.
The typical case had used a total of three sessions of contact with the counselor. This rate of use varied slightly by primary clinical issue, F(3,826) = 7.89, p < .001,
Among those with their employer data specified (n = 717), the type of employer where these cases worked was a mix of 42% private sector and 58% public sector (which included 252 cases from public schools; 123 from state government; and 38 from local government municipalities).
Representativeness of survey sample
To examine the representativeness of the survey sample, the profile of the sample who completed the follow-up survey were compared to the profile of the full book of business for the EAP company for the same years of 2019, 2020, and 2021. Data across the entire EAP user population of counseling users were available for the primary reason for use, the number of counseling sessions used per case, age of the user, and the sector where the employee worked (see Table 1). The profile of the EAP clients who voluntarily participated in the follow-up survey was similar on these factors to the full population of users each year. The rank ordering of the six categories of reasons why counseling was needed was the same each year between the study sample and the full population. The average number of sessions per case was 3.0 in the survey sample and slightly lower at 2.6 in the full book of business. The mix of employer sector among EAP cases in the study was 42% private and 58% public (in 2020 and 2021), which was the same as the average of 43% public and 57% private in the book of business for all 3 years. The average EAP counseling case was 45 years old in the full book of business. Client gender and race were not recorded for any EAP users, but nonetheless, these client attributes were expected to reflect the statewide demographic averages (i.e., an even mix of males and females and over 90% White race).
Profile of Clinical Utilization and Operational Delivery Factors for Survey Sample vs. Population at EAP Business: By Year.

Note. Public sector employers included state government, local municipalities, and schools.
NA = not available; M = mean average.
Psychometric reliability and validity of outcome measures
Other than the mental health risk measures, our outcome measures were all single items and thus we could not calculate an internal reliability assessment of how consistently the questions on a multi-item scale were answered. However, there was some consistency within-person for the outcome measures when examined in the total sample of EAP users as correlations of scores at Pre-R and Post were all significant (diagonal of the top part of Table 2). In addition, the different outcome measures were significantly correlated with each other in expected directions (see the top of Table 2). More specifically, depression and anxiety were positively correlated with each other; and general health, life satisfaction, and work productivity were all positively correlated with each other; and the levels of depression and anxiety were both inversely associated with levels of general health, life satisfaction, and work. These findings provide evidence for the convergent form of measurement validity (DeVellis & Thorpe, 2021), as the measures had some shared variance in conceptually expected relationships.
Correlations Between Outcome Measures at Pre-R and Context Variables.

Note. N = 830. Pre-R indicates retrospective assessment of outcome for the period before EAP use collected at the same point as Post at 1 to 2 months after use. Correlations on diagonal in the first matrix are paired r within-person tests of Pre rating with Post rating. Employer coded as: 1 = public sector, 0 = private sector. Year coded as 2019, 2020, and 2021. Month coded as 1 to 12. COVID-19 coded as 1 = yes, 0 = no.
Higher score indicates a better outcome. For other items, a higher score indicates a worse outcome.
p < .05.
Also important are the findings (see the lower part of Table 2) that the five outcome measures were not correlated with conceptually unrelated factors of the employer market sector, the year of use, or the month when EAP use started. These results provide evidence for the discriminant form of measurement reliability for the outcomes (DeVellis & Thorpe, 2021). Together, these correlational results indicate that the outcome measures used in this study were answered in ways that support the conceptual relationships intended for each outcome. This gives us confidence in interpreting the primary results presented next involving the outcome measures.
Part 2: Comparison of Risk Profiles for EAP Cases to Employee Norms
The profile of the counseling cases at the period just before starting treatment was compared against other normative data (see Table 3). The tests assumed the norm group had the same sample size as the EAP group (both N = 830) with degrees of freedom 1 and 1,660. The results of chi-square tests for comparisons revealed a pattern of differences such that the counseling cases were more at risk than the average adult in the same state or nationally. Each test was highly significant (p < .001). Specifically, the study sample had more cases at-risk than the averages of the normative data on anxiety (58% > 8%; χ2 = 469.59), depression (42% > 9%; χ2 = 237.81), life satisfaction (43% > 14%; χ2 = 171.73), health status (33% > 14%; χ2 = 83.67), and work productivity (44% > 34%; χ2 = 17.44). The average number of risks (of the five possible) per person was also significantly greater in the EAP cases than in the norms, 2.2 versus 0.8, respectively (t = 24.43, df = 1,659). In summary, on each measure, more of the EAP counseling cases were at-risk than in an external sample of typical “healthy” workers (see Figure Set 1). This profile indicates elevated risk levels among the EAP cases which made them appropriate for a behavioral health intervention.
Comparison of the Percentage of EAP Cases at-Risk at Start of Counseling, 45-Days After Counseling Ended and Normative Levels on Behavioral Health and Work Factors.

Note. Total risks range from 0 to 5. N = 830 for counseling cases. Sample sizes for norms vary.

Norms for typical employee and EAP cases at Pre-R and Post counseling compared on percentage at-risk and on the total number of outcomes at-risk (average per person).
Part 3: Improvement After Counseling
The most important question of whether the counseling was effective in changing these outcomes was answered affirmatively (see Table 4). The results with paired tests of mean scores on each measure (repeated measures ANOVA) found that all five outcomes improved substantially, with large statistical effect sizes for each change. The severity of depression symptoms was reduced by 47%. The severity of anxiety symptoms was reduced by 44%. Life satisfaction was increased by 30%. Work productivity was increased by 15%. Overall health status was improved by 11%.
Tests of Within-Person Change in Mean Scores at Pre-R and Post for Employee Users of Counseling from EAP: By Outcome.

Note. N = 830. Pre-R indicates retrospective assessment of outcome for the period before EAP use collected at the same point as Post at 1 to 2 months after use. M = mean. SD = standard deviation. Repeated measures ANOVA tests.
Other simpler tests compared the percentage of the sample who were at-risk at Pre-R against the percentage of the sample who were at-risk at Post use of counseling (using McNemar nonparametric tests). These results included significant reductions (p < .001) for the percentage of the employees who were at-risk for anxiety (58%–24%), at-risk for depression (42%–14%), were dissatisfied with life overall (43%–20%), had lower than average work productivity (44%–22%), and had “poor” or “fair” health status (33%–13%). These results are also displayed in Figure Set 1.
When combined into a total risk scale (range 0–5), the average number of risks per person was also significantly reduced from 2.20 (SD = 1.65) to 0.93 (SD = 1.29), t(830) = 21.79, p < .001, d = 0.76 medium. Thus, the typical EAP case had over two risks when starting counseling and this total was reduced to less than one risk after counseling. As the counseling process often focused on one primary issue, it was not surprising to find a change of one less risk factor after use. Note that the 0.9 risks per person after EAP use was very close to the 0.8 risks per person in the normative healthy sample. This comparison indicates the post-use level of total risks for the counseling cases was close to that of the average person.
There was also a consistent pattern was a relationship of greater improvement when the employee had experienced a greater number of sessions. The correlation of the total number of sessions or contacts with EAP per case with the extent of improvement in outcomes was positive and significant in all five tests (see middle of Table 5). However, all these correlations were only small size statistical effects.
Correlations of Difference Score Measures of Extent of Change Pre-R to Post with Other Measures.
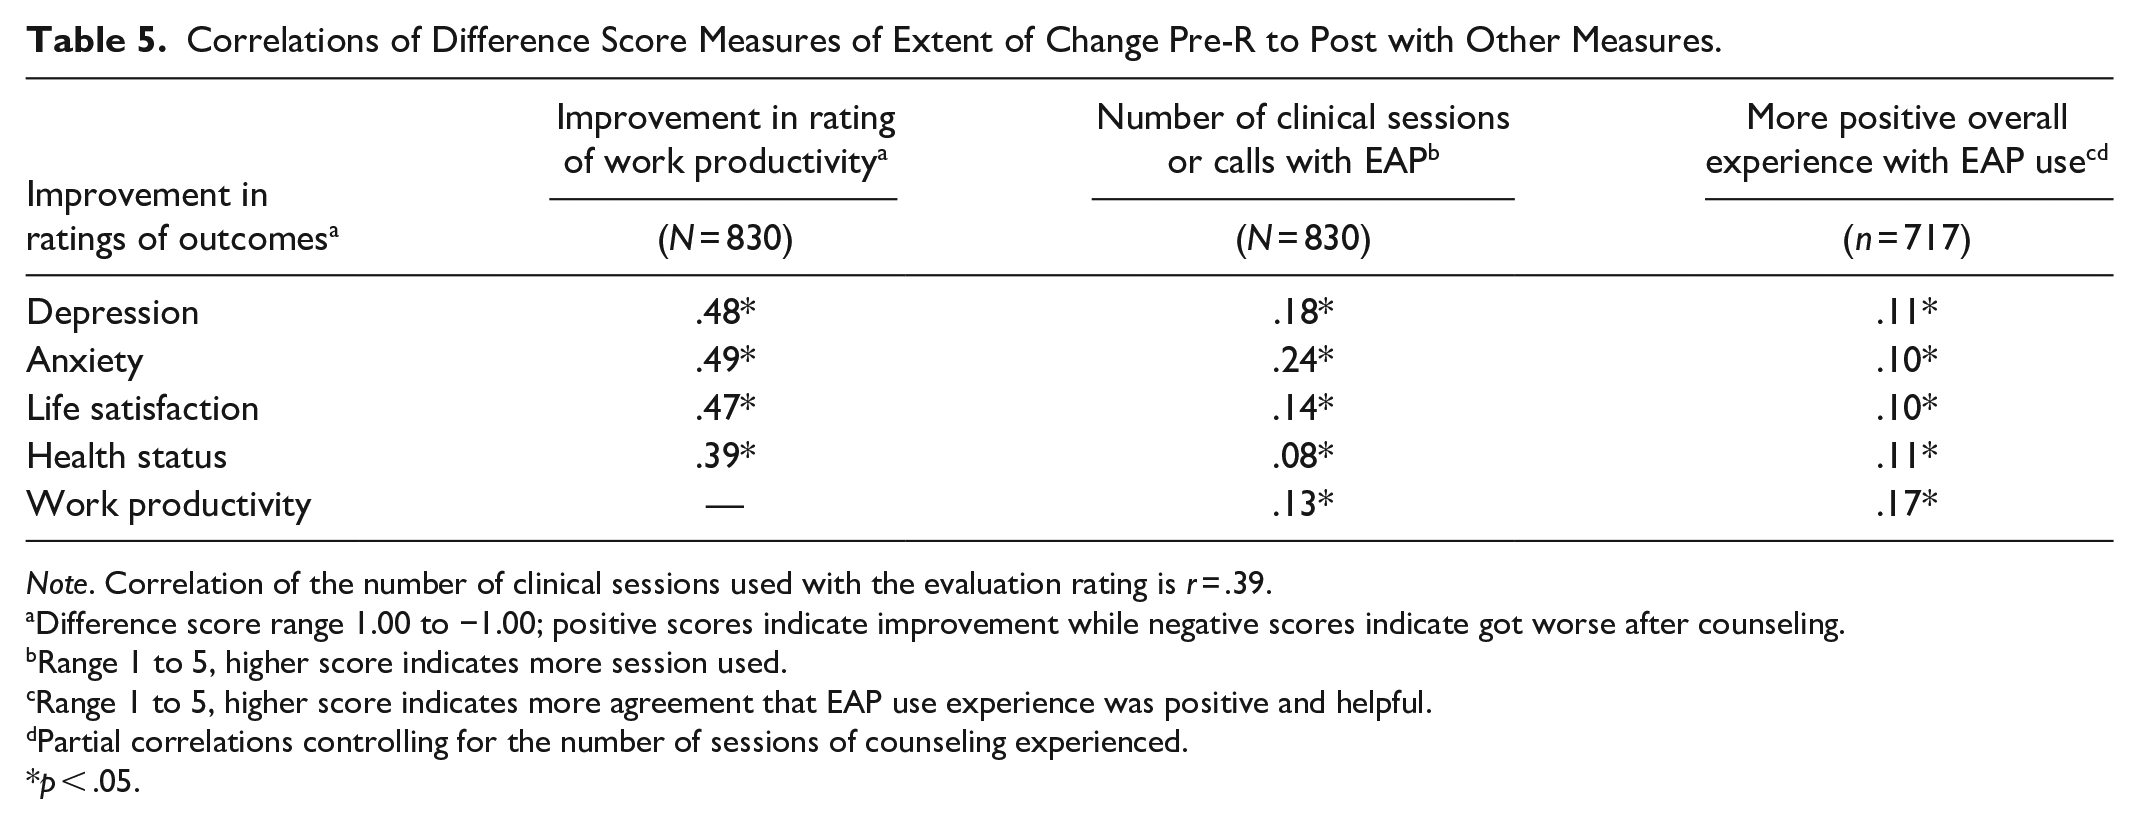
Note. Correlation of the number of clinical sessions used with the evaluation rating is r = .39.
Difference score range 1.00 to −1.00; positive scores indicate improvement while negative scores indicate got worse after counseling.
Range 1 to 5, higher score indicates more session used.
Range 1 to 5, higher score indicates more agreement that EAP use experience was positive and helpful.
Partial correlations controlling for the number of sessions of counseling experienced.
p < .05.
Part 4: Relationship of Health and Work Productivity
As work and health were linked at baseline, we were curious if changes in work productivity after counseling were associated with changes in the other outcomes. The results of correlational tests using the difference scores for each outcome found that improved work productivity after counseling was significantly positively correlated with improvements in each of the other five outcomes after counseling (see the first column in Table 5). Thus, changes in work productivity tended to co-occur in the same direction with changes in each of the other four outcomes.
Part 5: Estimated Cost Savings and ROI
Depression-related health care cost savings
We used an estimation approach for the excess cost burden in health care claims for people with depression. Results indicated there were 350 cases at-risk for depression when starting counseling and 120 cases at-risk at the follow-up (see Table 6). The difference of 230 cases represented the number of people expected to have excess health care costs associated with depression if left untreated. The increased annual health overall health care cost burden for employees with depression (estimated at $2,025/person/year) was applied to the number of cases at-risk in the study sample for depression at Pre and again at Post. The total excess cost burden for depression treatment for the study sample before use was $771,750 before use and $264,600 after use. This difference of $507,150 when divided by the 830 total cases, yielded $611 in depression-related health care treatment costs avoided for the average EAP case in the study (regardless of risk level for depression).
Estimated Cost Savings From Reduction in Rate of Depression and Associated Annual Excess Cost Burden in Overall Health Care Treatment.

Note. N = 830 EAP counseling cases. Pre-R indicates retrospective assessment of outcome for the period before EAP use collected at the same point as Post at 1 to 2 months after use.
Work-related productivity cost savings
The findings linking health outcomes and work productivity may also interest employers because of the indirect costs to the business associated with lost work productivity. Following the methodology used in other research (Stewart et al., 2003; Attridge et al., 2020), the hours of work absence and hours of unproductive time while working were combined into a single measure of lost productive time (LPT; see Table 7). Our survey did not ask about the work schedule or the specific hours of absenteeism at Pre or Post. For step 1, we assumed a standard work month of 160 hours of scheduled work (i.e., 8-hour days at 5/week for a total of 4 weeks/month). For step 2, the hours of work absenteeism experienced per case was estimated from EAP industry norms from over 15,000 EAP cases in the United States (Attridge, 2020b). For step 3, after subtracting the number of hours of absence from the total of 160 hours possible, the remaining hours of worked time were used to calculate how much of the time actually worked was productive and how much was unproductive. The 0 to 10 work productivity ratings (from Table 4) were used in this calculation, first by converting it to a percentage (i.e., multiplied by 10 and then divided by 100) and applying the resulting percentage to the hours worked for the same period.
Estimated Cost Savings from Reduction In Lost Productive Work Time.
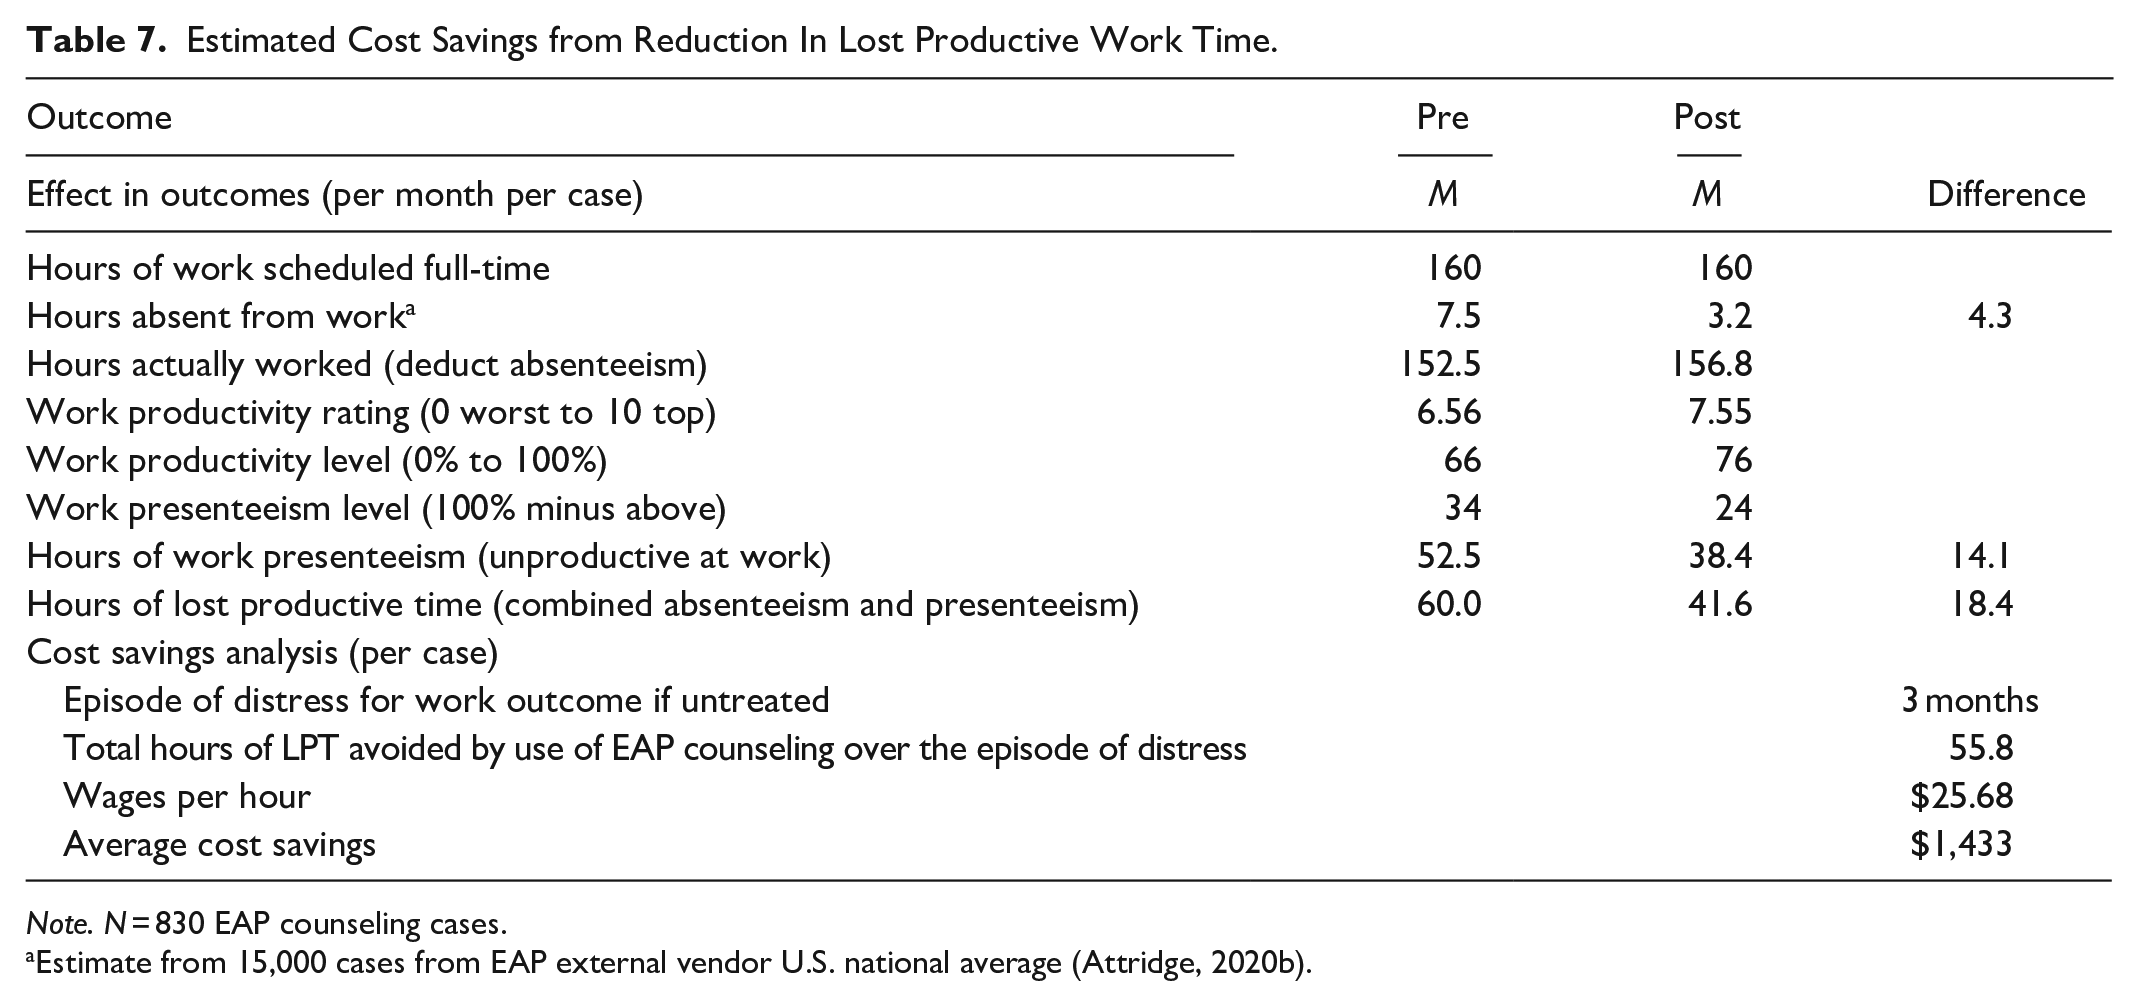
Note. N = 830 EAP counseling cases.
Estimate from 15,000 cases from EAP external vendor U.S. national average (Attridge, 2020b).
This analysis determined that the average employee in this study had an estimated 60 hours of combined absenteeism and presenteeism during the month before starting counseling and 41.6 hours per month after counseling. Thus, the amount of LPT was reduced by 18.4 hours per month after counseling. Note that the vast majority of the lost work time for these counseling cases was from presenteeism losses while at work (87% vs. 13% from absenteeism).
Other research using a similar methodology to calculate LPT indicates that the typical (non-distressed) employee has about 27 hours of lost productive time each month due to health-related issues (see the review of 10 studies in Attridge, 2020b). The implication is that the EAP counseling cases in this study had more than double the LPT of the average employee (60 hours lost for the EAP case > 27 hours lost for the typical employee). For these cases, the choice to seek out assistance from a professional counselor appeared to coincide with a significant deficit in work performance during the month just before starting treatment.
For a more realistic estimate of cost savings, the 1 month period from the raw data was extended over a longer period to better represent how long an at-risk employee who received no treatment for their issue would likely have continued to experience abnormally low work performance and higher than average absence. We chose to use a period of 3 months for this effect. A work loss burden lasting for 3 months had 55.8 total hours of lost work time per case. When the wage rate was applied to each hour of LPT avoided, this effect had estimated cost savings to the employer sponsor of the EAP of $1,433 per counseling case.
Return on investment (ROI)
Some business context is useful to interpret the magnitude of the cost savings. Pricing for EAP services involves many factors, such as the size of the employer, the expected program utilization rate, the mix of counseling, and other non-clinical and organizational level services included for delivery. For example, we will assume it costs an employer about $480 per case to provide the EAP counseling when averaging the operational costs for the entire program divided by a typical number of cases who used the counseling part of the service. With this level of investment, the result for the health care related savings specific to depression is $1.27 in financial return for every $1 invested in the program. The return on investment in workplace related savings is $2.99 in financial return for every $1 invested in the program. The total savings of $2,044 yields an ROI of $4.26:$1.
Part 6: Evaluation of EAP Use Experience
The user experience with the EAP was examined in several ways. First, the results were determined for the single-item rating. Potential moderators for this rating were also examined. Qualitative data from the optional comments also were examined.
Results revealed that 82% of these employees had a favorable evaluation of their experience with using the EAP. More specifically, when asked for their level of agreement with the statement “Overall, my EAP experience was positive and helpful,” of the 717 employees with valid responses, 47% agreed strongly, 35% agreed, 11% were neutral, 4% disagreed, and only 3% strongly disagreed.
Evaluation of the EAP experience was positively associated with the number of sessions of counseling used (r = .39, p < .001), with more favorable ratings associated with greater use. The extent of improvement in each outcome (difference scores from Pre-R to Post were also positively correlated with the experience rating (see results in Table 5), after controlling for the number of sessions used. These findings indicated that the greater the improvement after counseling, the more favorable was the evaluation of the EAP experience. However, these findings were all small effect sizes. Employees with different reasons for using the EAP had similar ratings of their experiences. The context factors of the year of use, month of use, and employer sector also all were unrelated to the evaluation ratings. Most of the tests of moderator effects revealed consistency in how the counseling was experienced.
About one in every five cases (22%; 157 of 717) who answered the evaluation item also provided an optional written comment. Making a comment was not associated with clinical issue type, the number of sessions, or the extent of improvement in outcomes. Comments from the users with a favorable evaluation (19%; 111 of the 593 cases) were useful to share with the counseling staff to reinforce how their clinical work was appreciated by clients. Comments from the users with neutral (22%; 17 of the 78 cases) or with unfavorable ratings (63%; 29 of the 46 cases) were also valuable for ongoing quality control processes at the EAP. See Appendix C for verbatim select examples of the optional written comments from users about their experience with the EAP.
Part 7: COVID-19 Pandemic
Use of EAP counseling before and during the COVID-19 pandemic also was examined for possible differences in how the service was used (type of issue and sessions used per case), overall levels of outcomes, the extent of change after use on all outcomes, and in the evaluation of the experience. Tests determined that the reasons for why the EAP was used (clinical issue) did not differ by pandemic period. The average number of sessions with the EAP per case did not differ by pandemic period (M = 2.91 pre-pandemic vs. M = 3.01 pandemic). The level of initial severity on the five outcomes also did not differ by pandemic period. The extent of improvement after the use of the EAP did not differ between the pandemic groups (difference scores on all five outcomes were uncorrelated with the pandemic period, all r < .06 and non-significant). The level of positive evaluation with EAP use experienced before the pandemic started (86%) was no different than later during the COVID-19 pandemic (82%). Thus, all tests indicated no meaningful differences based on pandemic period conditions.
Discussion
The preliminary psychometric tests indicated that even though only brief measures were used, the five outcomes each had a good enough psychometric profile for reliability and validity. The normative comparison analysis determined that employees who volunteered to use the EAP tended to be at higher risk factors than the typical (non-distressed) employee on all five outcomes. These cases also tended to have a lower than normal level of productivity at work before using the EAP. The tests of outcomes at Pre and Post showed that the use of counseling was associated with improvements in depression, anxiety, life satisfaction, work productivity, and overall health status.
Finding a significant connection between improved health and improved work after counseling replicated the findings from other research (Burton et al., 2006; Lohaus & Habermann, 2019; Mitchell et al., 2013; Morneau Shepell, 2020; Sears et al., 2013). These results are interesting when considering that addressing work problems were the stated goal of the counseling for only 14% of cases. Thus, even though most employees initially sought out counseling for help with a non-work issue (such as mental health or family), their level of work productivity was also restored as their other health or personal issue improved. A practical implication is that restoring work productivity can happen even when it is not the primary focus of the counseling and thus it is important to have EAP that is of high enough quality to produce the positive clinical outcomes that also drive the rebound in work performance.
The exploration of moderators of the extent of improvement yielded only weak or non-significant findings. Thus, the main results appear to be rather robust over various clinical use and delivery context factors. There was a weak relationship of greater improvement when the employee had used more sessions with the EAP counselor. The lack of moderator effects is consistent wither EAP industry research on work productivity and life satisfaction outcomes (Attridge, 2020c). Also of interest was the lack of differences in EAP use, outcomes, and evaluation based on before and during the COVID-19 pandemic.
More than 8 out of every 10 users reported a positive and helpful experience with the EAP. The different clinical issues had similar average ratings when evaluating the service. The evaluation of the service was slightly more positive as more sessions of use were experienced. In addition, the qualitative data revealed comments that described mostly positive experiences with counseling from the individual participants.
Even though we assumed a full-year period for the health care cost savings analysis, untreated mental health conditions can continue on for many years with varying levels of severity and need for treatment in the health care system. Thus, this assumption is conservative at only using 1-year of cost savings. Importantly, additional cost savings associated with additional health risk factors other than depression were not estimated (e.g., anxiety, overall health—both of which improved significantly) and thus these cost savings could have been much higher if more risks were included in the analysis (even when taking into consideration the comorbidity with chronic conditions; see Davenport et al., 2020).
Using only a 3-month episode of effect for the workplace cost savings when an employee is in distress but untreated was an even more conservative effect period. Current best practices in estimating the ROI for EAP counseling on workplace costs also use the same 3 month period (Attridge et al., 2020; Chestnut Global Partners & Disease Management Strategy Group, 2015). Not all EAPs are as conservative in this regard. For example, the largest EAP in Canada assumes a 6-month episode of distress for their workplace savings estimates (Morneau Shepell, 2014) and many other EAPs have used a full year effect period for which workplace cost savings from avoided work absenteeism and presenteeism are added up (ComPsych, 2012; Grow & Ots 2015; United Kingdom Branch of the Employee Assistance Professionals Association, 2019).
Study Limitations
Several limitations of the study are relevant when considering the results. The study sample was from one employee assistance provider with employer clients mostly located in 1 of the 50 states in the country. The mix of reasons for why the EAP was used and the number of counseling sessions per case, however, were both consistent with data from other EAP studies (Attridge, 2020b). Regarding the survey response rate, typically in this industry about 1 in every 10 EAP cases participate in follow-up data collection. For example, the average response rate for routine follow-up surveys was 8% across 45 different EAP vendors (Attridge et al., 2013). Our survey response rate of 13% compares quite favorably. The study sample also was shown to be similar to the overall book of business profile at the EAP.
More in-depth clinical assessments of the health risks or employer records for work absence and productivity could have provided a more accurate measurements than our reliance on self-report measures. However, there is literature supporting the general validity of brief self-report measures of health risks (Bjorner et al., 2005; Kroenke et al., 2003; Magasi, et al., 2011; Martin et al., 2006) and work performance measures (Jenkins, 2014; Kessler et al., 2003; Mitchell & Bates, 2011; Smith et al., 2009, 2010).
The study design did not assess outcomes at the start of each case. A retrospective approach for collecting ratings of outcomes experienced during the Pre period has been used by other EAP vendors (Attridge, 2016; Morneau Shepell, 2014; Riedel & Attridge, 2000). The findings from other EAPs that collected data at the start of the case and again at a follow-up (i.e., a true Pre Post longitudinal design) provide a useful comparison to examine if our use of retrospective method biased the results. The Australian EAP vendor Davidson Trahaire Corpsych asked their clients about work performance in the past month using a 0 to 100 scale, with 100 defined as “their own optimal level.” They found average scores of 60 at the start of treatment and scores of 75 at the follow-up (based on 16,808 total cases between years 2001 and 2015; summarized in Attridge, 2016). When converted to a 0 to 10 score range, their findings were 6.0 at Pre and 7.5 at Post use of EAP counseling. In another example of over 35,000 cases representing 38 different EAPs, the average scores on a 0 to 10 scale of the level of work productivity were 6.2 at Pre and 7.8 at Post use several months later (Attridge, 2020b). Thus, our use of a retrospective reporting of the before use period (work productivity level at 5.6) was slightly lower than what other EAP studies have found using much larger samples of cases and a true Pre period assessment (i.e., 6.0 and 6.2). Yet, the Post use average rating of work productivity in our study of 7.6 was very similar to both of the other examples cited (i.e., 7.5 and 7.8).
Our study obviously lacked a control group that had non-users of EAP counseling matched on level of clinical distress. Thus, it is unknown how much the outcomes would have changed over time without the EAP intervention. However—to be fair—applied research conducted on EAPs businesses have never (to our knowledge) used a true experimental prospective study design to test outcomes because employers who provide the EAP as a benefit available to all employees will not allow some employees (for purposes of a research study) to be denied or delayed access to the EAP when requesting such assistance (Attridge, 2001). Some insight, however, is provided by the two quasi-experimental prospective studies on EAP counseling that included a non-randomized comparison group of employees who did not use EAP counseling but who were matched with the profile of the EAP cases for the level of clinical distress and demographic factors (Milot, 2019; Richmond et al., 2015, 2016). Both of these research projects found superior improvement over time for the users of EAP counseling compared to the matched non-users, in outcomes in both mental health and work domains. By extension, it is reasonable to conclude that our EAP counseling intervention also contributed to the outcomes achieved. But just how much impact the counseling had is difficult to determine. For this reason, our estimated ROI analysis results, while positive at about 4:1, should be taken only as a starting point for discussion and to guide more careful cost-benefit analyses in the future.
In conclusion, this study provides empirical evidence from 830 employees in a real-world context of the effectiveness of brief counseling on clinical and work outcomes and their related potential cost savings to the employer purchaser of EAP services.
Footnotes
Appendix A
Appendix B
Appendix C
Acknowledgements
The authors would also like to Dawn Holbrook of Invest EAP Centers for Well-being.
Declaration of Conflicting Interests
The author(s) declared the following potential conflicts of interest with respect to the research, authorship, and/or publication of this article: Mark Attridge was hired by Invest EAP Centers for Wellbeing to conduct this research project. Steve Dickens is the research director at Invest EAP Centers for Wellbeing.
Funding
The author(s) received no financial support for the research, authorship, and/or publication of this article.
Disclaimer
The contents provided are solely the responsibility of the authors.