
Abstract
In the first wave of the COVID-19 outbreak in China, the epidemic has spread rapidly due to interprovincial migration from Wuhan to Hubei province and to the rest of China. Based on Chinas interprovincial migration and outbreak data, this paper established panel models. The transmission of the first wave of COVID-19 of China can be divided into two stages: a phase of national outbreak caused by interprovincial migration and a phase of sustained development due to close contacts. Interprovincial migration triggered a nationwide outbreak that lasted until around 28 January 2020, about 5 days after the Wuhan lockdown. In this phase of transmission, the population inflow from Hubei province was more contagious than the inflow from other provinces. The results also show that the sum of the influence coefficients of interprovincial population inflow is less than 1, which means a state of convergence, indicating that “Wuhan lockdown” is an effective measure to cut off the spread of the epidemic by interprovincial migration.
Introduction
In December 2019, Wuhan (China) reported the discovery of pneumonia of unknown cause (2020), which subsequently named COVID-19 by WHO on February 11, 2020. In 20 January 2020, National Health Commission of the People’s Republic of China alerted that COVID-19 cases were confirmed in Shanghai, Beijing, and so on. COVID-19 were rapidly breaking out in Mainland China.
In 2020, there were seven waves of COVID-19 in Mainland China and the first wave was started in Wuhan, said by Zunyou Wu, a chief epidemiologist of Chinese Center for Disease Control and Prevention. The spatiality of infectious disease has three key areas: mobility and demographic change, infrastructure, and governance (Connolly et al., 2021). At the beginning of the COVID-19 outbreak, due to the lack of knowledge of the virus, there was a certain time gap in the prevention and control of the epidemic. Population movement was the important trigger of the COVID-19 infection transmission in China (Ai et al., 2020; Liu et al., 2020).
The first study on COVID-19(although it was not yet named COVID-19 that time) published online in The Lancet on 24 January 2020, looked at 41 patients with pneumonia of unknown cause, but did not identify the source of infection or the route of transmission (C. Huang et al., 2020). On 20 January 2020, Zhong Nanshan, the chief expert in respiratory medicine and head of the COVID-19 investigation team, told the public through state media that COVID-19 has the characteristics of person-to-person transmission, later the research team officially published the results in The Lancet (Chan et al., 2020). Scholars used SEIR model and improved SEIR model to analyze important information such as the incubation time of COVID-19 infection, the number of rebirths, and the inflection point of the epidemic (Fan et al., 2020; Huang et al., 2020; Pang et al., 2020), increased understanding of the COVID-19 virus.
COVID-19’s person-to-person transmission and average incubation period of 7 to 14 days (Bai et al., 2020; Fan et al., 2020; Pang et al., 2020) are important reasons for the outbreak. Wuhan’s geographical location and the timing of the outbreak are also important reasons for the pandemic. Wuhan is provincial capital of Hubei Province, with a permanent population of more than 11 million, accounting for more than 20% of Hubei province, the economic and transportation center of Hubei, as well as the transportation artery of central China. The government was not aware of the outbreak at the beginning and did not take relevant measures to prevent it. The above reasons have contributed to the rapid spread of the first wave of COVID-19 in Mainland China. Jia et al. (2020) used mobile phone geographic location data to calculate the total population movement, tracked the population movement from Wuhan to other regions on 24 January 2020, and predicted the subsequent location, intensity, and time of the outbreak in other regions of Mainland China on 19 February 2020. Zhang et al. (2020) investigated the factors affecting the number of imported cases in Wuhan, as well as the speed and mode of the epidemic spread. Flights and high-speed rail flights outside Wuhan were significantly correlated with the number of COVID-19 cases in the destination city (Zhang et al., 2020). R. Huang et al. (2020) found that COVID-19 infection was spatially dependent by applying Moran index to the space panel, and spreads mainly from Hubei Province in central China to surrounding areas. Studies have shown the impact of population outflows from explosive sites on the spread of COVID-19.
According to the characteristics of transmission, the first wave of COVID-19 transmission in China can be divided into two stages: transmission dominated by population migration and subsequent transmission dominated by close contact. Because the route of transmission was not clear at the beginning of the COVID-19 outbreak, and there were no prevention measures for contact and movement of people, the outflow of people from Wuhan and Hubei province led to the COVID-19 pandemic in China. To what extent does the scale of interprovincial migration influence the spread of COVID-19? The seventh National Population Census of China records 63.89% of Chinese 1.4 billion people live in cities. It is of great significance for the subsequent prevention and control of COVID-19 to clear the impact of interprovincial migration on the large-scale spread of COVID-19.
Data, Descriptive Statistics, and Model
Data
This study focused on the impact of the scale of interprovincial migration on the spread of the first wave of COVID-19 in China, using migration indices from the Baidu Migration platform and the number of newly confirmed cases in each province published by the government. We collected data from 16 January to 25 March 2020, when there were no more confirmed cases in most provinces.
Population migration data
We obtain within-city mobility intensity, inflow index, and outflow index to measure population migration from Baidu Migration, a travel map offered by the largest Chinese search engine, Baidu. Baidu Migration uses Baidu Maps Location Based Service (LBS) open platform and Baidu Tianyan, which has a market share of more than 70% in Mainland China with more than 500 million users, to calculate and analyze the LBS data, and provides visual presentation to show the trajectory and characteristics of the population migration. Baidu migration data covers 961 pairs of inter-provincial flow data in 31 provinces (including four municipalities) in China, in the form of index. According to the calculation of existing research (Fang et al., 2020), one unit of the within-city mobility represents the flow within the city of about 2,182,264 people, and one unit of the inflow index or outflow index means the flow between provinces of about 218,264 people.
Outbreak data
COVID-19 daily cases are collected from web of National Health Commission of the Peoples Republic of China, which updates confirmed, dead, and recovered cases daily. On 20 January 2020, confirmed cases were reported outside Hubei province. This paper collected epidemic data of 31 provinces (including four municipalities) since the release of the data. Because of concern for the interprovincial migration, Hubei and Tibet were not analyzed, and the remaining 29 provinces were analyzed for the transmission impact of COVID-19 due to population mobility.
The selection of indicators is based on the three factors of spatial transmission of multiple infectious diseases: mobility and demographic change, infrastructure, and governance (Connolly et al., 2021). In this study, only the scale of population movement and the number of newly confirmed cases were selected, mainly for the following reasons: the virus did not mutate during the analysis period, and its transmissibility was consistent; after the lockdown of Wuhan on 23 January 2020, the Mainland China implemented a series of preventive and control measures, such as home quarantine for 14 days, wearing masks when going out and sterilizing public places. In the interprovincial transmission of COVID-19, there were differences in mobility, both in outflow and inflow scale. Moreover, the spread of the epidemic was based on the premise that COVID-19 is already confirmed in the outflow region, which was the result of the interaction between the inflow scale and the confirmed disease in the outflow region, and there was a certain lag. Therefore, only the inflow scale and the disease situation in the outflow area were considered in the selection of indicators to establish the influence model on the new confirmed cases in the inflow area.
Descriptive Statistics
Mobility is an important factor in the spread of COVID-19. From the perspective of distance, the flow of people can be divided into three levels: within-city, intra-provincial, and interprovincial. The first wave of the epidemic spread through two ways: from Wuhan to Hubei province, and then from Hubei to other regions; Wuhan spread directly outside Hubei province. We concerned about the early stages of rapid transmission of COVID-19, but it is difficult to exactly forecast when the rapid transmission phase will occur. In the section of sample description and statistics, referring to the 7-day incubation period published by experts from the national health commission, the time of sample description and statistics was determined to be January 16, solstice and January 30, 2020, including 29 provinces except Hubei and Tibet, and the maximum four periods of lag were selected to display for description of lag period (see Table 1).
Variable Description Statistics.

Note. Hi,t represents the number of newly confirmed cases in each province. flowh represents the population inflow from Hubei province. flowj represents the population inflow from other provinces (except Hubei and Tibet). within_city represents the intensity of movement within city for all cities in the province. The sample description is from 16 to 30 January 2020, including 29 provinces (except Hubei province and Tibet).
The spread of COVID-19 by population mobility in Wuhan can view from three aspects: intensity of population travel within the city, outflow from Wuhan, and outflow from Hubei Province. Before January 19, Wuhans within-city travel intensity (Figure 1) was stable on weekdays and low on weekends. At that time, the transmission route and impact of the virus were unknown. The public has not received the information of the clear route of transmission, and therefore has not had an impact on migration.

Daily within-city mobility intensity of Wuhan.
On 18 January 2020, Academician Zhong Nanshan went to Wuhan, indicating that the situation of the epidemic was not optimistic even serious. Since then, people realized the seriousness of the situation and left Wuhan in large numbers. After January 19, the within-city mobility intensity in Wuhan decreased sharply, and the scale of outflow on January 23 (Figure 2) significantly increased, nearly twice the scale of outflow on January 16. Some of the people who left Wuhan went to other parts of Hubei province, and some left Hubei. At the same time, the COVID-19 virus has spread widely.
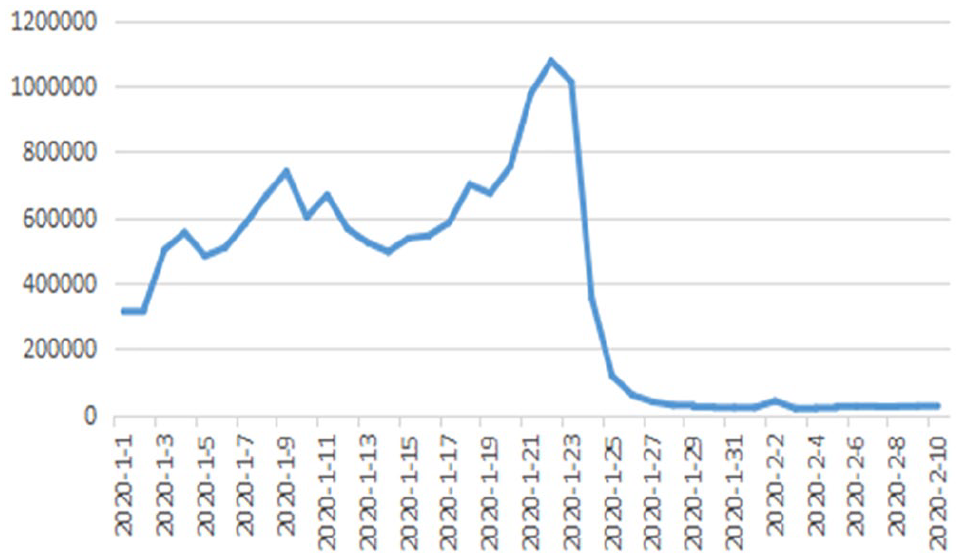
Population size of Wuhan outflow.
From 1 to 20 January 2020, the population outflow Wuhan was basically stable, with 60% to 70% flowing to other cities in Hubei province (Figure 3), resulting in the subsequent outbreak of severe epidemic in other cities in Hubei province. After the lockdown of Wuhan at 10:00 on 23 January 2020, the outward transmission path of COVID-19 in Wuhan was cut off. The within-city mobility intensity and the scale of outflow in Wuhan were rapidly decreasing and kept at a low level (Figure 2).

The proportion of the outflow from Wuhan to Hubei Province.
The number of new patients in each province, the scale of the migration of Hubei province moving to other provinces, and the population size of the migration to other provinces except Hubei province are all significantly different. According to Fang et al.’s (2020) estimation of the scale of emigration and emigration in Baidus migration platform, one unit is converted into 90,848 people. For Hubei province, between January 16 and January 30, the population size of people moving to other provinces is estimated to be at least 13 and at most 166,589, while the outflow of Wuhan mainly flows to Hubei province. During the calculation period, the correlation coefficient between the scale of migration in other provinces and the scale of migration in Hubei province and the number of newly comfirmed patients was .6049 and .3615, respectively, showing a moderate correlation. The correlation coefficient between the intensity of urban travel and the number of newly diagnosed patients was −.1271, showing a weak negative correlation.
Model
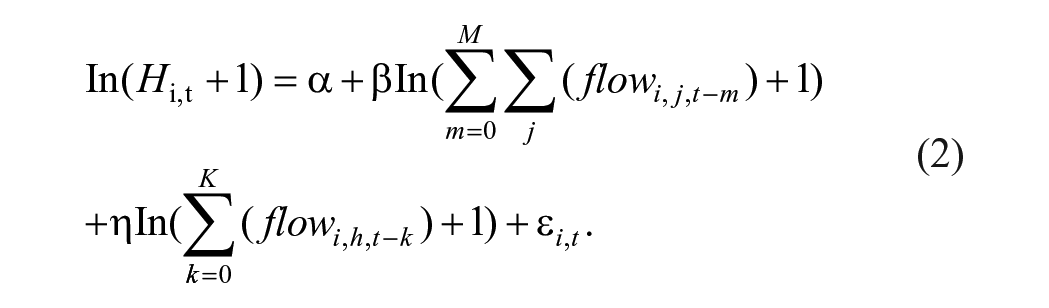
From the perspective of inter-provincial mobility, the daily comfirmed cases are affected by two aspects, the patient condition of the outflow place and the scale of influx. Noting the significant difference in the epidemic situation between Hubei province and other provinces, the outflow place were divided into Hubei province and other provinces. The epidemic situation determines the base of virus transmission during population migration, which is carried out by the floating population as carrier. The larger the population movement, the more likely it is to spread the virus. Thus, both the level of infection in the destination and the size of the influx influence the spread of the epidemic in the destination. Due to the presence of an incubation period, the movement of anyone carrying the virus causes transmission of the virus. The focus here is not on the length of the incubation period for COVID-19, but on the lag period which can be better used for prediction and estimation. For the above reasons, the model is set as follows:

where i, j, and t, respectively, index the destination province, origination province (outside of Hubei Province), and date. h stands for Hubei province;
Model (1) considering the influence of both inflow scale and the number of new patients in the place of outflow. Can inflow scale as a single explanatory variable, better explain the number of new patients? Therefore, a model (2) was established for comparative analysis with model (1) which considered the inflow scale as an explanatory variable. We still distinguish between the inflow of Hubei province and other provinces.
The inflow scale and value of other provinces with a lag of M days are denoted as
From the perspective of the scope of human movement and administrative division, in addition to the inter-provincial level, the spread of the virus also exists in the local activities of the destination after the inflow, which may be affected by the intensity of travel within the city. In order to match the provincial data, the urban travel intensity of each city within the province is summed up, which is taken as the explanatory variable of the urban travel intensity within the province, abbreviated as In within city.
urban travel intensity is added to model (1) to obtain model (3) for comparison with the basic model.

Results of Empirical Analysis
In the first wave of COVID-19, which is dominated by the flow of people, the time length of the data is less than the number of provinces, so it belongs to the short panel. Then we adopt the analysis method of the short panel. Firstly, model (1) was used to analyze the impact of mobility on COVID-19 transmission. Secondly, the results are compared with the model (2) which only takes the scale of mobility as the explanatory variable. Thirdly, using model (3) which added the index of within-city travel intensity on the basis model (1) to illustrate the fitting effect of model (1) through comparative analysis.
Comprehensive Impact Analysis of Population Inflow
In this part of the analysis, we need to determine three time parameters: one is the deadline of the transmission stage dominated by population migration, and the lag time of the two explanatory variables respectively. The three temporal parameters involved here need to be identified in an optimal combination to account for the impact of population mobility on the timing of COVID-19 transmission. In this paper, the different combinations of the three time parameters in all cases of the explanatory variable from no lag period to 5 lag period and the stage boundary time was selected as 23 January to 2 February 2020 were, respectively, and the Hausmann test was conducted. According to the results of Hausmann test, the null hypothesis is rejected and the fixed effect model should be selected. Since R2 is an important index to determine the goodness of model fitting. The results of this paper show part of the regression results with R2 greater than 60%. The regression results of the two explanatory variables with the same lag period are better than those of different lag periods, and the optimal results are shown in Table 2.
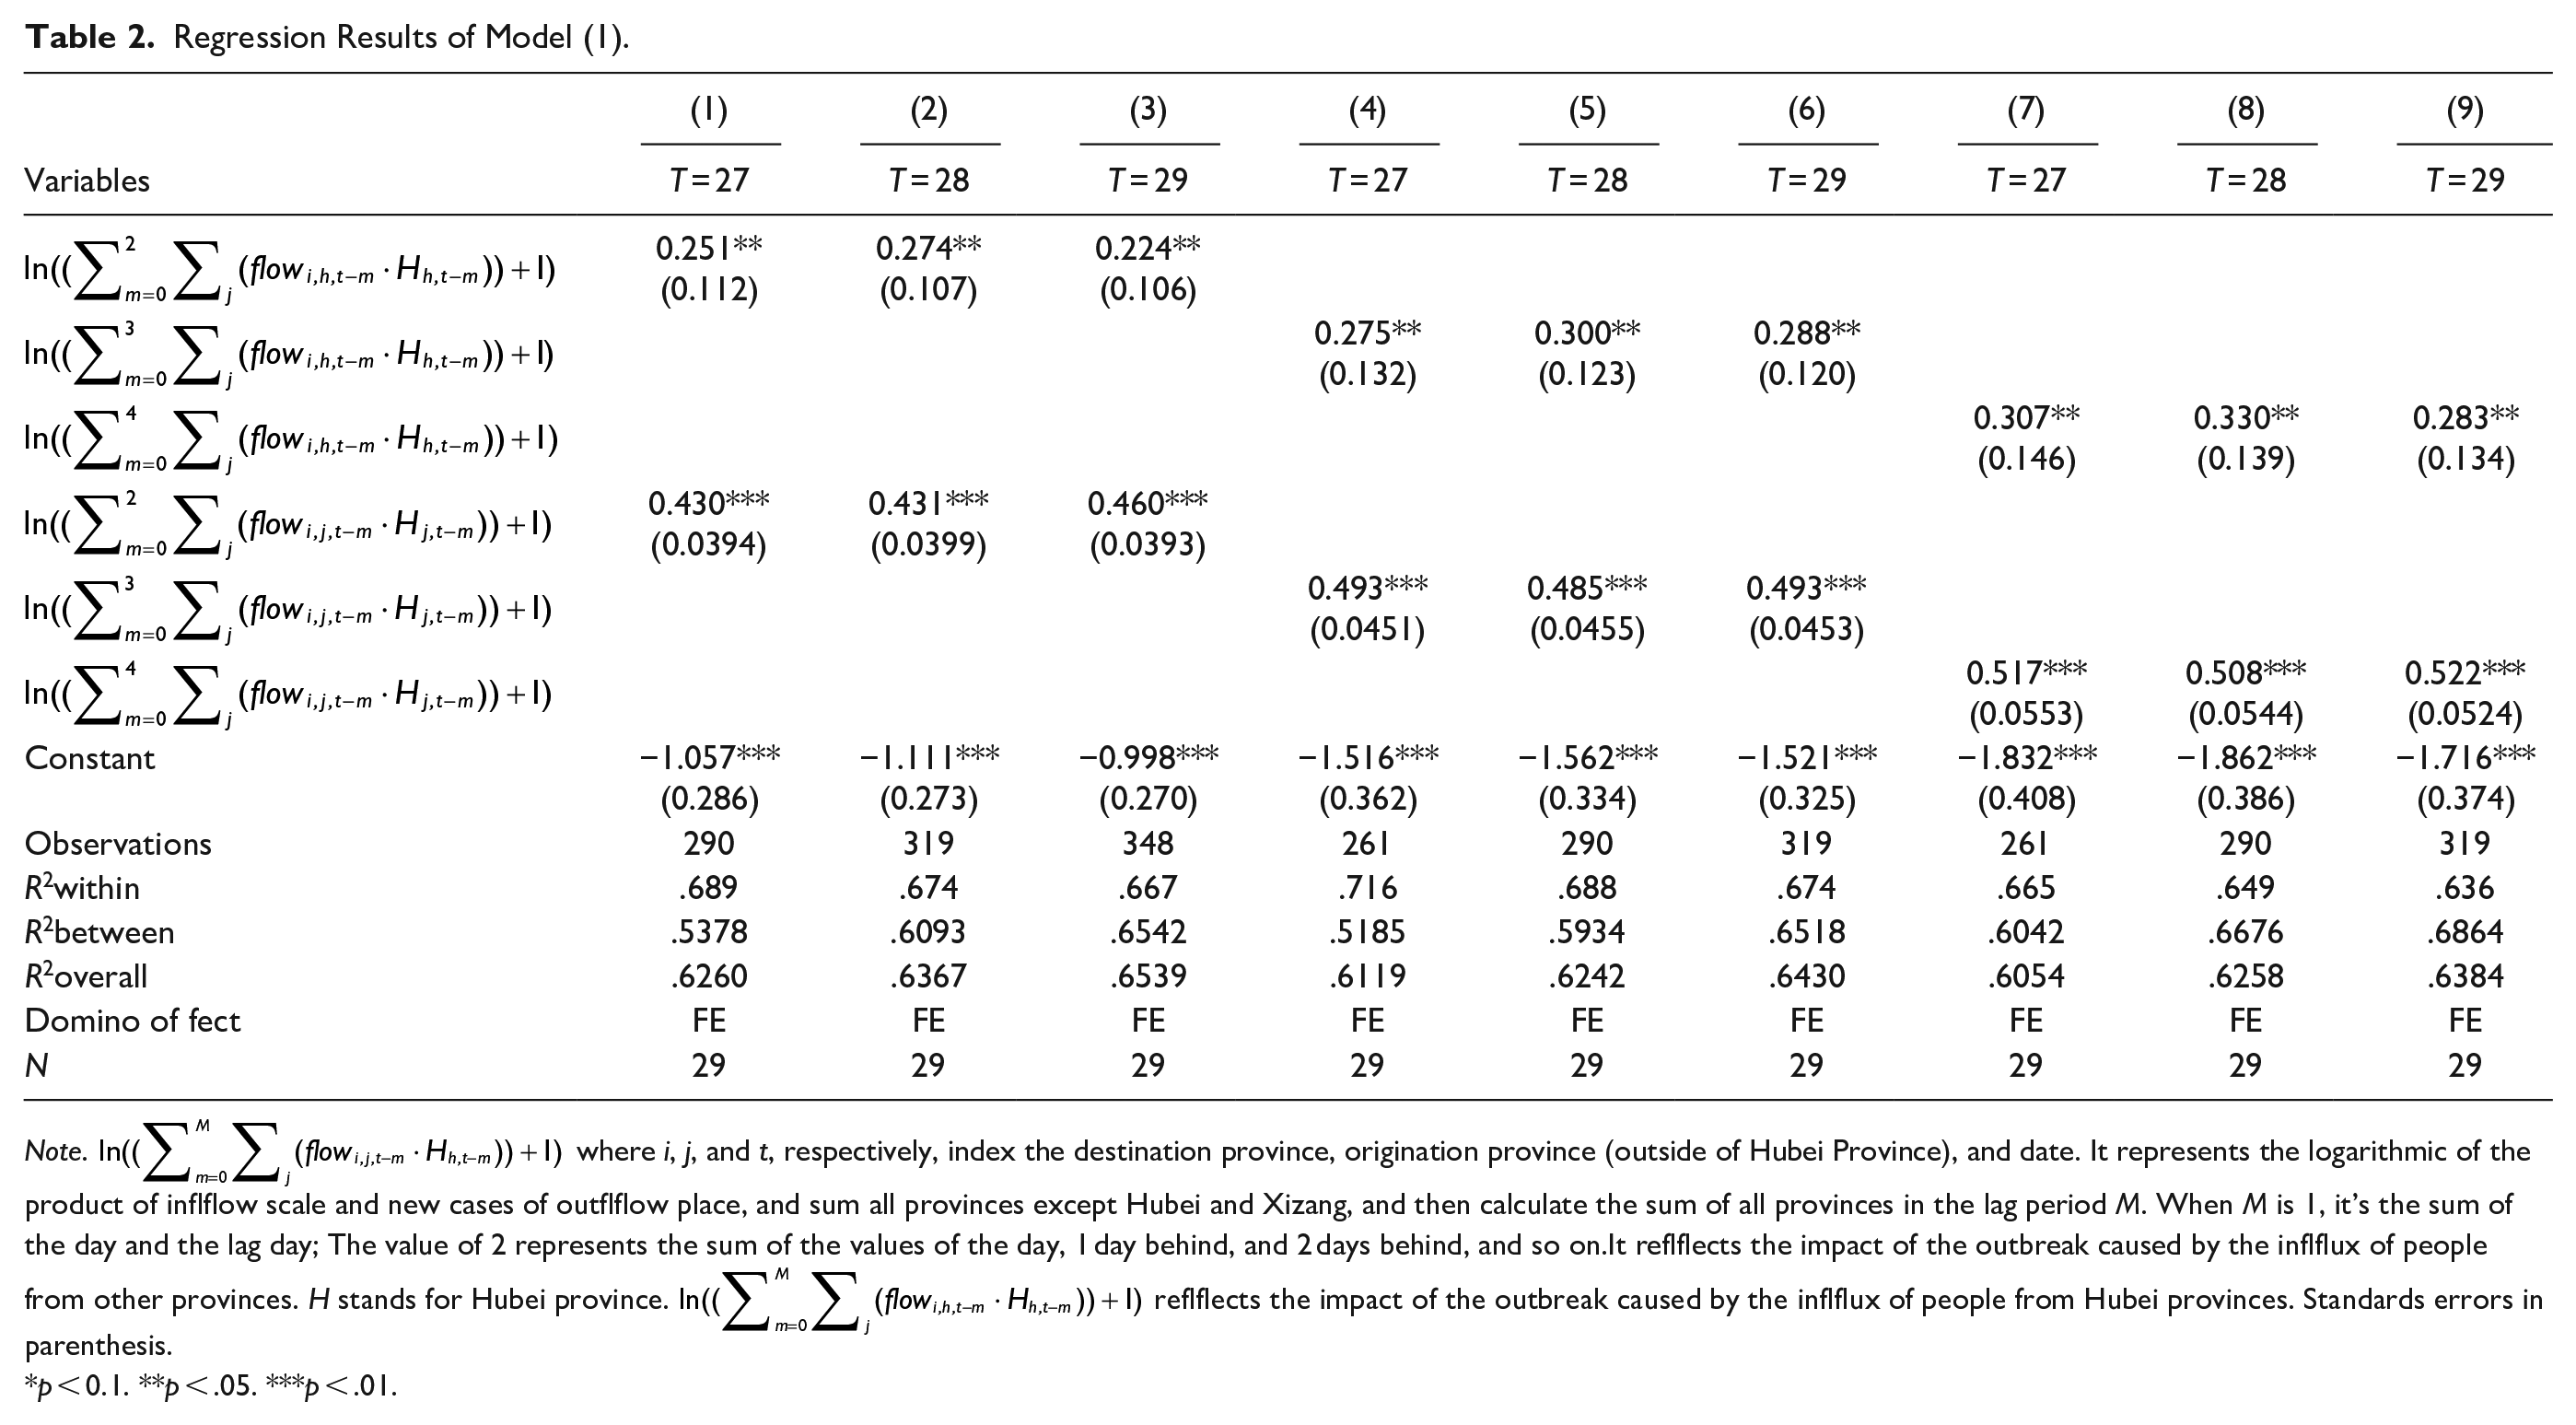
Regression Results of Model (1).
Note.
p < 0.1. **p < .05. ***p < .01.
The modeling results were analyzed from the aspects of the boundary time of the propagation stage, the stability of the results, and the main results:
(1) Determination of the boundary date of the two phases of the epidemic. The choice of hysteresis refer to the latency period of COVID-19. Different research groups had different results on the latency period of COVID-19: The expert group of National Health Commission said that the incubation period of COVID-19 is about 7 days; Lin Huazhen team’s results show that the latent days of Wuhan city is for 6 days, Hubei province for 9 days, other 28 provinces for 6 days; Based on earlier data from Wuhan, Zhou Xiaohua’s team at Peking University estimated the incubation period to be an average of 8.62 days; In most dynamics analysis, the incubation period used for fitting is also about 7 days, which can obtain better fitting results. Judged by significance and goodness of fit, the regression results of this paper showed probability that the cut-off date for the two phases was 27 January to 29. On 23 January 2020, Wuhan city was lockdown. Based on the incubation period of 7 days, the time node of divided two stages was 29 January 2020. The results of data fitting are consistent with the choice of lag stage in other studies.
(2) Goodness of fit. there are more than 200 results due to different combinations of lag and cut-off times. From the value of goodness of fit, the larger R2 is, the stronger the explanatory power of the model is. Compared with different lag combinations, R2 was higher when the two explanatory variables with the same lag period. Lag represents the influence time, and the longer the influence time is, the longer the attention period should be paid and the longer the time should be considered in the actual prevention and control. Due to the panel model adopted in this paper, R2 is decomposed into R2 within a group and R2 between groups. R2 within a group represents the explanatory strength of the model for individual changes in each province, while R2 between groups reflects the explanatory power of the model for differences among provinces.
Table 2 shows the results of the optimal combination among all the results and satisfies that the total R2 is greater than 60%. From the regression results, the explanatory variable selection in a lag period of 2 to 3 days can make the total R2 reach more than 60%, and the value of within-group R2 with interprovincial differences reach more than 50%. The values of R2 within and between groups ranged from 50% to 74% for a total R2 of more than 60%. If the boundary date of the two stages is later, R2 within the group gradually decreases and R2 between the groups gradually increases. The value of within-group R2 greater than 70% appeared on the January 27, and the value of between-groups R2 greater than 70% appeared on the January 30.
(3) Lag combination of explanatory variables. In this paper, there are two explanatory variables, one is the impact of immigrants from Hubei province, the other is the impact of immigrants from other provinces except Hubei province. Among the results of various lag combinations, when the number of delay periods is the same, the goodness of fit of the model is higher than that of different lag combinations under the same time boundary. Therefore, it is more likely to choose to combine the same amount of lag time, and believe that there is no difference in the impact of time migration from different provinces, that is, there is no migration from the region of severe disease impact time longer than elsewhere.
Further, the changes of the combined coefficients of different lag periods were compared, and the results with significant coefficients at the significance level of .05 and total R2 higher than 60% were selected to analyze the changes of the coefficients of the results. The variation of the coefficient can be divided into two types: when the combination of lagged periods is unchanged, the stage boundary date changes; and when the boundary date is unchanged, the lag period of one explanatory variable changes, so as to show the variation trend and stability of the explanatory variable in different lag periods.When the boundary date of the two stages goes backwards, the regression coefficient of the model changes little and the result is more stable.
First of all, we are concerned about the impact of population inflow in Hubei province on the spread of the epidemic, namely the impact coefficient on the number of new cases. When the two stages were demarcated on January 28, Hubei province had the greatest impact coefficient on the inflow, regardless of the number of days of lag. Taking the lag of 2 days as the explanatory variable, see regression result (2; in Table 2), the population inflow in Hubei province increased by 1% within 2 days, resulting in 2.74% increase in the number of newly confirmed cases in the target province. Regression results (5; in Table 2) showed that 1% increase in the population inflow in Hubei province over a 3-day period would increase the number of new confirmed cases in the target province by 3%. Regression results (8; in Table 2) showed that 1% increase in the influx of people from Hubei province over a 4-day period would increase the number of new confirmed cases in the target province by 3.3%. Each additional day of lag increases the impact coefficient by about .3%.
Secondly, we are concerned about whether the inflow of Hubei province has a greater impact on the number of new patients than the inflow of other provinces. From the value of the coefficient, the influence coefficient of the inflow of Hubei province is about 2% smaller than the sum of the inflow of all other provinces. In terms of the absolute number of incoming population, the number of incoming population in Hubei province is far lower than the sum of other provinces. Comparatively speaking, the outgoing population in Hubei province is more powerful to the spread of the epidemic.
Comparison With Inflow Size as Explanatory Variable
To compare the differences between inflow scale as explained variable and interaction effect of inflows scale and the number of patients emigration province as explanatory variable, on the basis of the preliminary analysis, we still divided the inflow scale into Hubei province and other provinces. Panel regression was performed on the logarithm of the number of new patients using the sum value of different lag period as the explanatory variable. The Hausmann test for different combinations shows that the fixed effect model should still be used when the inflow size is the explanatory variable. To facilitate the comparison with the results of the basic model, the regression results are presented based on the cut-off time of the propagation phase on 28 January 2020 (see Table 3).
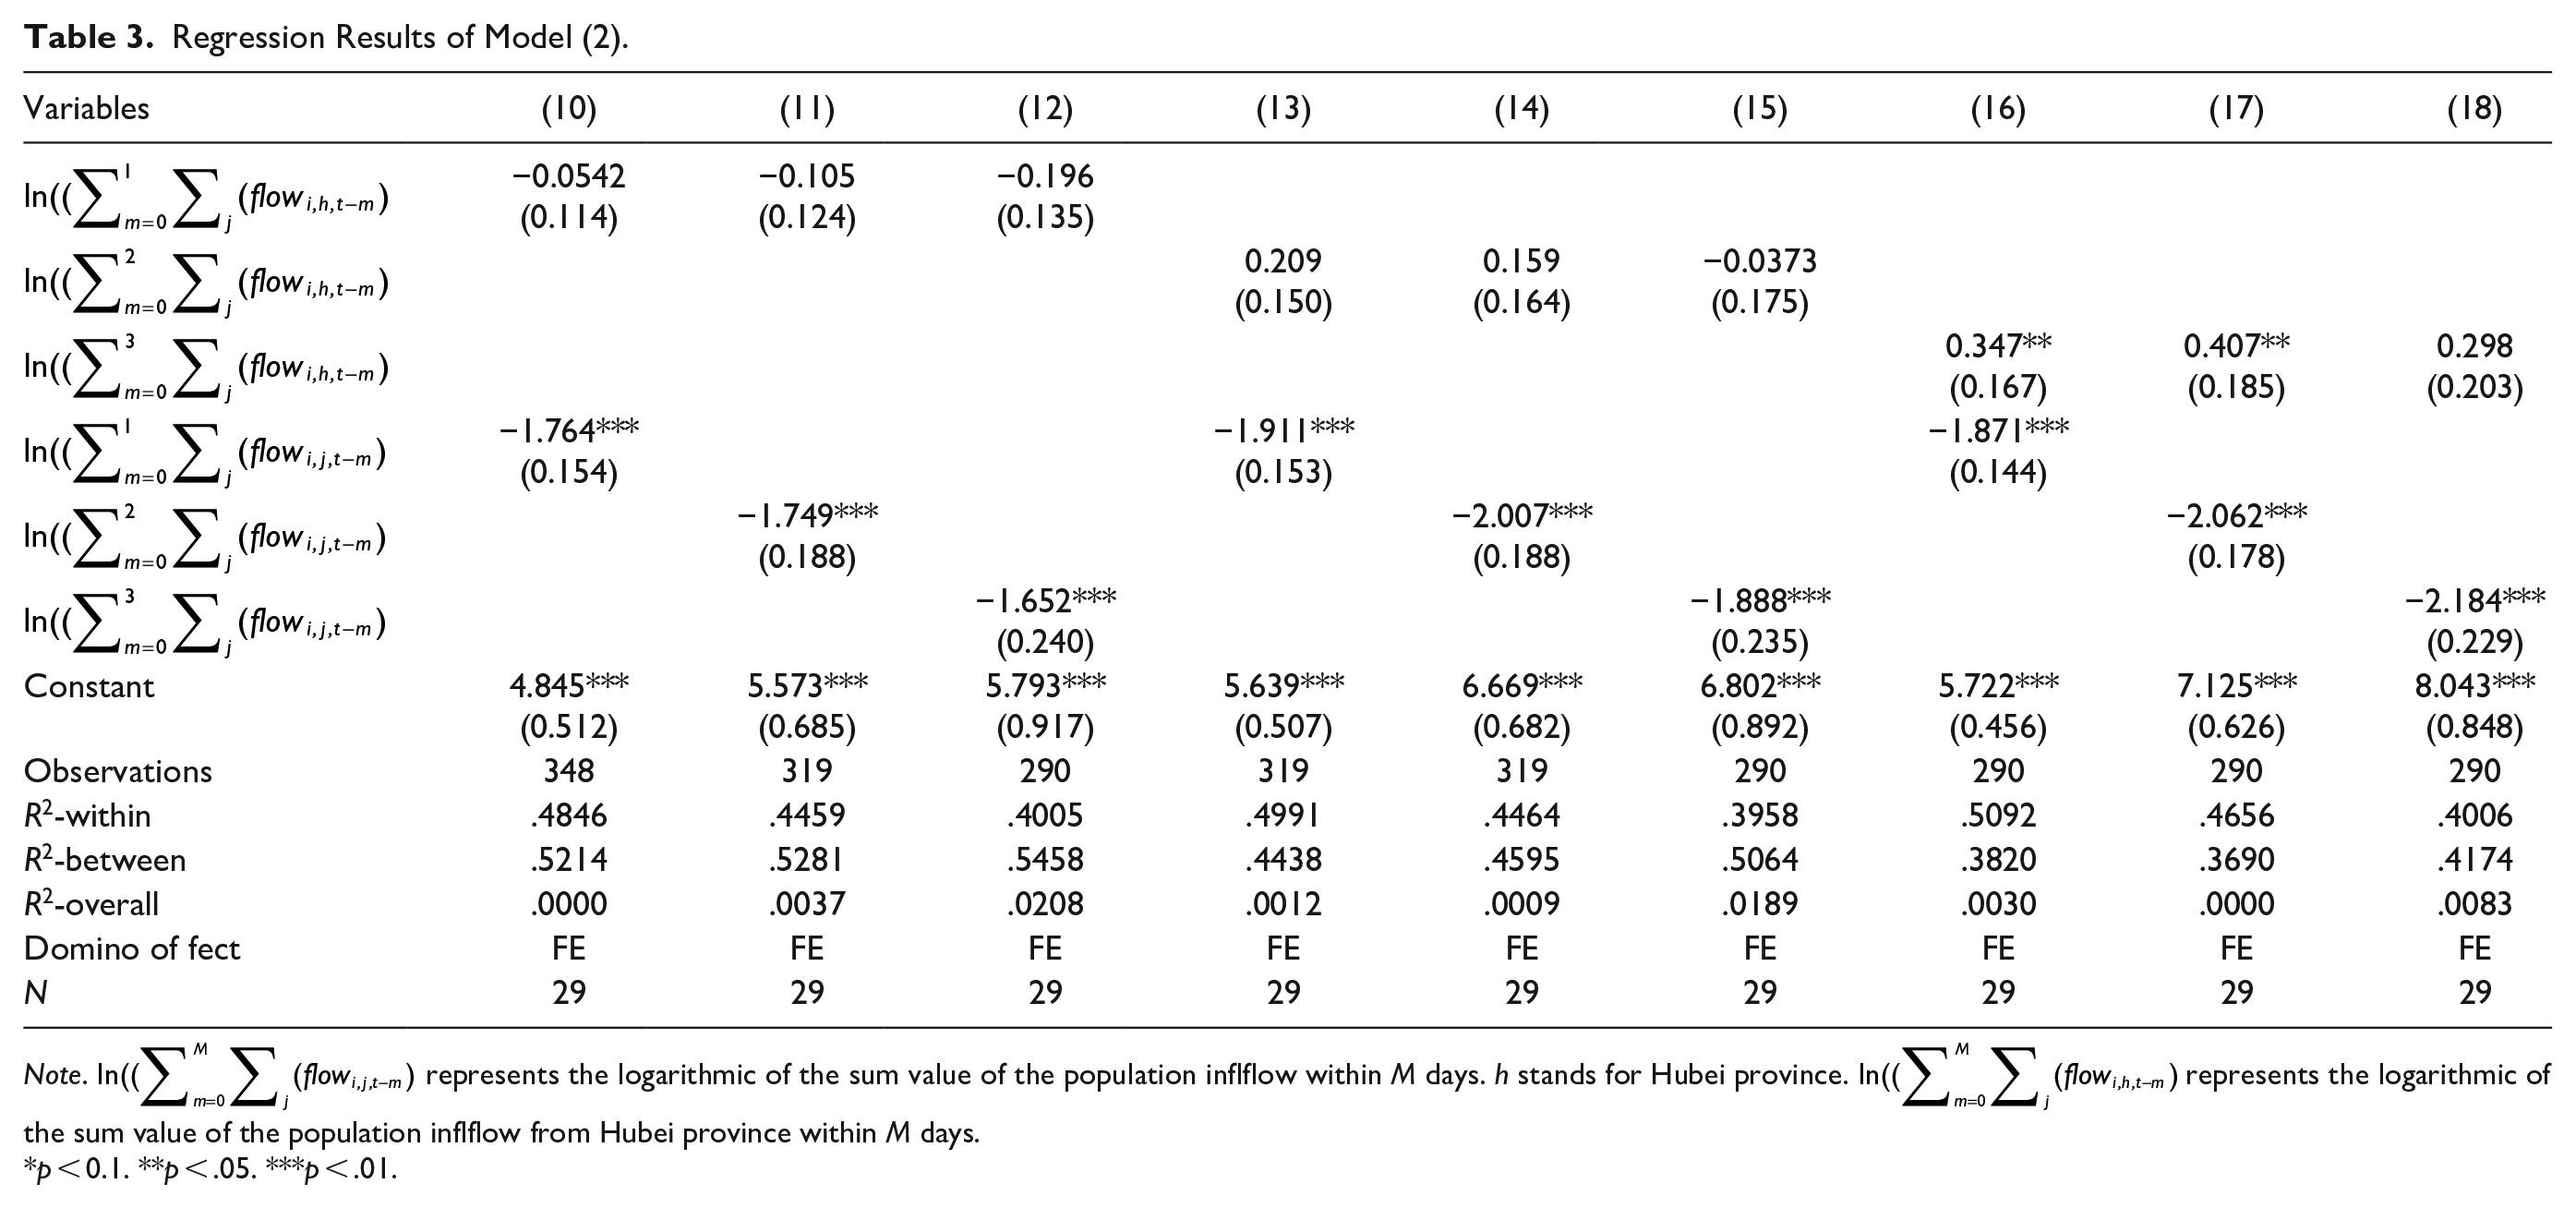
Regression Results of Model (2).
Note.
p < 0.1. **p < .05. ***p < .01.
When the inflow scale was used as the explanatory variable to explain the influence of population mobility on newly confirmed cases, the regression results (10) to (15) and (18) in Table 3) all showed that the regression coefficient of the inflow scale in Hubei province was not significant, while that of other provinces was significant. The inflow scale of Hubei province with a lag of 3 days combined with the inflow scale of other provinces with a lag of 1 or 2 days was also significant in explaining the new confirmed cases ( see the regression results (16) and (17) in Table 3). It is noted that the regression coefficients of the inflow scale of other provinces on the new patients in the inflow provinces are all negative and significant, which is statistically interpreted as having a significant negative impact and inconsistent with the actual situation. In summary, there is a huge deviation in using inflow scale as an explanatory variable for the number of new patients. Therefore, isolation the scale of the mobility scale from the prevalence of disease in the departing provinces does not provide a reasonable explanation for the human-to-human transmission of COVID-19.
Analysis of the Impact of Within-City Population Mobility
Does the intensity of travel within the city significantly increase the number of newly confirmed cases during the first phase of COVID-19 transmission? On the basis of Model (1), urban travel intensity was added as an explanatory variable to obtain model (3). Because the city’s travel has regularity which is highly related to the intensity of each day’s travel, the correlation coefficient of the intensity of travel and lagging days were above 90%, therefore, the travel intensity with a lag of 1 day is selected as the representative of the urban travel intensity for modeling. Table 4 shows the regression results of model (3). Compared with the results in Table 2, it indicates whether there is a significant influence on the intensity of within-city mobility.
The Regression Results of Model (3).

Note.
p < .1. **p < .05. ***p < .01.
Logically, the stronger the intensity of urban travel, the greater the probability of virus transmission, and the influence coefficient on the number of new cases should be positive. In terms of the significance of the regression coefficient, the urban travel intensity with a lag of 1 day is significant and the coefficient are all negative, that is, the urban travel intensity of the previous day will reduce the number of diseases in the following day, and the migration of Hubei Province in the regression results are not significant, which is not consistent with the actual situation. The intensity of intra-urban travel was added to the model as an explanatory variable, which increased the explanatory power of the number of new patients in each province, increased the goodness of fit within the group, but reduced overall R2 and the between-groups R2. At the same time, the inflow of population will inevitably affect the intensity of intra-city travel, and there is a moderate correlation between the scale of inflow population and the intensity of intra-city travel, which will lead to a large error in the model results. In addition, there is a reverse causal relationship between the number of the number of newly confirmed cases and the intensity of urban travel, which also leads to the bias of regression coefficient.
After 22 January 2020, all provinces and cities have successively launched the level one response to major public health emergencies, requiring people to wear masks and wash their hands frequently, so as to prevent from person-to-person transmission. Human-to-human communication is the main channel of novel Coronavirus transmission. Since 23 January 2020, the travel intensity of each provincial level and city showed a cliff-like decline, by the end of the extended national holiday on 10 February 2020, the intensity of urban travel began to recover gradually. Local governments strictly require individuals to wear masks and other anti-epidemic measures in public places. Subsequently, all provinces and cities adopted the health code for personal travel to implement big data control, which greatly curbed the spread of close contact. From a medical standpoint, wearing masks and frequent hand washing are highly effective ways to prevent infection during close contact.
The main reasons for the spread of population movement are the interprovincial movement of infection, latent patients and virus carriers in the early stage, and the lack of understanding of virus transmission in the early stage. The transmission of COVID-19 lies in close contacts, and usually the scope of individual activities and contacts differs greatly from the area covered by the intensity of urban travel, therefore the early transmission of COVID-19 is not affected by the intensity of intra-urban travel. In theory whether the urban travel intensity has a significant impact on the number of newly diagnosed patients in this province still needs to be further verified.
The empirical results show that the development of COVID-19 outbreaks is influenced by population movements, and the spread of COVID-19 by population movements is determined by both its size and the prevalence of disease in the destination. At present, it is not clear whether the intensity of urban travel has a significant impact on the number of new cases in the locality. In the analysis of COVID-19 transmission that was jointly influenced by the size of the flow and the number of patients in the place of departure, there was a significant difference in the impact of the place of departure on the number of new patients compared with other places.
Discussion and Conclusion
In the first wave of COVID-19 in China, the movement of unconfirmed patients and potential carriers of the virus has led to a widespread outbreak of COVID-19 in Mainland China. During the interprovincial transmission of COVID-19 caused by movement of people, from the influence factors and ways of transmission, the main conclusions of this paper are as follows:
The spread of the first wave of COVID-19 in China can be divided into two phases. The early phase of transmission was characterized by interprovincial migration and ended around 28 January 2020.
The modeling results show that the transmission of COVID-19 between provinces is influenced by interaction of the scale of population inflow and the degree of epidemic in the outflow region. The influence coefficient of the province where the explosion occurred was significantly different from that of other provinces. In terms of the impact of the spread of the epidemic, the outbreak province has a greater impact than other provinces.
In the first stage of the first wave of COVID-19, the transmission dominated by population Interprovincial migration, the sum of the influence coefficients of Hubei province and other provinces is less than 1, means a state of decreasing scale, indicating that the Wuhan lockdown has achieved the purpose of controlling the transmission of COVID-19.
In terms of explaining the impact of the number of newly infected patients in other provinces except Hubei and Tibet, the scale of population mobility and the intensity of urban travel alone were used to explain, and the regression results were statistically insignificant and deviated from the reality. This suggests that population size does not play a single role in influencing the development of the epidemic in the provinces. Unlike other countries where the intensity of traveling within city has contributed to the COVID-19 pandemic, Chinas situation cannot be explained by the intensity of intra-urban travel, which is mainly due to the country has taken strict measures to prevent and control the outbreak, such as wearing masks.
Based on the analysis of the first wave of COVID-19 in China in 2020, the interprovincial migration was the main cause of the spread of the epidemic, which provides empirical support for epidemic prevention and control. At the same time, the results can provide reference and operability for provincial governments to take prevention and control measures of population migration. However, with the continuous mutation of COVID-19 virus strains, the latest virus strain Delta has the characteristics of stronger transmissibility and shorter transmission time. Whether the results of this study are applicable needs to be further verified. In addition, this study only takes China as the research object, and there are certain limitations in the research scope. China’s national conditions are different from other countries, which makes the research on China not necessarily fully applicable in the process of fighting the epidemic in other countries. Next, we will consider the national conditions of different countries and compare the similarities and differences of population movements in the spread of COVID-19 to provide empirical support for the global fight against the epidemic. It is hoped that the COVID-19 epidemic will be overcome as soon as possible.
Footnotes
Declaration of Conflicting Interests
The author(s) declared no potential conflicts of interest with respect to the research, authorship, and/or publication of this article.
Funding
The author(s) disclosed receipt of the following financial support for the research, authorship, and/or publication of this article: This research is supported by Guizhou Province Science and Technology Support Plan Project ([2020]4Y167); Doctoral Foundation of Guizhou Education University (2018BS001); First-class University Construction Project of Guizhou Education University ([2019]35).