
Abstract
This study examined the field of visualizations in computer graphics (VCG) using bibliometric methods, including performance and science mapping analysis. A dataset of documents from SCOPUS, 1986 to 2019, was analyzed and visualized using VOSviewer. The results showed an increasing trend of new documents in VCG. The five most cited publications were all related to data visualization software. The most prolific authors, examined by Citation per Paper (CPP) and Relative Citation Impact (RCI), contributed to research advances in computer graphics, information visualization, interactive data analysis, human computer interfaces, and visualization software development. A document source analysis identified the major scientific journals and conference proceedings in VCG research, and showed that researchers in VCG tend to publish extensively in conference proceedings, but that articles in scientific journals have a higher citation impact. A co-citation analysis of cited sources revealed seven clusters of thematically similar sources in computer science, genomics, neuroimaging, physics & chemistry, mathematics, education, and communication. Co-authorship analysis of countries pointed out collaboration networks in scientific research, where the USA, UK, Germany, France, and Italy collaborated most frequently. Collaborations were fostered by the same language group, or the geographical proximity. The co-occurrence of research terms showed six clusters of related concepts, thematically grouped around search queries, graphical processing, education, genetics, scientific numerical data, and medicine. The study contributed to a better understanding of the field and is expected to help researchers and educators identify research areas, developments, quality scientific literature, and appropriate journals for publishing their own findings related to VCG.
Keywords
Introduction
Definition of Visualizations in Computer Graphics (VCG) and the Research Objectives
Visualization can generally be defined as a chart or other image that is created as a visual representation of an object, situation or a set of information (Lexico, 2020). Visualization attempts to give users insight into complex information via visual display (Marschner & Shirley, 2016). The fundamental goal of visualization is to produce images of data that support visual analysis, exploration, and discovery of novel insights (Healey & Enns, 2012). Furthermore, visualization is a process of representing data graphically and interacting with these representations in order to gain insight into the data. Visualization is important to help us comprehend and organize large data in many areas (Rushmeier et al., 2007).
Computer graphics, a fast-developing branch of computer science, is dealing with generating 2D or 3D images with the aid of computers, providing powerful mechanisms for creating, manipulating and interacting with visual representations (IBM Research, 2020). Computer graphics has become the core technology in numerous fields, including visualizations in ever-expanding applications in interactive multimedia systems, gaming & entertainment, science, education, engineering, medicine, advertising etc. (Rushmeier et al., 2007).
Visualization in the field of computer graphics (VCG) (Figure 1) combines computer graphics elements to create visual data representations that make use of human vision and cognition (Card et al., 1999).

The field of VCG.
The field of VCG has been linked to the development of diverse fields, from mathematics to applied sciences, computer technology, informatics, and the art of design. According to Haber and McNabb (1990) the use of computer visualization in computer-aided design and engineering analysis was the primary force driving the development of computer graphics technology in the late 1970s and early 1980s. Entertainment, including movie special effects, computer animations for advertising and the like-became the main focus of computer graphics development during the middle 1980s. In 1990s scientific visualization became a major focus of computer graphics development. Since then, VCG has penetrated many new areas and have achieved tremendous developments.
With the rapid growth of professional and scientific research literature on VCG, the information became very extensive, yet scattered, fragmented, and difficult to manage and follow. Rushmeier et al. (2007) discussed the evolution and the expanding growth of the applications and potential users of visualization, and called for the need to redefine both introductory and graduate courses in discipline-specific visualization, art and design, computer science, and business. At the level of university education and research, the VCG contents has been classified into very different categories, further illustrating the diversity and fragmentation of the field. According to the International Standard Classification of Education (ICSED), the 0211 Audio-visual techniques and media production falls under 02 Arts and Humanities (UNESCO, 2015). The Frascatti Guidelines (OECD, 2015) classifies VCG-related content into Computer and Information Sciences within the broad classification of Natural sciences, and the Information engineering within the Engineering and technology broad classification. Scopus and WOS also classify VCG content into a variety of categories. For example, Scopus categorizes sources with VCG content into Computer science; Theoretical computer science; Computer science applications; Applied mathematics; Computer graphics and computer-aided design. Similarly, Web of Science database categorizes sources with VCG content into Computer science, interdisciplinary applications; Imaging science & photographic technology; Multidisciplinary sciences; Statistics & probability; Radiology, nuclear medicine & medical imaging. Students, professors, and researchers point out that, compared to traditional, well-defined fields such as chemistry, metamathematics, or electrical engineering, the fragmented nature of VCG makes it more difficult to locate and select literature or to find appropriate journals to publish research results.
The motivation and aims of this study were to address this issue and explore the wide area of VCG using bibliometric methods. More specifically, the objectives of the research were to conduct analyses and visualize the structure of VCG through mapping in order to identify: (1) the global research output, (2) the most relevant/influential documents, (3) the most prolific authors, (4) most important sources, (5) collaboration networks, and (6) the main research contents and areas in VCG.
Bibliometrics and Science Mapping
Bibliometrics was defined by Pritchard (1969) as the application of mathematical and statistical methods to books and other media of communication, and by Hawkins (2001) as the quantitative analysis of bibliographic features of a body of literature. Traditional bibliometric methods focus on publication output, subject category, journal, author, country, research institution, and keyword analysis of specific fields (e.g., Chiu & Ho, 2007; Grossi et al., 2003; Liu et al., 2012). In addition, some new bibliometric methods have been developed and used as effective tools to assess research patterns in different scientific fields (Gutiérrez-Salcedo et al., 2018). Two different types of bibliometric methods can typically be used to explore a research field: performance analysis and science mapping analysis (SMA) (Gutiérrez-Salcedo et al., 2018; Noyons et al., 1999; van Raan, 2005). Performance analysis is used to evaluate different scientific actors, such as researchers, institutions, countries, etc., based on publications and citation data (Narin & Hamilton, 1996). On the other hand, the extraction of knowledge from the intellectual, social or conceptual structure of a research field could be done using science mapping analysis based on bibliographic networks (Gutiérrez-Salcedo et al., 2018; Small, 1997), which provides a topological and temporal representation of the cognitive and social structure of a given research field (Cobo et al., 2011; Small, 1999) and provide a spatial representation of the relationships between disciplines, fields, specialties, and individual documents or authors (Small, 1999). From the perspective of research topics, a large number of studies have recently been conducted using the structural topic modeling (STM) method (Chandelier et al., 2018; Chen et al., 2020, 2021; Kuhn, 2018; Liu et al., 2021). Nowadays, different tools are available to perform bibliometric and scientometric studies, such as BibExcel, CiteSpace, SciMAT, VOSViewer (Moral-Muñoz et al., 2020).
The methodological steps for a science mapping analysis published by (Börner et al., 2005; Cobo et al., 2011) comprises data retrieval, data preprocessing, network extraction, network normalization, mapping, analysis, visualization of results and final interpretation (Figure 2).

Workflow of science mapping.
The first and the most crucial step in any bibliometric analysis is the identification of keywords that will yield the highest number of retrieved articles with minimum false negative or false positive results. The raw data retrieved from the bibliographic sources contain some errors and inconsistencies. To improve the quality of the initial raw data set for the science mapping analysis the preprocessing of initial raw data set is essential. After the data set is preprocessed, a network is built, using different units of analysis, that is documents, sources, authors, cited sources, cited authors and terms, and relations between them (e.g., citation, co-citation, co-authorship, co-occurrence). The normalization process is used to measure the similarities of the items (e.g., authors, keywords and references etc.). The mapping process itself is responsible for building the map by applying a mapping algorithm to the whole network formed using the relationships among the selected units of analysis (Cobo et al., 2011). Once the map has been built, different analyses can be applied to extract useful knowledge, for example network analysis (Carrington et al., 2005; Cook & Holder, 2006; Skillicorn, 2007; Wasserman & Faust, 1994) temporal analysis, burst detection analysis, geospatial analysis (Batty, 2003; Leydesdorff & Persson, 2010; Small & Garfield, 1985). The networks and subnetworks detected in the mapping step can be represented using heliocentric maps (Moya-Anegon et al., 2005), geometrical models (Skupin, 2009), thematic networks (Bailon-Moreno et al., 2006; Cobo et al., 2011), a strategic diagram (Callon et al., 1991; Cobo et al., 2011). Geospatial results are usually visualized over a world or a thematic map (Cobo et al., 2011). At the end of this process the results are interpreted.
Related Works
Science mapping has been widely used for studying the structure and development of various research fields such as visualization education research (Bratt, 2018), psychology (Flis & van Eck, 2018), integrative & complementary medicine (Moral-Muñoz et al., 2014), integrative and complementary oncology (Moral-Muñoz et al., 2019), information literacy (Stopar & Bartol, 2019), qualitative marketing research (Murgado-Armenteros et al., 2015), animal science research (Rodriguez-Ledesma et al., 2015), positive organizational psychology (Martín-Del-Río et al., 2021), female entrepreneurship studies (Deng et al., 2021), lean supply chain management (Garcia-Buendia et al., 2021), human resource management (Santana & Lopez-Cabrales, 2019), translation studies ( Wang et al., 2019), educational leadership and management (Gümüş et al., 2020; Hallinger, 2019, 2020; Kovačević & Hallinger, 2020), educational administration (Hallinger & Kovačević, 2019), sustainable entrepreneurship (Thananusak, 2019), sustainable tourism development (Yoopetch & Nimsai, 2019), and safety research and science (Jin et al., 2019; Li et al., 2021). In their study, Sajovic et al. (2018) conducted a retrospective bibliometric analysis and mapping of the journal IEEE Transactions on Visualization and Computer Graphics, one of the leading journals in the field of VCG. Although science mapping is increasingly used in various research areas, to our knowledge, no comprehensive bibliometric analysis and mapping has been performed and published for the entire field of VCG.
Materials and Methods
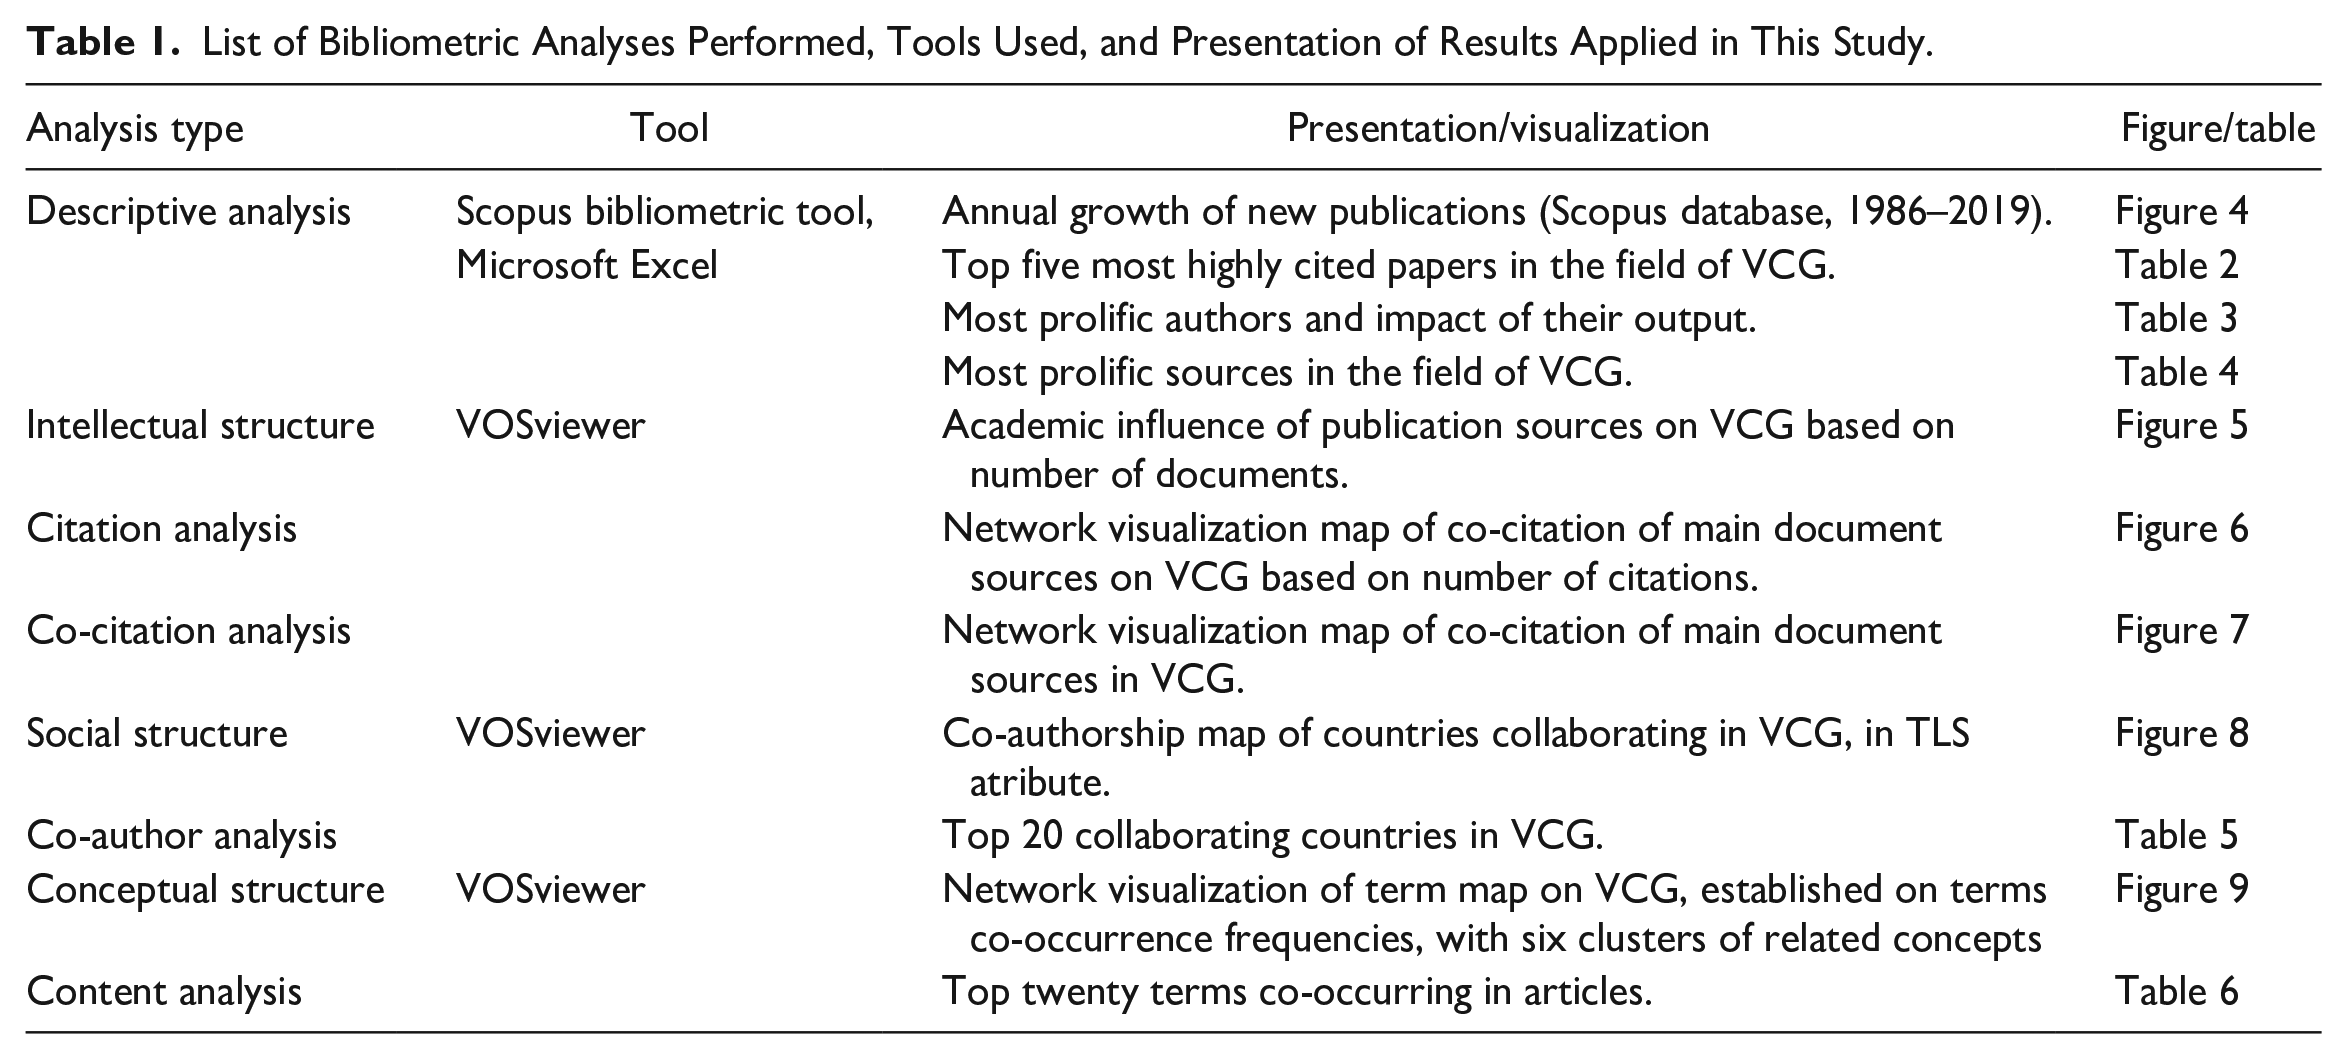
Scopus bibliometric tools and Microsoft Excel were used for basic statistical analyses and the visualization of bibliometric results. The VOSviewer software was used to construct and analyse networks of different items (documents, authors, sources, references) connected by citation, co-citation, co-authorship or co-occurrence links, and for creating, visualizing and exploring bibliographic maps (van Eck & Waltman, 2020). The main analyses performed in this study are presented in Table 1.
List of Bibliometric Analyses Performed, Tools Used, and Presentation of Results Applied in This Study.
Top Five Most Highly Cited Papers in the Field of VCG.
Most Prolific Authors and Impact of Their Output.

Most Prolific Sources in the Field of VCG.
Note. CPP = citation per paper; RCI = relative citation impact.
Top 20 Collaborating Countries in VCG.

Top 20 Terms Co-occurring in Articles.

Science mapping analysis in the VCG area was conducted following the methodology of Cobo et al. (2012), as shown in Figure 3.

Workflow of science mapping applied in this study.
Bibliometric information on scientific and professional publications in the field of visualizations in computer graphics was gathered in the SCOPUS database, which is considered “the largest abstract and citation database of peer-reviewed literature, including scientific journals, books, and conference proceedings” (Dardas et al., 2019; Elsevier, 2020). Special attention was paid to the selection of keywords, search fields and search syntax formulation. Some different search strategies were conducted and validated. The initial search query was: TITLE-ABS (visualization*) AND TITLE-ABS (“Computer Graphic*”). The asterisk was used as the truncation symbol to retrieve all potentially correct words, while the quotation marks were used for phrase indexing. The initial search terms were found to be too narrow. Further search queries included various truncations and spelling differences of terms visualization and graphic. The broadest query (TITLE-ABS (visual*) OR TITLE-ABS (vizual*)) AND TITLE-ABS (graph*) resulted in 58.005 documents. The inappropriate abbreviation of the term graphic has led to unrelated documents in the results, such as related to “graphite,” “graphia,” “graphitic,” “graphene,” and “graphs theory.” On the other hand, an inappropriate abbreviation of the term visualization has led to loss of documents including terms such as visualize, visualizing, visualized, visualizer, visual. During the search query optimization the manual review process included checking the titles and abstracts. The validity of research strategies was also checked manually by reviewing top 100 cited articles to make sure that all these articles were relevant to the theme of the study and to ensure the absence of false-positive results in these articles. In the case of ambiguity full texts were checked by an expert in the field of VCG for final judgment. Finally used search query with the highest accuracy and minimum error was as follows: (TITLE-ABS = visual* or TITLE-ABS = vizual*) and TITLE-ABS = graphic*. The final search was conducted in June 2020 and the selected publication time interval was set to the publication years 1986 to 2019. The retrieved 37,309 documents were narrowed by document type to the final set of 34,138 journal articles and conference papers. Conference papers were included based on recommendation of the VCG expert since conferences play an important role in this field.
When creating maps based on bibliographic data, a VOSviewer thesaurus file was created and used to merge different variants, such as author name or source title (e.g., “IEEE Comput. Graph. Appl,””IEEE Comput. Graph. Appl.” and “IEEE Comput. Graphics Appl.”). When creating term maps based on text data, a VOSviewer thesaurus was created and used to merge terms, such as singular and plural, synonyms (e.g., “geographic visualization” and “geovisualization”), spelling differences (e.g., “color” and “color”), abbreviated and full terms (e.g., “3D,” “3-D” and “three dimensional”). The same thesaurus file was also used to ignore terms (e.g., general terms such as “conclusion,””abstract”,”method”,”graphical abstract”). After the data set was preprocessed, a network was built, using different units of analysis: documents, sources, cited sources, countries and terms used in the titles and abstracts of the analyzed publications. Several relationships between different units of analysis were established: (a) citation of sources to identify the core journals/sources related to the research field, (b) co-citation of cited sources, to identity sources that are cited together most frequently and are in strong relations, (c) co-authorship of countries to examine the geographic distribution of studies (documents) published in VCG, and (d) co-occurence between terms for recognition of term clusters as indicators of research areas. VOSviewer applied the association strength normalization by default, as presented in detail by van Eck and Waltman (2020). After completing the normalization process, the VOS (“visualization of similarities”) mapping technique of the VOSviewer software was used to build science maps. Resulting maps were analyzed and presented through network visualizations, where items were represented by their label and by default also by a circle. The size of the label and the circle of an item were determined according to the weight of the item: the higher the weight of an item, the larger the label and the circle of the item. The color of an item was determined by the cluster the item belonged to. The lines between the items represented the links and their strength.
Results and Discussion
Publication Output and Trend Analysis
Figure 4 shows the annual growth of publications related to VCG during the period 1986 to 2019. The total number of new documents and the number of articles both showed a rising trend, while the gain of new conference papers decreased after 2010. For most years, new scientific journal articles outnumbered conference papers, except for the period 2002 to 2012, when the conference contributions exceeded the journal articles.
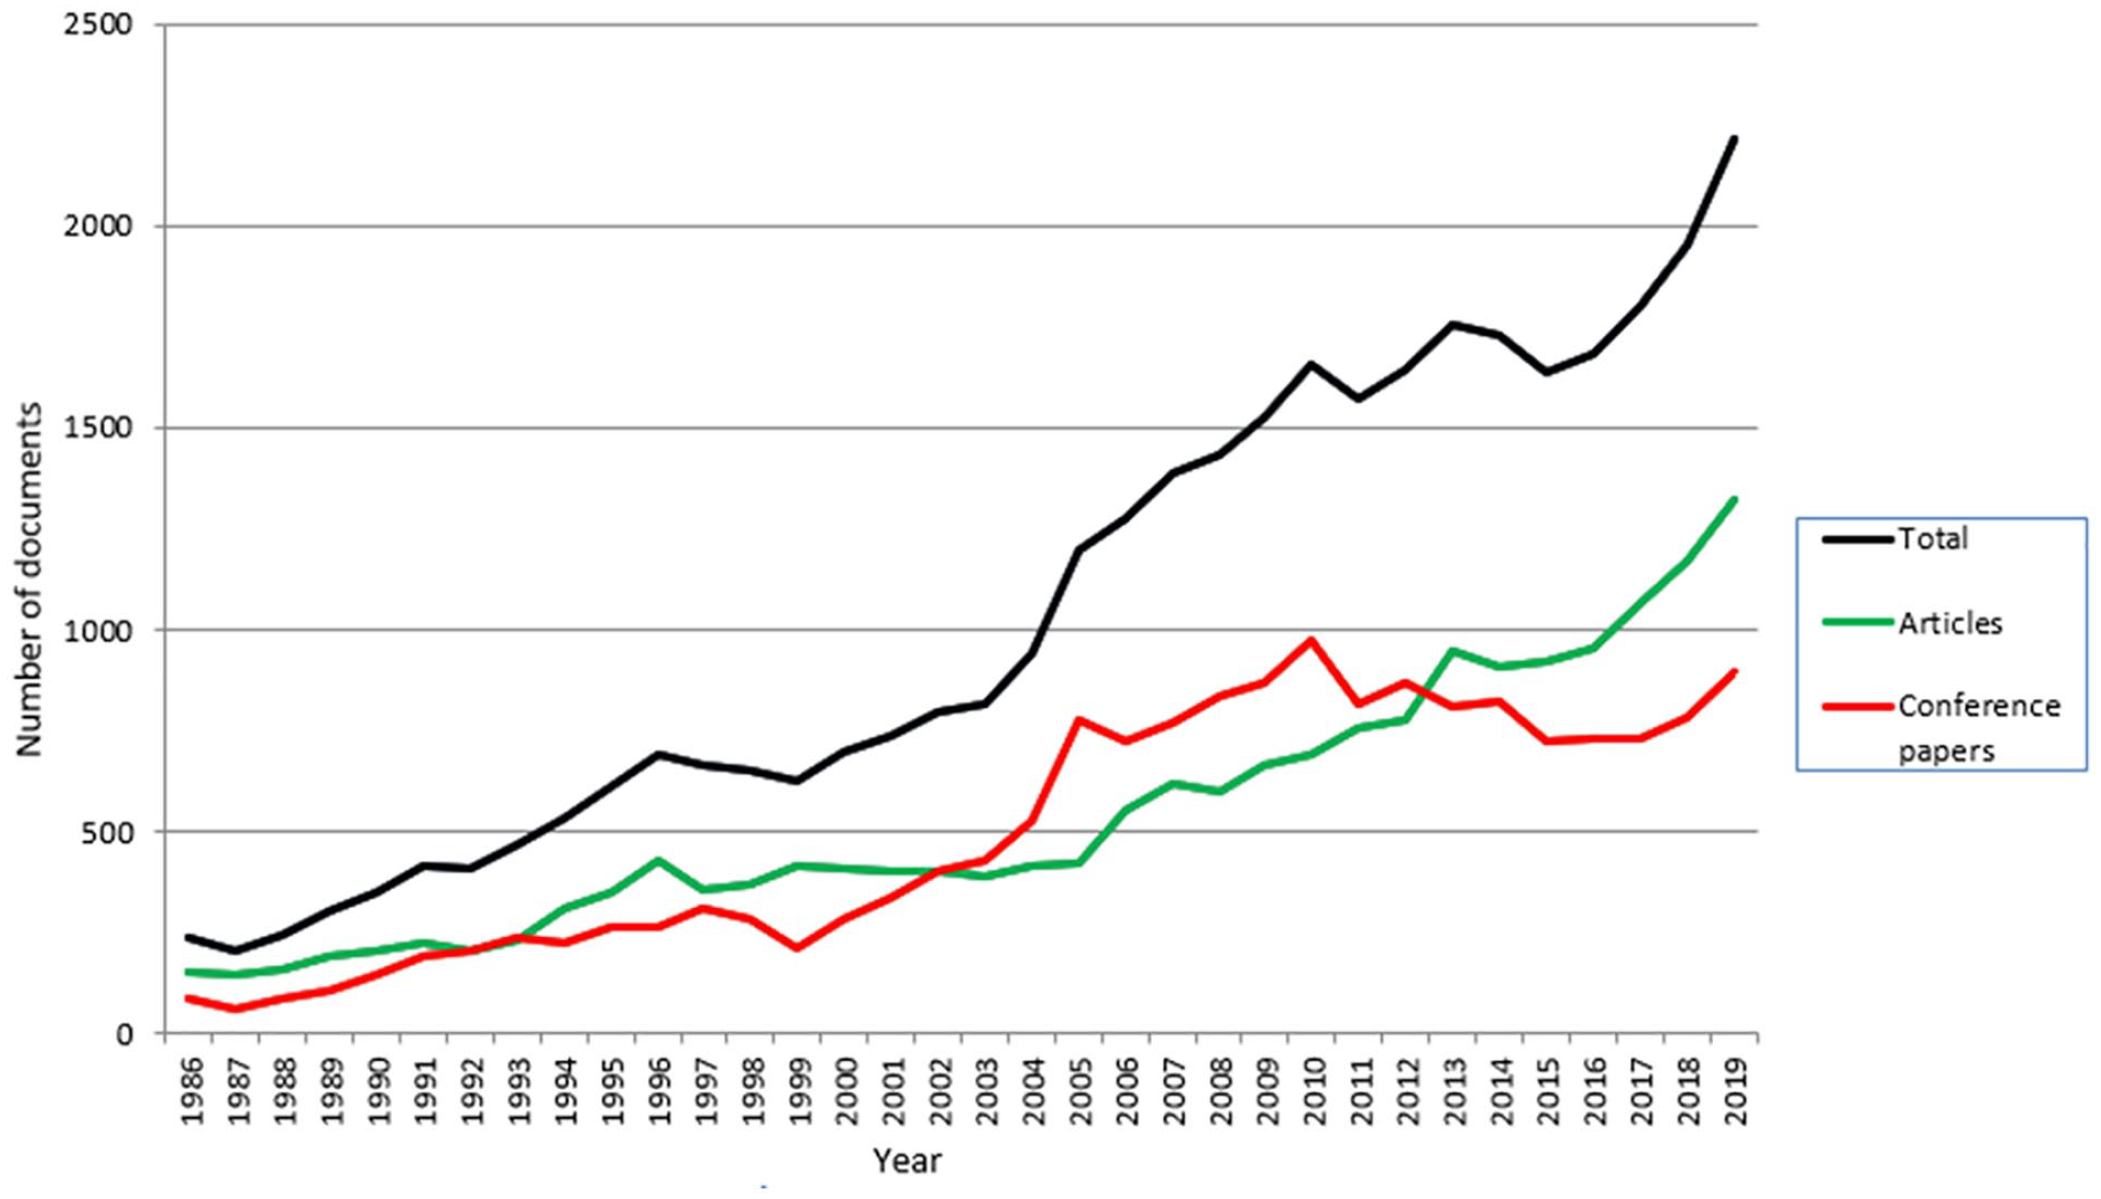
Annual growth of new publications (Scopus database, 1986–2019).
Analysis of Documents
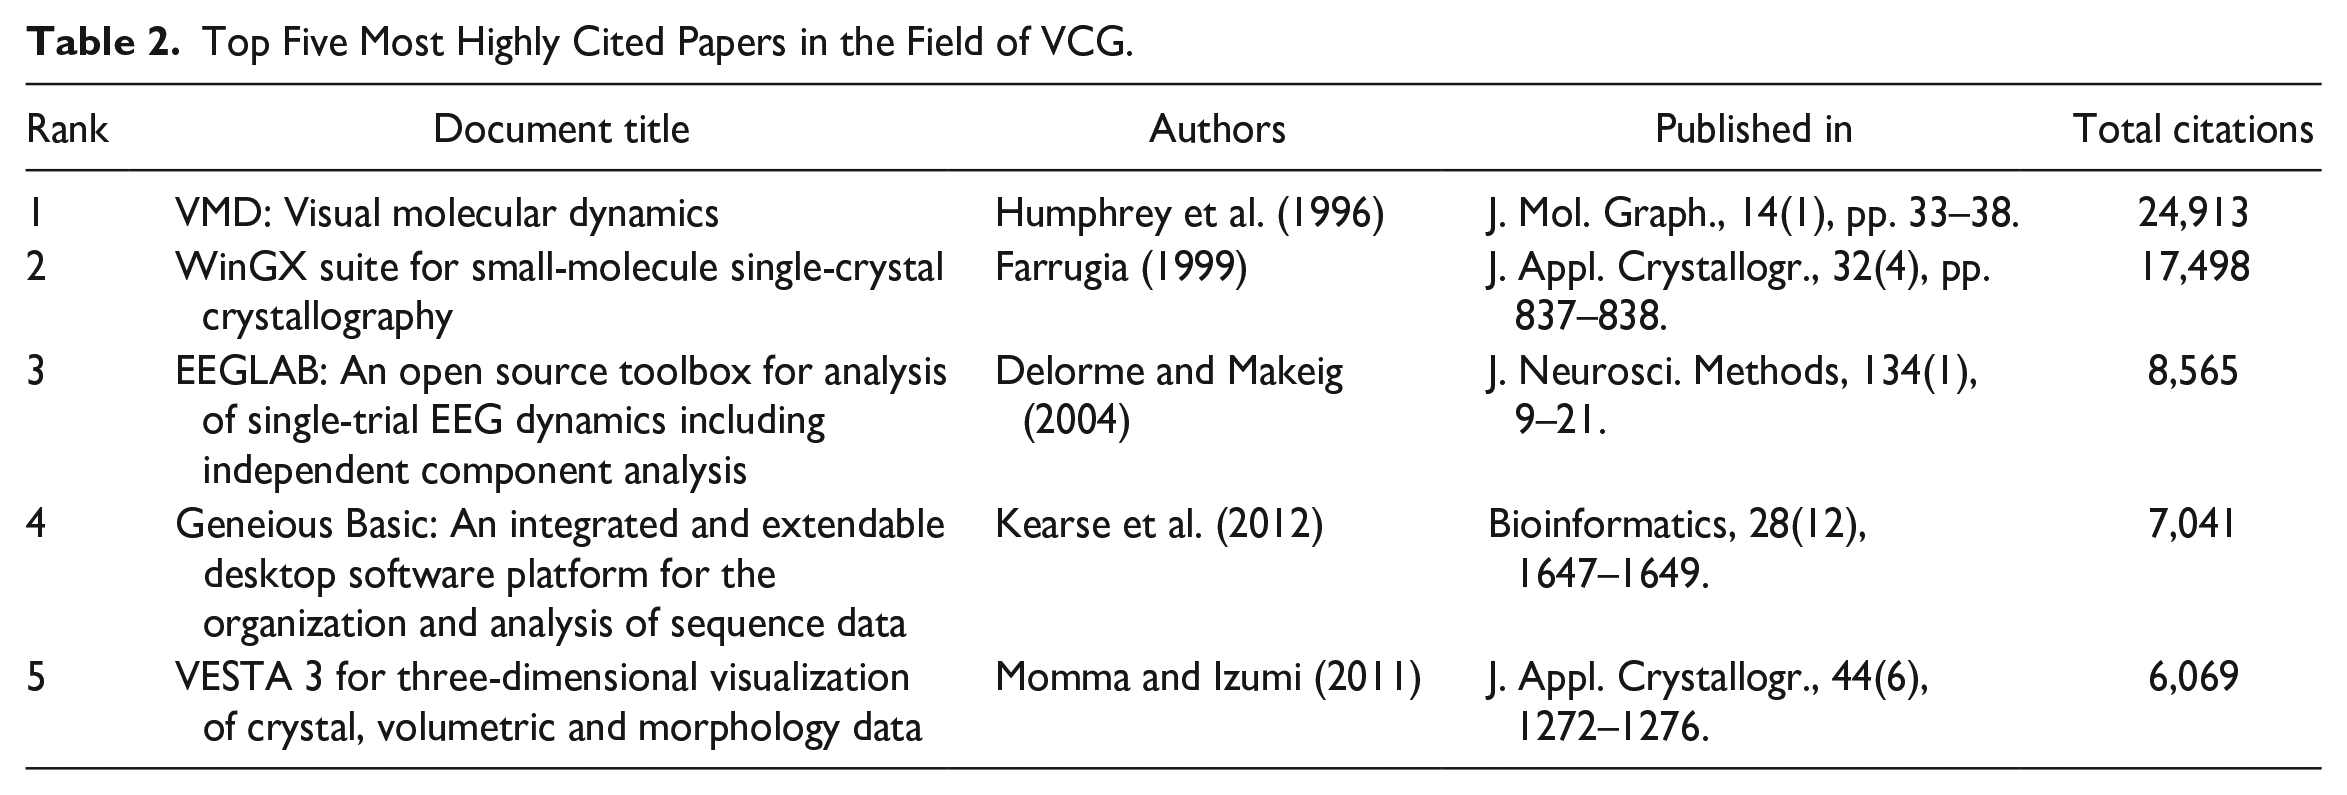
The analysis of most cited documents in the field of VCG revealed that the first five publications all related to software programs or packages, as presented in Table 2. This is to be expected, as software tools were used and cited by many authors of later studies. The first placed paper by Humphrey et al. (1996), with 24,913 citations, was a paper on the molecular graphics program VMD, designed for the display and analysis of molecular assemblies, in particular biopolymers such as proteins and nucleic acids. The second most cited paper, with 17,498 citations, was about the WinGX suite for small-molecule single-crystal crystallography, used for the processing, solution, refinement, and publication of single-crystal diffraction data (Farrugia, 1999). The other three most cited articles presented and discussed a tool used in neurology for the analysis of single-trial electroencephalogram dynamics, called EEGLAB (Delorme & Makeig, 2004), the bioinformatics desktop software platform Geneious Basic for the organization and analysis of sequence data (Kearse et al., 2012), and the program VESTA 3 for three-dimensional visualizations in crystallography (Momma & Izumi, 2011).
Analysis of Authors
In order to identify the most productive authors and to investigate their citation impact, the indicators Citation per Paper (CPP) and Relative Citation Impact (RCI) were used.
Table 3 lists 17 authors who published 20 or more papers in VCG. Together they published 475 (1.39%) papers of the total output, and their publications received 11,964 citations (3.47%). 14 of 17 most prolific authors have RCI value more than 1, and CPP value more than average value. Thomas Ertl from University of Stuttgart, Germany, published the most papers (80, 0,23%), which have been cited 1,996 times. His research includes visualization, computer graphics and human computer interfaces (University of Stuttgart, Thomas Ertl, 2020). The highest values of CPP and RCI belong to Jeffrey Michael Heer, an American computer scientist from the University of Washington, best known for his work on information visualization and interactive data analysis. When ranked by the number of citations, Schulten Klaus from the University of Illinois at Urbana-Champaign, United States, received 25,401 citations of his 12 publications. He also co-authored the most cited publication entitled VMD: Visual molecular dynamics, which alone received 24,913 citations. This paper introduces and discusses a molecular graphics program, designed for the display and analysis of molecular assemblies, in particular proteins and nucleic acids, which has subsequently been used by many other researchers.
Analysis of Sources
Citation analysis of sources
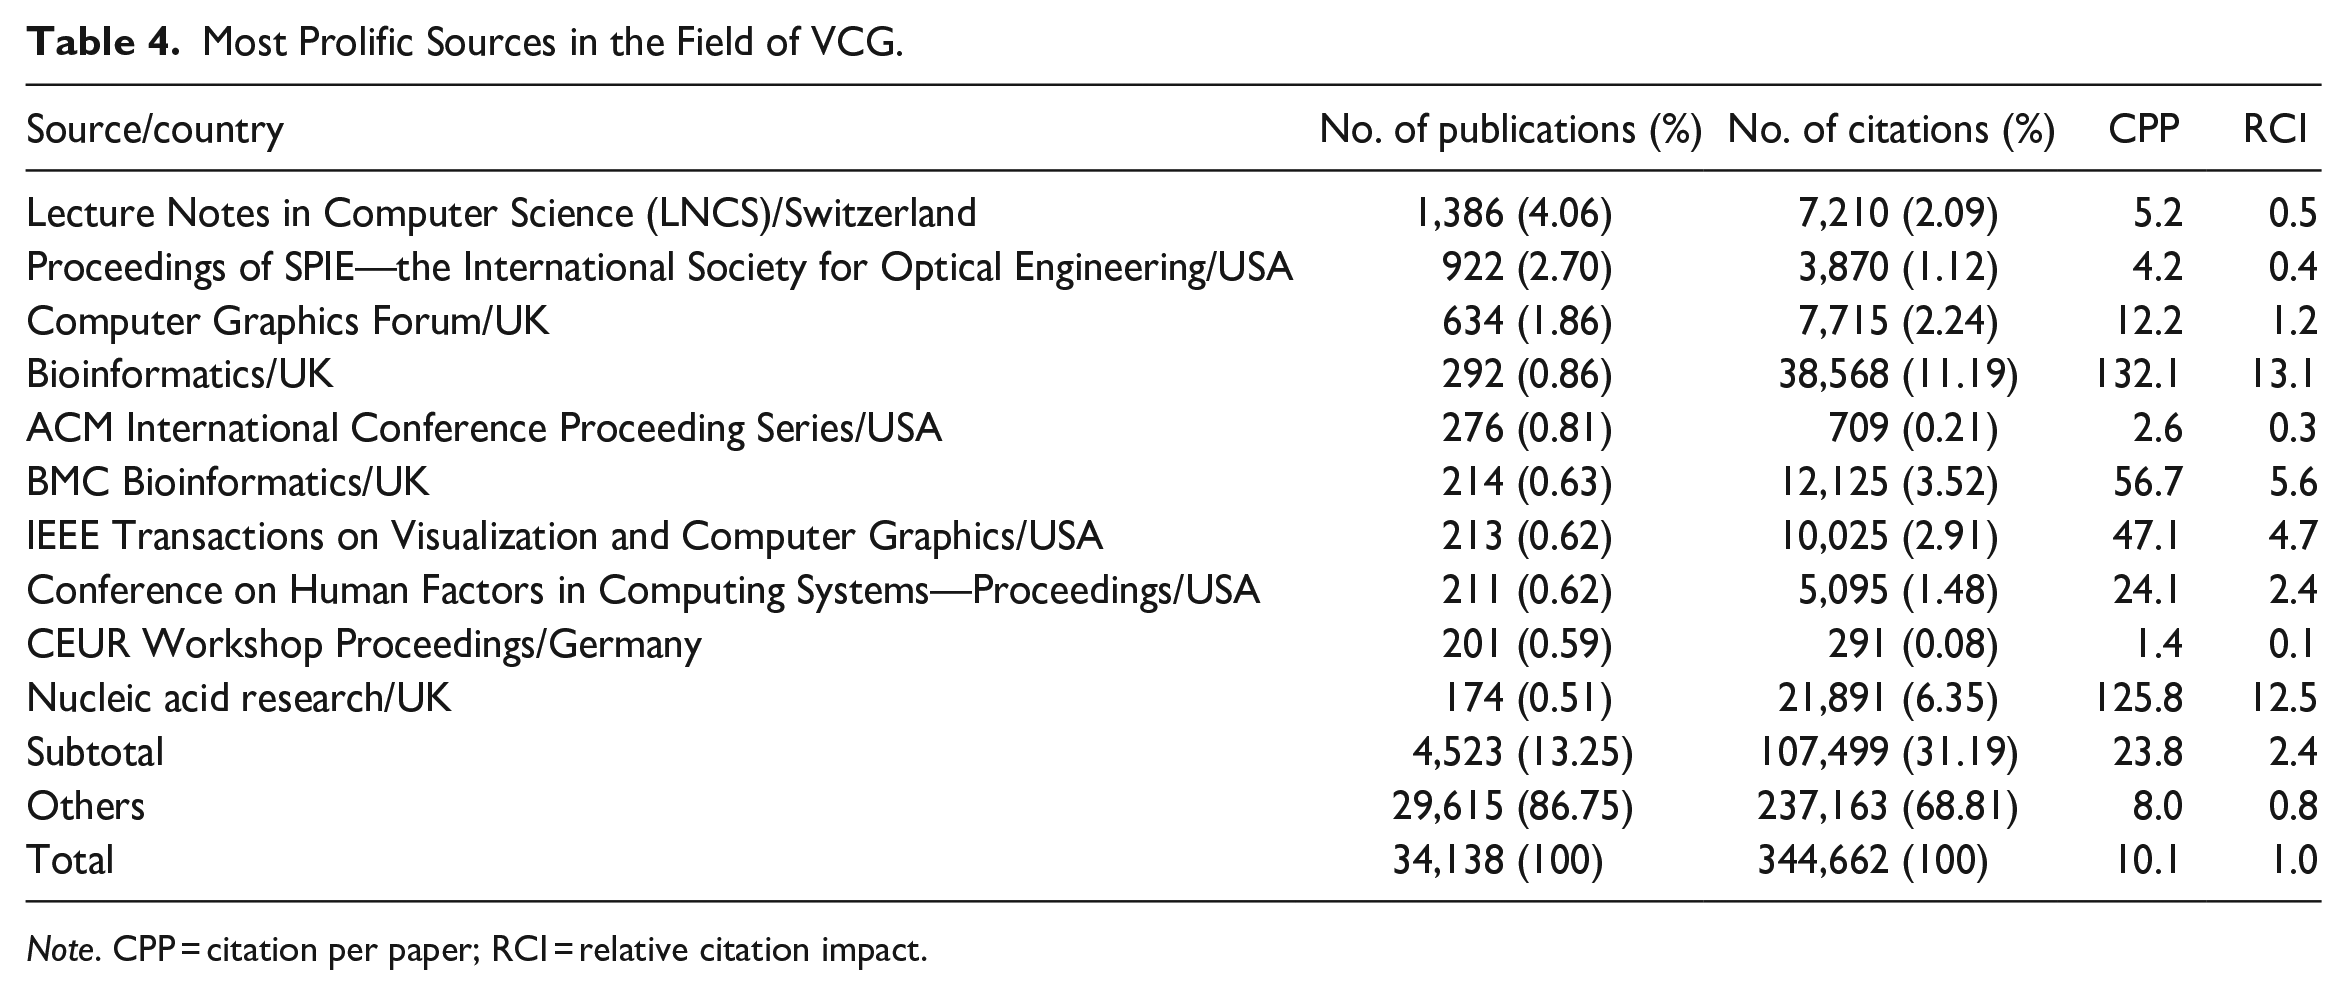
Document sources analysis was used to identify the core journals (sources) related to the research field of VCG. This kind of analysis may be of great significance for researchers to find relevant literature and choose the most suitable journal for publishing their own research results. In total, 11,340 different publication sources were detected in the field of VCG. Most prolific sources in terms of Citation per Paper (CPP) and Relative Citation Impact (RCI) are presented in Table 4.
Among the ten most prolific sources five were conference proceedings. This is consistent with Figure 1, which shows the numerical preponderance of conference papers over journal articles for the period 2002 to 2012. Regarding the number of published documents, two proceedings series stood out. Lecture Notes in Computer Science (including subseries Lecture Notes in Artificial Intelligence and Lecture Notes in Bioinformatics) topped the list with 1,386 publications, followed by Proceedings of SPIE – The International Society for Optical Engineering with 922 documents. Among journals, the Computer Graphics Forum led with 634 published articles (Figure 5). Proceedings of SPIE is not visible on this map because its node is hidden behind LNCS. LNCS is a proceeding series, and the most important conferences identified in term of VCG were the International Conference on Human-Computer Interaction, International Symposium on Visual Computing, International Symposium on Advances in Visual Computing, and International Conference on Computers Helping People with Special Needs. In terms of the number of published papers, researchers in VCG tend to publish a lot in conference proceedings, but articles in scientific journals are apparently cited more frequently than proceedings papers and have a higher citation impact. In relation to CPP and RCI values, articles in scientific journals stood out, and among conference proceedings only the Conference on Human Factors in Computing Systems.

Academic influence of publication sources on VCG based on number of documents.
When ranked by the number of citations, the Journal of Applied Crystallography had the highest academic influence with 50,803 citations (from only 49 documents), followed by Bioinformatics (38,568 citations, 292 documents) and the Journal of Molecular Graphics (29,107 citations, 85 documents). In order to create a map of most cited journals, the citation analysis of sources was selected. The result is presented in Figure 6. The size of the circle in a map was determined by the number of citations. Journal of Molecular Graphics is not visible on this map because its node is overlapped by the Journal of Applied Crystallography node.
Network visualization map of co-citation of main document sources on VCG based on number of citations.
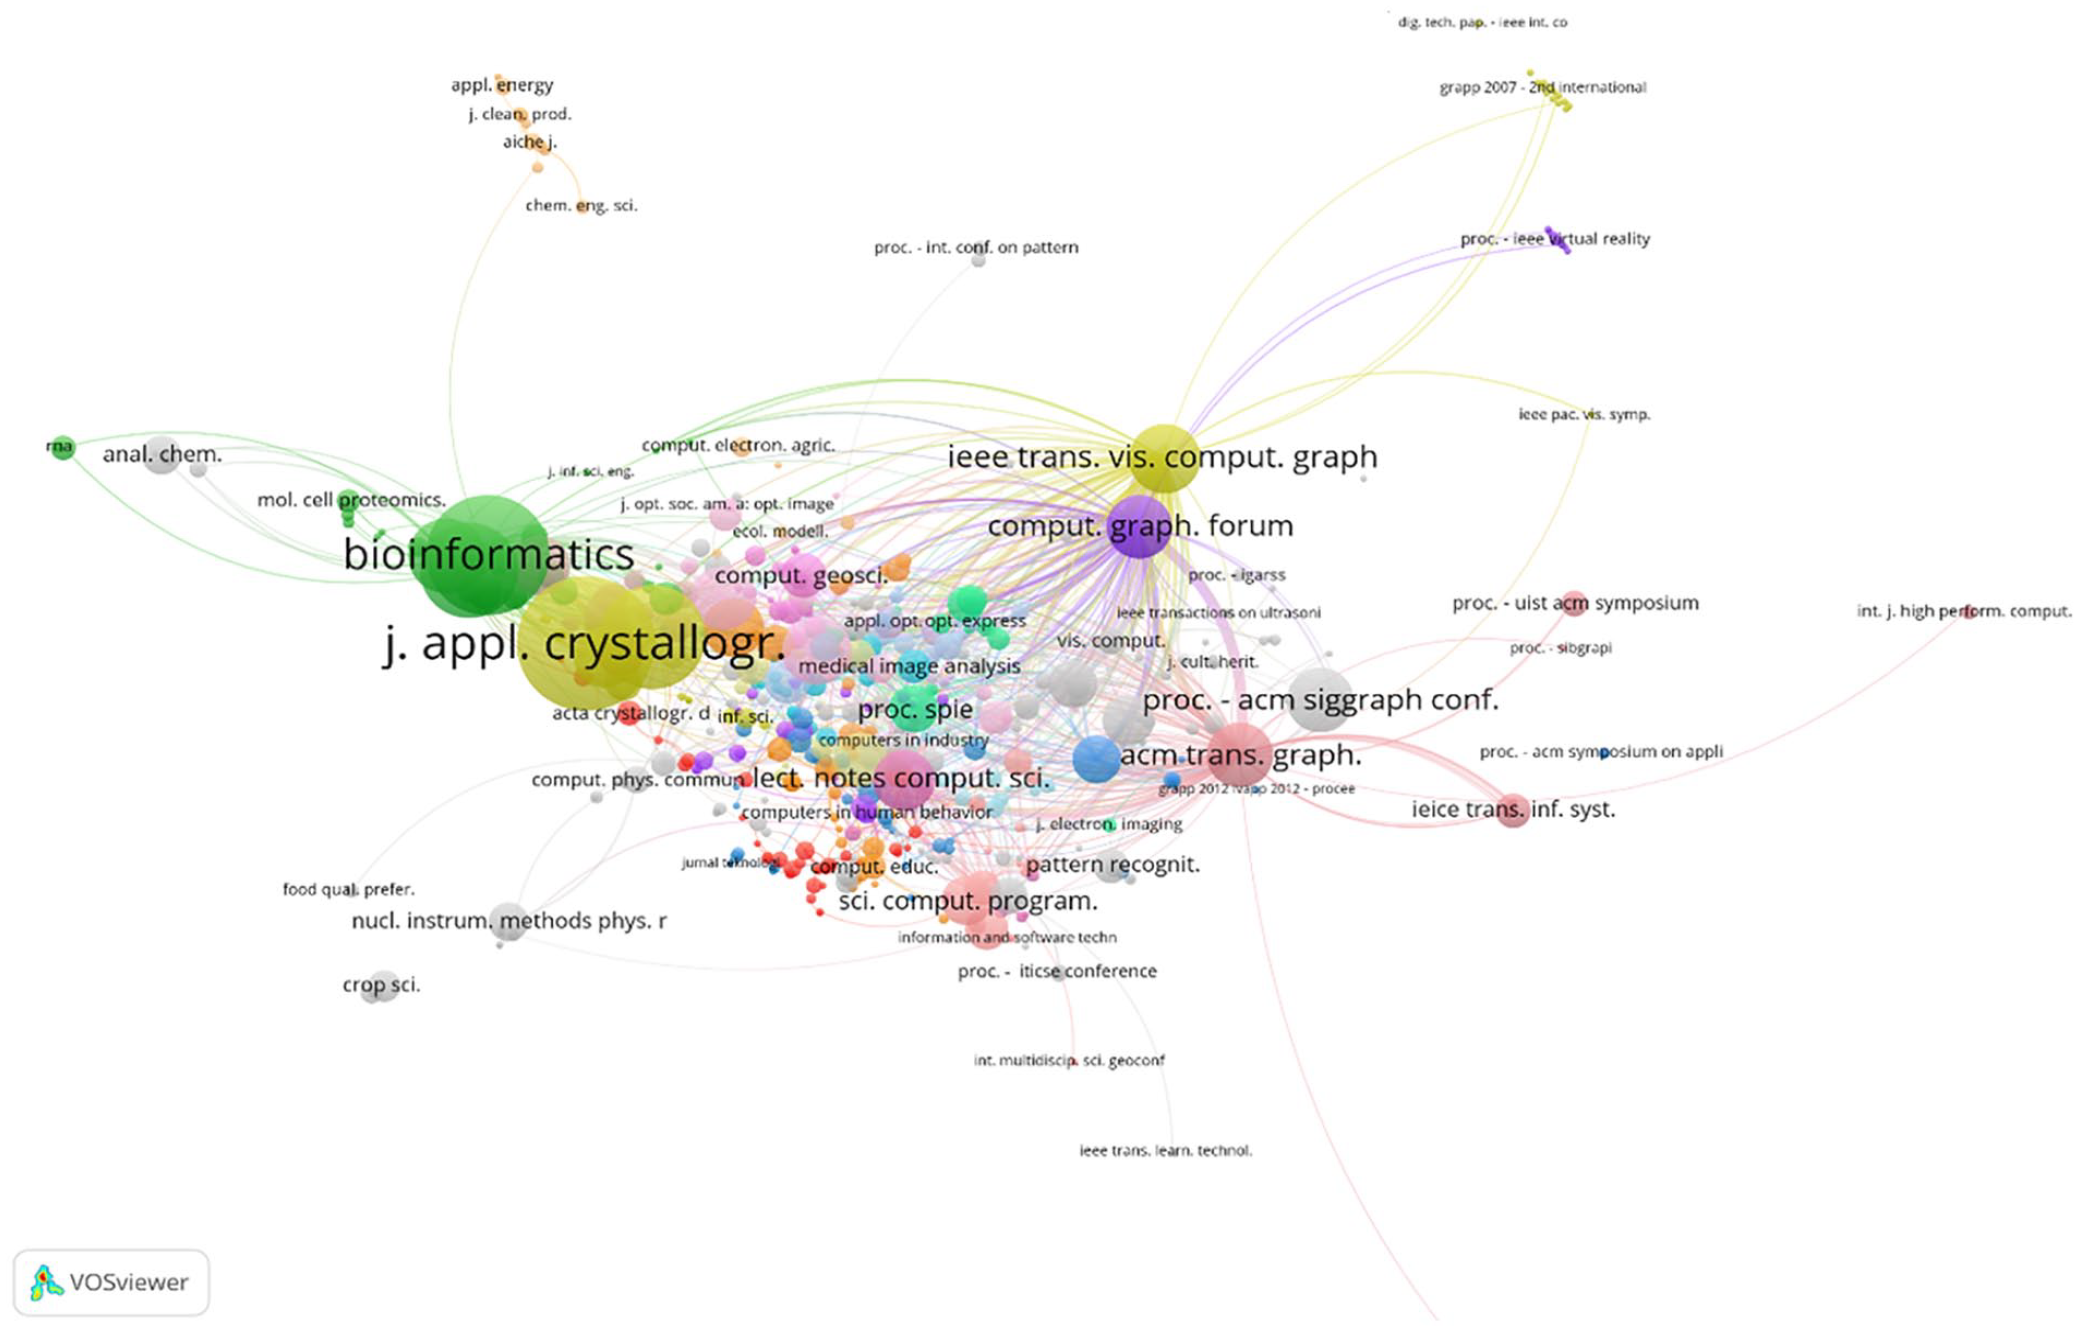
Co-citation analysis of cited sources
A co-citation analysis of cited sources was performed as well. By definition, two publications are co-cited if there is a third publication that cites both publications (Small, 1973). The larger the number of publications by which two publications are co-cited, the stronger the co-citation relation between the two publications. For the analysis in this study, the minimum number of citations of a source was set to 20, and 2,906 out of 269,982 sources met the threshold. 1,000 sources with the greatest TLS were selected. The number of citations was correlated with the circle size assigned for a source. A line connecting two sources indicated that these two sources have been cited in the same publication, and the thickness of the connecting line represented the strength of co-citation between these two sources, indicating more similarities and thematic relations between them.
The co-citation analysis pointed out closely related journals where researchers in VCG may publish their research.
Figure 7 shows the resulting network visualization map with seven clusters of thematically similar sources. Clusters related to computer graphics (green), computer science, visualization, and software (olive green) and applied statistics and geosciences (light blue) are more interlinked to each other than to other clusters and contain basic computer graphics and statistics sources. They are surrounded by sources publishing applications in different disciplines, for example education, learning and psychology (red), medicine and neuroscience (dark blue), chemistry, biology, biochemistry, molecular biology, genomics and general science (orange), and physics and astronomy (purple).

Network visualization map of co-citation of main document sources in VCG.
Journals with the highest number of citations were IEEE Transactions on Visualization and Computer Graphics (6,324 citations), ACM Transactions on Graphics (5,771 citations), Nucleic Acid Research (4,026 citations), Computer Graphics Forum (3,489 citations) and Bioinformatics (3,058 citations). The journal IEEE Transactions on Visualization and Computer Graphics was commonly co-cited with the Computer Graphics Forum (link strength 531.38), ACM Transactions on Graphics (link strength 380.00), and IEEE Computer Graphics and Applications (link strength 232.10). Science and Nature are in the middle of the figure and have the highest number of links to other sources (928 and 875, respectively). This result seems to make sense since these two journals cover several scientific fields.
Co-authorship Analysis of Countries
Collaboration networks show how authors, institutions or countries relate to others in the field of scientific research. When authors from two or more countries contributed to a given article, the authors’ countries are considered as collaborating countries.
Figure 8 shows the network of international co-authorship relations in VCG among 106 countries grouped in nine clusters. The size of the circle in a map is determined by the weight attribute Total link strength (TLS) which represents collaboration intensity of countries. In this respect, the USA, United Kingdom, and Germany exhibit the strongest collaboration intensity in VCG. The distance between two countries indicates the relatedness between them and the thickness of lines denotes the link strength between two items.

Co-authorship map of countries collaborating in VCG, in TLS atribute.
Top 20 countries with collaborations in VCG, ranked by the total link strength (TLS), with added links, cluster, number of documents, and number of citations are listed in Table 5. TLS attribute represents the cumulative strength of all links of a country with other countries.
Among 106 countries the USA, UK, Germany, France, and Italy collaborate most in VCG, each with 88, 68, 62, 62, and 60 links, respectively. USA has the highest collaboration intensity (TLS = 2,458 with 10,648 articles), and presents the greatest partnerships with other countries, followed by UK with 1,193 total link strength and 2,322 papers. The maximum link strength is between USA and China (272), followed by USA-Germany (246) and USA-UK (211). Collaborations fostered by the same linguistic group (blue cluster with spanish-speaking countries and olive green cluster with French-speaking countrie) or geographical proximity of countries are also noticeable.
Content Analysis
Co-occurrence of terms
In the first part of the analysis, the automated term identification technique (van Eck & Waltman, 2020) was applied. The terms (concepts), that is noun phrases in the titles and abstracts of 34,138 documents were identified. The noun phrases were defined as sequences of words where the last word in the sequence is a noun, whereas any other word was either a noun or an adjective (14). Phrases which occurred at least 10 times were taken into account. In the set of 448,691 noun phrases, 10,315 met this threshold, and for them, a relevance score was calculated. The 6,189 (60%) most relevant concepts were selected for the representation in the map. A few non-relevant highly occurring general terms with no specific meaning were marked by a low relevance score in the program and were excluded from the analysis. Figure 9 represents the term map, established on the terms co-occurrence frequencies, with six clusters of related concepts, depicted in different colors. Nodes represent terms and the node size indicates the occurrence frequency of the term, thst is the bigger the size, the higher the occurrence number of a term.
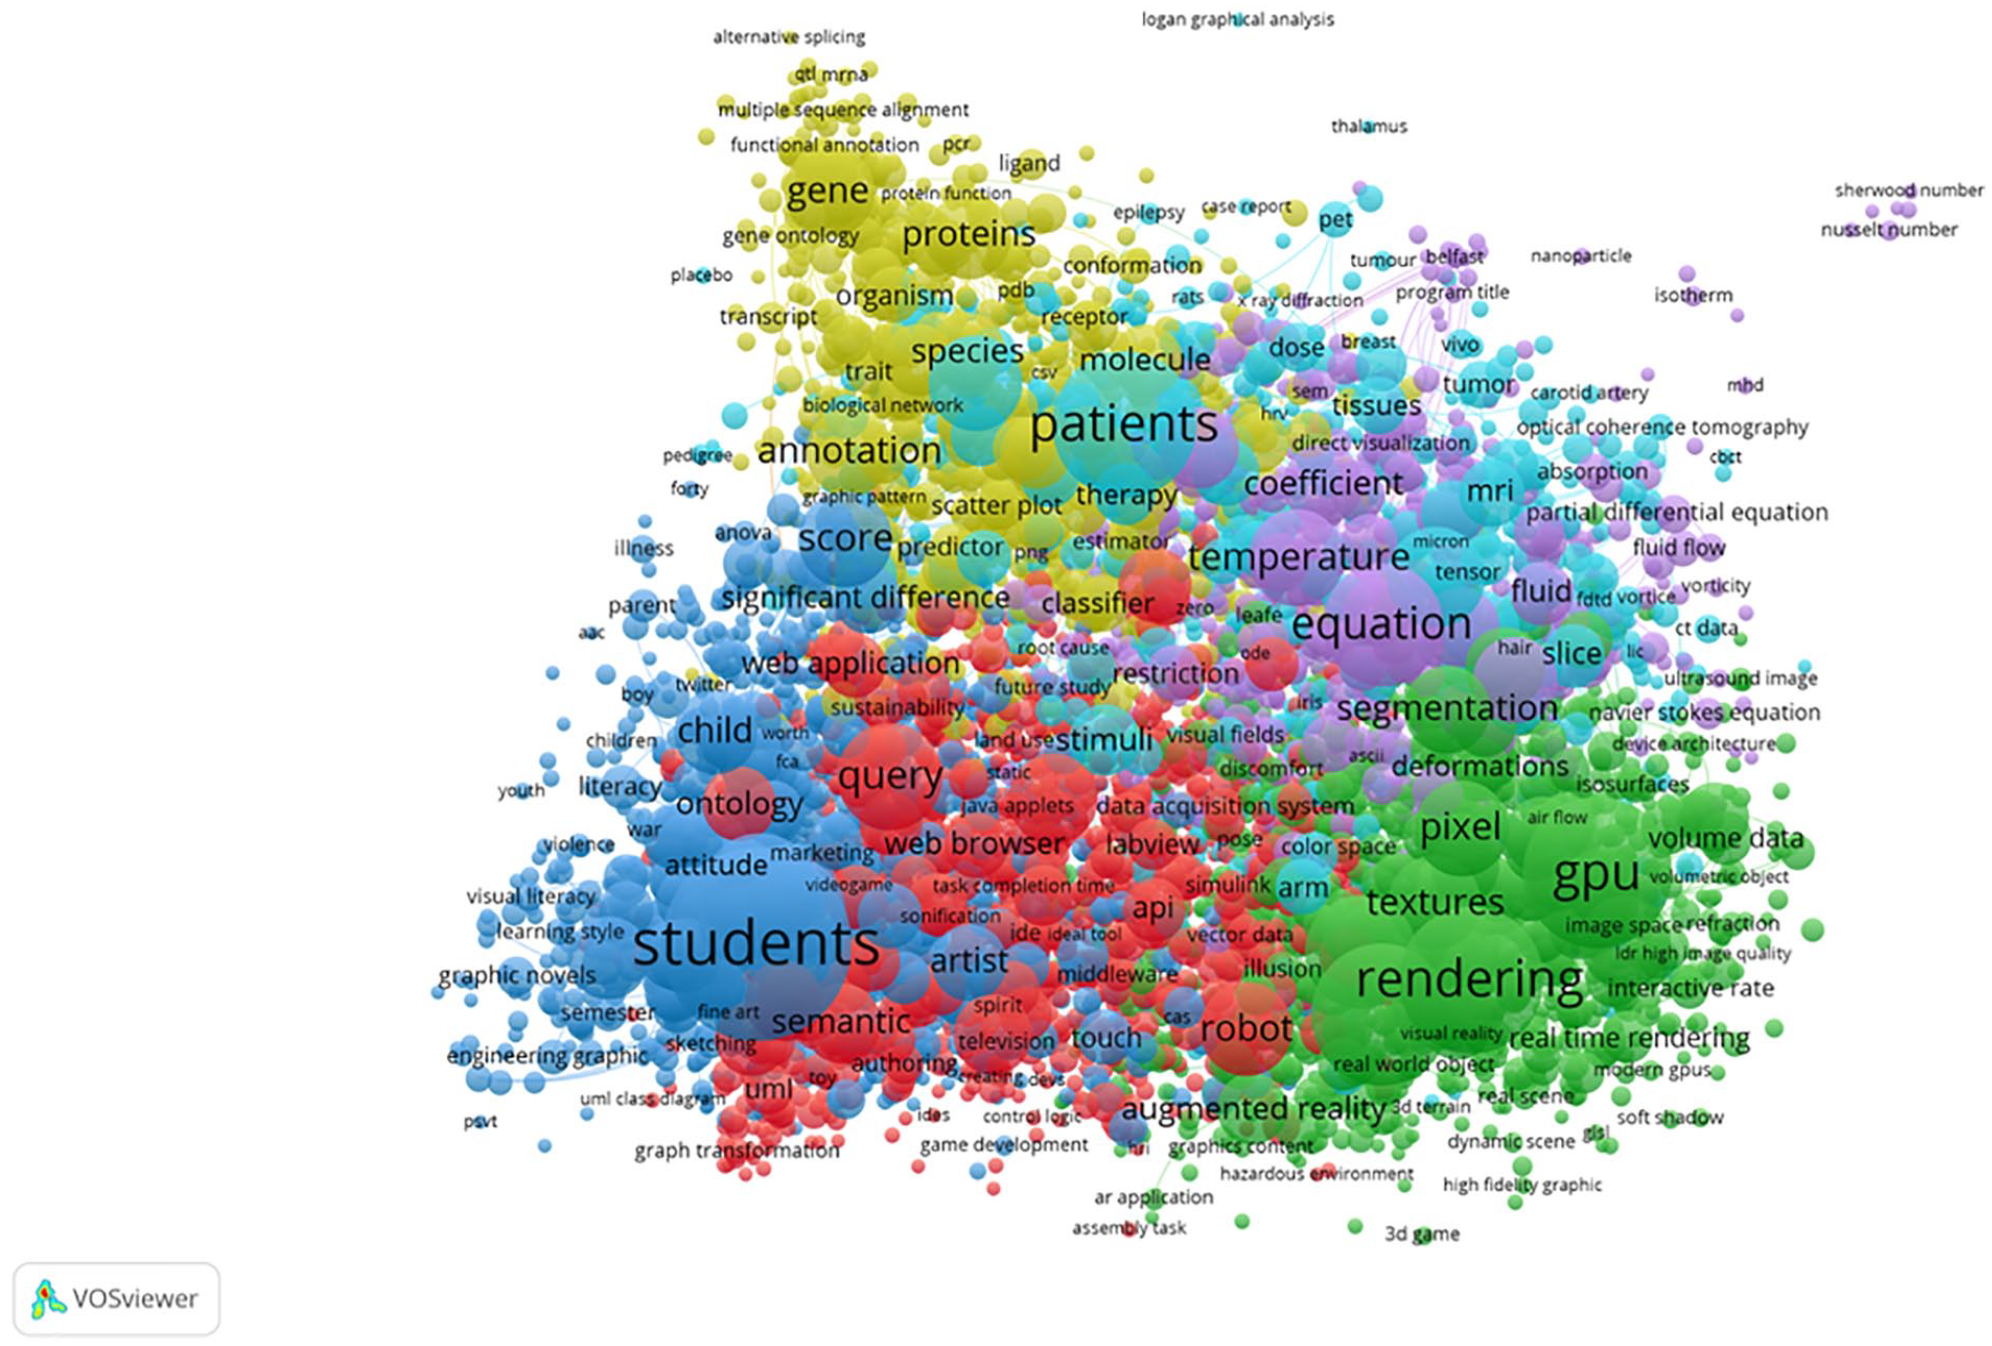
Network visualization of term map on VCG, established on terms co-occurrence frequencies, with six clusters of related concepts.
Table 6 shows the top twenty terms in the titles and abstracts of publications on VCG calculated by VOSviewer. For a given term, the Links attribute indicates the number of links a term has with other terms (the number of publications in which two terms appear together), and the TLS attribute indicates the cumulative strength of all links a term has with other terms. Seven of the top 20 terms belonged to cluster 2, highlighted in green in Figure 7, which was identified as the central cluster for graphical processing.
Clusters of terms as indicator of research areas
In the terms map, each cluster indicated closely related terms that were frequently used in publications on visualizations in computer graphics. This result may be used as an indicator for the recognition of main research areas within the field of visualizations in computer graphics.
Cluster 1—search queries and data searching (Red)
The red cluster formed around the term “query” (occurrence 557), which connected 1,556 nodes, and the frequency of which was the first among all the terms. Overall, this term was closely linked to core terms of other clusters. The red cluster thematically converged around search queries, including syntax, semantics, web browsers and applications, programing languages and environments. The main co-occurring terms of this cluster were: query; robot; programing language; notation; semantic; programmer; visual languages; ontology; windows; web browser; web application; xml; SVG; API; data model; syntax; development environment; visual simulation; formalism; programing environment; browsers; debugging; web service; voltage; grammar.
Cluster 2—graphical processing (Green)
The prevailing topic in the green cluster was graphical processing. The most frequent term in the green cluster was “GPU”—graphic processing unit (occurrence 1,115), which connected 2,451 nodes. The terms following were “rendering,” “scene” and “camera,” the frequencies of which were among the first ten of all terms. The main co-occurring terms of the green cluster were: GPU; rendering; scene; camera; pixel; textures; graphics hardware; segmentation; openGL; approximation; ray; CPU; realism; computer vision; visual quality; augmented reality; volume rendering; compression; terrain; interpolation; human visual system; real time visualization; meshes; vertex; triangle.
Cluster 3—education (Blue)
The blue cluster dealt with education related to graphics. The most frequent term was “students,” its frequency (1,822) being the first among all terms, followed by the terms “skill” and “teaching.” The main co-occurring terms of the blue cluster were: students; skill; teaching; score; child; teacher; graphic design; artist; learner; classroom; significant difference; school; culture; interview; speech; society; book; curriculum; instructor; story; educator; questionnaires; identity; attitude; visual communication.
Cluster 4—genetics (Lime green)
The lime green cluster focused on genetics. Among the 961 terms in this cluster, the term “gene” had the highest occurrence (421). The main co-occurring terms of the genetics cluster were: gene; annotation; proteins; species; molecule; pathway; alignment; genome; variance; spectra; classifier; PCA; organism; regression; Linux; compound; yield; biologist; specificity; html; drug; outlier; scatter plot; sequencing; motif.
Cluster 5—scientific numerical data (Purple)
The largest node in the purple cluster, which mainly converged around scientific numerical data, was the term “equation,” which connected 2,035 terms in this cluster. The important co-occurring terms in this cluster were: equation; temperature; particle; concentration; coefficient; velocity; wave; fluid; stress; thickness; solver; numerical simulations; restriction; plate; diameter; beam; computational fluid dynamic; boundary condition; flow visualization; optic; radiation; numerical result; air; numerical method; heat.
Cluster 6—medicine (Light blue)
The light blue cluster was related to medicine. “Patients” was the largest node term (occurrence 1,063), which connected 2,377 nodes. The important co-occurring terms in the medicine cluster were: patients; imaging; disease; surgery; stimuli; brain; MRI; anatomy; scan; slice; care; therapy; disorder; registration; clinician; surgeon; tomography; tissues; arm; hospital; amplitude; scanner; lesion; organ; vessel.
Conclusions
Bibliometric methods were used successfully to explore the wide and ever growing area of VCG. Science mapping analysis adapted from Cobo et al. (2012) enabled the identification of the global research output, most relevant/influential papers, most prolific authors, most important sources, collaboration networks, and main research contents of the VCG research field.
A dataset of journal articles and conference proceedings from Scopus database was collected in June 2020 for the time period from 1986 to 2019, when documents for the previous year had already been entered into the database. In the acquisition of data, the validation and optimization of the search strategy proved to be essential for obtaining a reliable basic data set. The preprocessing phase was crucial to improve the quality of the initial raw data set for the science mapping analysis. VOSviewer software was successfully applied for science mapping visualizations.
Global Research Output and Growth
The annual document number analysis, performed by the Scopus bibliometric tool, revealed a rising trend of the field, reaching more than 2,300 of new publications related to visualizations in computer graphics in 2019. Scientific journal articles outnumbered conference papers in all years, except for the ten-year period between 2002 and 2012, when the conference papers exceeded the journal articles and played a particularly important role in VCG.
Most Relevant/Influential Documents
The analysis of documents exposed the fact that the most cited five publications in VCG all related to software programs and packages for visualizations in different areas, for example biopolymers chemistry, crystallography, neurology, and bioinformatics.
Most prolific authors, determined by CPP and RCI indexes, contributed substantially to research advances in computer graphics, information visualization and interactive data analysis, human computer interfaces, and visualization software development. The most cited author worked in the field of computational biophysics and participated in development and distribution of software for computational structural biology.
Most Important Sources
Conferences have been known among visualizations in computer graphics specialists as important, bringing quality new information on research developments in a fast way. Therefore, it was not surprising that among the ten most prolific sources in VCG five were conference proceedings. However, articles published in scientific journals had a higher citation impact. In many scientific environments, higher citation frequency and international visibility are perceived as higher scientific excellence. From this perspective, scientific articles outweighed conference papers. Seven clusters of thematically similar scientific journals that appeared together in references were recognized in the network visualization map of the co-citation analysis. Their thematic areas consisted of computer science, genomics and nucleic acid research, neuroimaging, physics & chemistry, mathematics, education, and communication.
Collaboration Networks
Co-authorship analysis of countries showed that the USA, UK, Germany, France and Italy collaborated most in VCG. Collaborations fostered by the same language group, such as french or spanish-speaking countries, or due to geographical proximity, such as Asian countries, were also noticeable.
Main Research Contents and Areas in VCG
The content analysis, performed by the co-occurrence of terms extracted from titles and abstracts of the analyzed publications, might be among the most interesting results for professionals in the field, as the results provide insight into the landscape of research areas in VCG. In the terms map, six clearly identified clusters suggested that computer visualizations have been mostly important and applied in: (1) search queries and data searching, (2) graphical processing, (3) education, (4) genetics, (5) scientific numerical data, and (6) medicine.
The field of VCG is a typical example of an extensive, diverse, rapidly evolving, and consequently not yet very clearly structured area. Therefore, the study can contribute to a better understanding of the field, supporting researchers, educators and other experts on VCG in the identification of research areas and developments, high quality scientific literature, and selection of most appropriate journals to publish their own findings.
The authors are also aware of some potential limitations. This research could be continued and upgraded in the future. To expand the study breadth, other databases and aggregation search engines with a broader spectrum of document types could be used for comparison. Inclusion of patent documents and professional/marketing articles would highlight industrial inventions and market developments. In addition to the VOSviewer software, other bibliometric mapping tools, such as SciMAT, CiteSpace or Bibexcel could be applied to analyse and display additional visual insights. The time trends in research and development could be examined in more detail, especially for the three periods depicted in Figure 2 - the initial period until 2001, the predominance of conference papers from 2002 to 2012, and the last period with a new rise of scientific journal articles after 2013, to expose the breakthroughs in research fields that are just beginning to emerge and provide important guidance for new research and project funding applications.
Footnotes
Acknowledgements
The authors would like to thank Barbara Luštek Preskar for proofreading the manuscript.
Declaration of Conflicting Interests
The author(s) declared no potential conflicts of interest with respect to the research, authorship, and/or publication of this article.
Funding
The author(s) disclosed receipt of the following financial support for the research, authorship, and/or publication of this article: This work was partially supported by the University of Ljubljana, grant no. 704–8/2016–214 and Slovenian Research Agency, Programme P2-0213.
An Ethics Statement
Not applicable, because this article does not contain any studies with human or animal subjects.