
Abstract
Evaluating digital competencies has become a topic of growing interest in recent years. Although several reviews and studies have summarized the main elements of progress and shortcomings in this area, some issues are yet to be explored. Very little information is available about the ways of ensuring the validity and reliability of the instrument used. This study addresses this issue through systematic mapping covering the period from January 2015 to July 2020. Based on 88 primary studies, we conclude that a growing number of studies have emerged over the years; most of them are based on European university students in social science programs; the quality of the journals where they were published is low; and the instruments used are mostly questionnaires and ad-hoc surveys that measure the various dimensions of digital competence based on participants’ perceptions. Out of the eight possible types of quality assessment, studies commonly report only four (one in the case of reliability and three in the case of validity). More than 50% of the studies do not provide evidence of having assessed the reliability and validity at the same time. Although participant discipline resulted in a significantly association with the practice of reporting reliability and validity assessments, no specific dimension explained such association. A non-parametric multivariate analysis reveals, among other interesting patterns, that the practice of not reporting quality assessments is more present in studies where participants belong to the fields of Engineering and Technology, Health Sciences, and Humanities.
Introduction
Today, it is difficult to ignore the depth with which information and communication technologies (TICs) have impacted our society (Fernández-Portillo et al., 2020). ICTs have not only transformed the way we communicate (Tausczik & Huang, 2020) but also the way we inform (De Paor & Heravi, 2020), work (Phuyal et al., 2020), and educate (Kalolo, 2019) ourselves. So, it is important that both current and future citizens have the necessary digital competence to achieve adequate inclusion in this increasingly technological world (Ferrari, 2012). Education has, in this context, a crucial role to play (Ilomäki et al., 2016; Pettersson, 2018). In particular, higher education should ensure that future graduates achieve adequate digital literacy (Torres-Coronas & Vidal-Blasco, 2015). This implies the inclusion of curricular strategies to achieve such literacy among the members of the educational community (Reisoğlu & Çebi, 2020) as well as the assessment of the level of assimilation of digital competence (Rivas et al., 2019).
This task of evaluating digital competence implies the creation of appropriate instruments (scales) that allow it to be measured correctly. From the psychometric point of view, the instrument must have an adequate level of reliability and validity to guarantee the quality of the measurements (Bandalos, 2018; Golafshani, 2003). Although the scientific literature contains valuable contributions where digital competence in higher education is evaluated, very little is known about the evaluation process itself. In particular, existing review studies such as (Pettersson, 2018; Spante et al., 2018) have focused on other topics that are also important but do not involve the assessment process, much less the quality of the instruments used. Therefore, little is known about the extent to which the experiences reported in the literature guarantee the quality of the instruments used to assess digital competence. We believe that an adequate characterization of the literature based on this aspect would have important implications for both researchers and practitioners. Among other things, it would provide an overview of the main trends seen in the case of this topic, the degree of diffusion in the practice of reporting quality assessments of the instruments, and more specifically, it would help us know which characteristics of the studies can explain some of these practices. On the other hand, the practitioners involved in the assessment of digital competence in educational settings will be provided with a global overview of the quality of existing instruments.
In order to close this knowledge gap, we developed a systematic mapping study Petersen et al. (2015) covering the period from January 2015 to July 2020. In this study, a total of 88 studies were selected, analyzed, and classified. Statistical analyses were conducted to identify which variables in the studies could explain their reporting practices on these psychometric assessments. Some important implications are discussed in this paper.
It is worth noting that our study extends the results obtained in a previous investigation (Saltos-Rivas et al., 2020) in three important directions with the aim of obtaining a more comprehensive and precise characterization on this topic. First, we have considered a longer period of publication time in the review (starting in 2015), in this way more studies were included in the mapping. Second, we have reported the specific methods used by the studies to perform the reliability and validity assessments. Thus, the researchers will have a more specific summary about the way in which these psychometric evaluations are developed in this field. Finally, we have expanded the association analysis dedicated to explaining the reporting practices of the studies, that is, by fitting a decision tree. As a consequence, relevant patterns were identified.
Related Works
Over the years, various definitions have been provided about what digital competence is in higher education settings (Ilomäki et al., 2016; Pettersson, 2018; Spante et al., 2018). One reason of such diversity is that it is a context-dependent definition (Spante et al., 2018). As a result, we can find definitions both in the scientific context (Tsankov & Damyanov, 2017) and within government policies (Pettersson, 2018).
In this latter case, a comprehensive definition was given by Ferrari (2012) when defined digital compentence as “the set of knowledge, skills, attitudes, strategies, and awareness which are required when ICT and digital media are used to perform tasks, resolve problems, communicate, manage information, collaborate, create and share content, and build knowledge in an effective, efficient, and adequate way in a critical, creative, autonomous, flexible, ethical, and a sensible form for work, entertainment, participation, learning, socialization, consumption, and empowerment.”
From a scientific context, Ilomäki et al. (2016) defined it as the composition of “(1) technical competence, (2) the ability to use digital technologies in a meaningful way for working, studying, and in everyday life, (3) the ability to evaluate digital technologies critically, and (4) motivation to participate and commit in the digital culture.” (p. 655).
Other researchers have taken a different approach by relying on frameworks that seek to establish the knowledge and skills necessary for an individual to be considered (or not) digitally competent. Two notable examples of this are (Prendes et al., 2018) and (Johnson et al., 2010). In this line, perhaps the most popular one is the Digital Competence Framework for Citizens (DigComp2.1), which was proposed by the European Commission (Carretero et al., 2017).
Regardless of the diversity present in these definitions, most of them agree that digital competence must be developed and evaluated taking into account: knowledge, skills, and attitudes (Spante et al., 2018).
Related to our research, there are several contributions in the literature. However, it is important to note that none of these studies addressed the psychometric properties of the scale employed to measure digital competence, except for our previous work (Saltos-Rivas et al., 2020). The important reviews conducted by Ilomäki et al. (2016), Henríquez Coronel et al. (2018), Prendes et al. (2018), Spante et al. (2018), Gibson and Smith (2018), Pettersson (2018), Reis et al. (2019), López Núñez et al. (2020), Rivas et al. (2019), Palacios Hidalgo et al. (2020), Sánchez-Caballé et al. (2020) are relevant examples of such studies.
Of these reviews, only (Lopes Pereira et al., 2019; Rivas et al., 2019; Saltos-Rivas et al., 2020; Spante et al., 2018) addressed the evaluation of digital competence in one way or another. Spante et al. (2018) were mainly focused on analyzing the concept of digital competence in higher education. However, regarding the evaluation process, the authors only considered some related aspects: the method for data collection and the knowledge area of the participants. They concluded that most of the works reviewed used mixed methods for data collection and are based on populations belonging to different disciplines. More recently, Lopes Pereira et al. (2019) identified that universities do not consider aspects such as security and content creation during digital competence training. However, other specific aspects of the evaluation process were not addressed by this study. Rivas et al. (2019) estimated through a meta-analysis the proportion of digital proficient in higher education institutions in Latin America. As a result, the authors found that 64% of the participants (students and academic staffs) were digitally proficient.
Finally, in our previous research (Saltos-Rivas et al., 2020) we focused on issues similar to those that motivate the present work. From a systematic mapping study on 60 journal articles from 2018 to July 2020, it was possible to conclude that majority of these experiences: came from Asia or Europe; were based on Social Science participants; used scales composed by cognitive items for diagnosing purposes; and were published in low-level venues. In addition, we concluded that about 50% did not report these psychometric assessments. In relation to the latter, we found that being published in low-level venues in conjunction with administering scales only, were two characteristics associated with not conducting psychometric assessments. Regardless of the progress of this work, it has important limitations. On the one hand, it was based on a sample of studies from a very short period of time. This clearly affects the internal generalizability of the results, as the trends and patterns found for this set of studies may not hold for a larger sample (e.g., studies published over a longer period of time). On the other hand, it did not consider what specific methods the studies employed to conduct the reliability and validity assessments. Thus, the overview provided turned out to be very general. Finally, the method used to find patterns that explain in which types of studies certain reliability and validity reporting practices occur was based on univariate analysis. Thus, it is not clear whether the combination of several characteristics could provide more precise explanations for these practices.
Reliability and Validity
Reliability and validity are two important psychometric properties of a scale in social sciences (de Souza et al., 2017; Furr, 2011). They refer to the ability of an instrument to provide consistent and accurate measurements, respectively. According to Bannigan and Watson (2009), these properties group can be verified in a given instrument through specific assessments. Regarding reliability, the assessments comprise Stability, Internal Consistency, Equivalence, and Scalability, while for validity, Face validity, Content validity, Criterion validity, and Construct validity. From this perspective, reliability and validity can be viewed as two general groups of quality assessments.
Ideally, a study about the development or administration of an instrument should include enough evidence about the aforementioned assessments (Bandalos, 2018; Mueller & Knapp, 2019). However, in some cases it may not be possible to conduct all assessments due certain research limitations. A good practice here is to carry out at least one evaluation for each group (reliability and validity), regardless of whether the instrument of interest has been evaluated in a previous study (Furr, 2011). As noted by Furr (2011), these two properties have important implications for the proper interpretation and meaning of the results obtained in the research: (1) the quality of the measures affects the apparent size of the effects obtained in the analyses, (2) “by affecting the sizes of statistical effects, the measurement quality indirectly affects the statistical significance of those effects” (Furr, 2011, p. 2), and (3) the quality of the measures (and manipulations) affects the meaning of the obtained results.
Method
In this work, we adopted the guide proposed by Petersen et al. (2015) on conducting systematic mapping studies. According to Petersen et al. (2015) the main steps of this methodology are: planning, conducting, and reporting the mapping. Below we provide details about how the first two steps were carried out, while the third one was completed by writing this paper.
Research Questions
The overall objective of this paper is to provide an overview of how psychometric evaluations have been conducted by the literature evaluating digital competence in higher education. To do this, the following research questions were formulated:
(RQ1). What features characterize the experiences reported by the studies?
(RQ2). How are reliability and validity assessments reported?
(RQ3). Which features explain the reporting practice of the studies?
Search
To develop the search for studies relevant to our topic, we have relied on our previous work (Saltos-Rivas et al., 2020). Specifically, the following query was considered:
(“digital competence” OR “digital literacy” OR “digital literacies”) AND (undergraduate OR postgraduate OR freshmen OR sophomore OR junior OR senior OR pre-service OR teacher OR junior OR university OR “higher education” OR college OR tertiary OR “academic staff” OR professor OR lecturer) AND (evaluate OR assess OR appraise OR validate OR evaluation OR assessment OR appraisal OR validation OR evaluating OR assessing OR appraising OR validating)
As we proceeded in our previous study (Saltos-Rivas et al., 2020), the above query was used to search three databases that cover an important part of the literature in the field of Educational Sciences Spante et al. (2018), Granić and Marangunić (2019). Such databases were Scopus, Web of Science, and ERIC. Specifically, the query was applied to the documents’ metadata: title, abstract, and keywords. As a result, we obtained 466 records from Scopus, 309 from Web of Science, and 239 from ERIC, totaling 1014 records.
Selection of the Studies
The selection of the primary studies was carried out through the steps illustrated in Figure 1. In order to obtain an up-to-date, quality sample of studies on digital competence evaluation in higher education, several inclusion and exclusion criteria were considered in the selection process. It is worth noting that they were applied not only after the search, but also throughout the rest of the steps of the selection process (Figure 1). Specifically, these criteria were:

Selection process of the studies.
Inclusion Criteria:
Studies that measure digital competences quantitatively in the context of higher education.
Studies issued in the period from January 2015 to July 2020.
Studies published as peer-reviewed journal articles.
Exclusion Criteria:
Studies published as conference proceedings, book chapters, books, technical reports, and editorials.
Non-peer-reviewed articles.
Studies that are not accessible in full text.
Duplicates of other studies.
In order to reduce selection bias, the steps Title and Abstract Screening and Full-text Reading were performed independently by the first and second authors.
Data Extraction
We performed the data extraction using the template depicted in Table 1. As observed, studies were characterized by 11 variables related to their demographic and methodological features. We also considered the reliability and validity reporting practices of the studies through eight types of assessment (four for each group), following the suggestions made by Bannigan and Watson (2009). Here, as we did in (Saltos-Rivas et al., 2020) we defined four reporting levels: Not reported, Only mentioned, Referenced (a previous study with enough details is referenced), and Detailed (sufficient details are provided by the study). To characterize the study overall reporting practice, four other variables were defined: Only reliability, Only validity, Reliability or validity, Reliability and validity. These variables take one of the two possible values: No report, Report. Finally, we included a variable (Method) to extract the specific methods used in the study to perform one of the eight types of assessment.
Variables and Dimensions Used for Data Extraction.
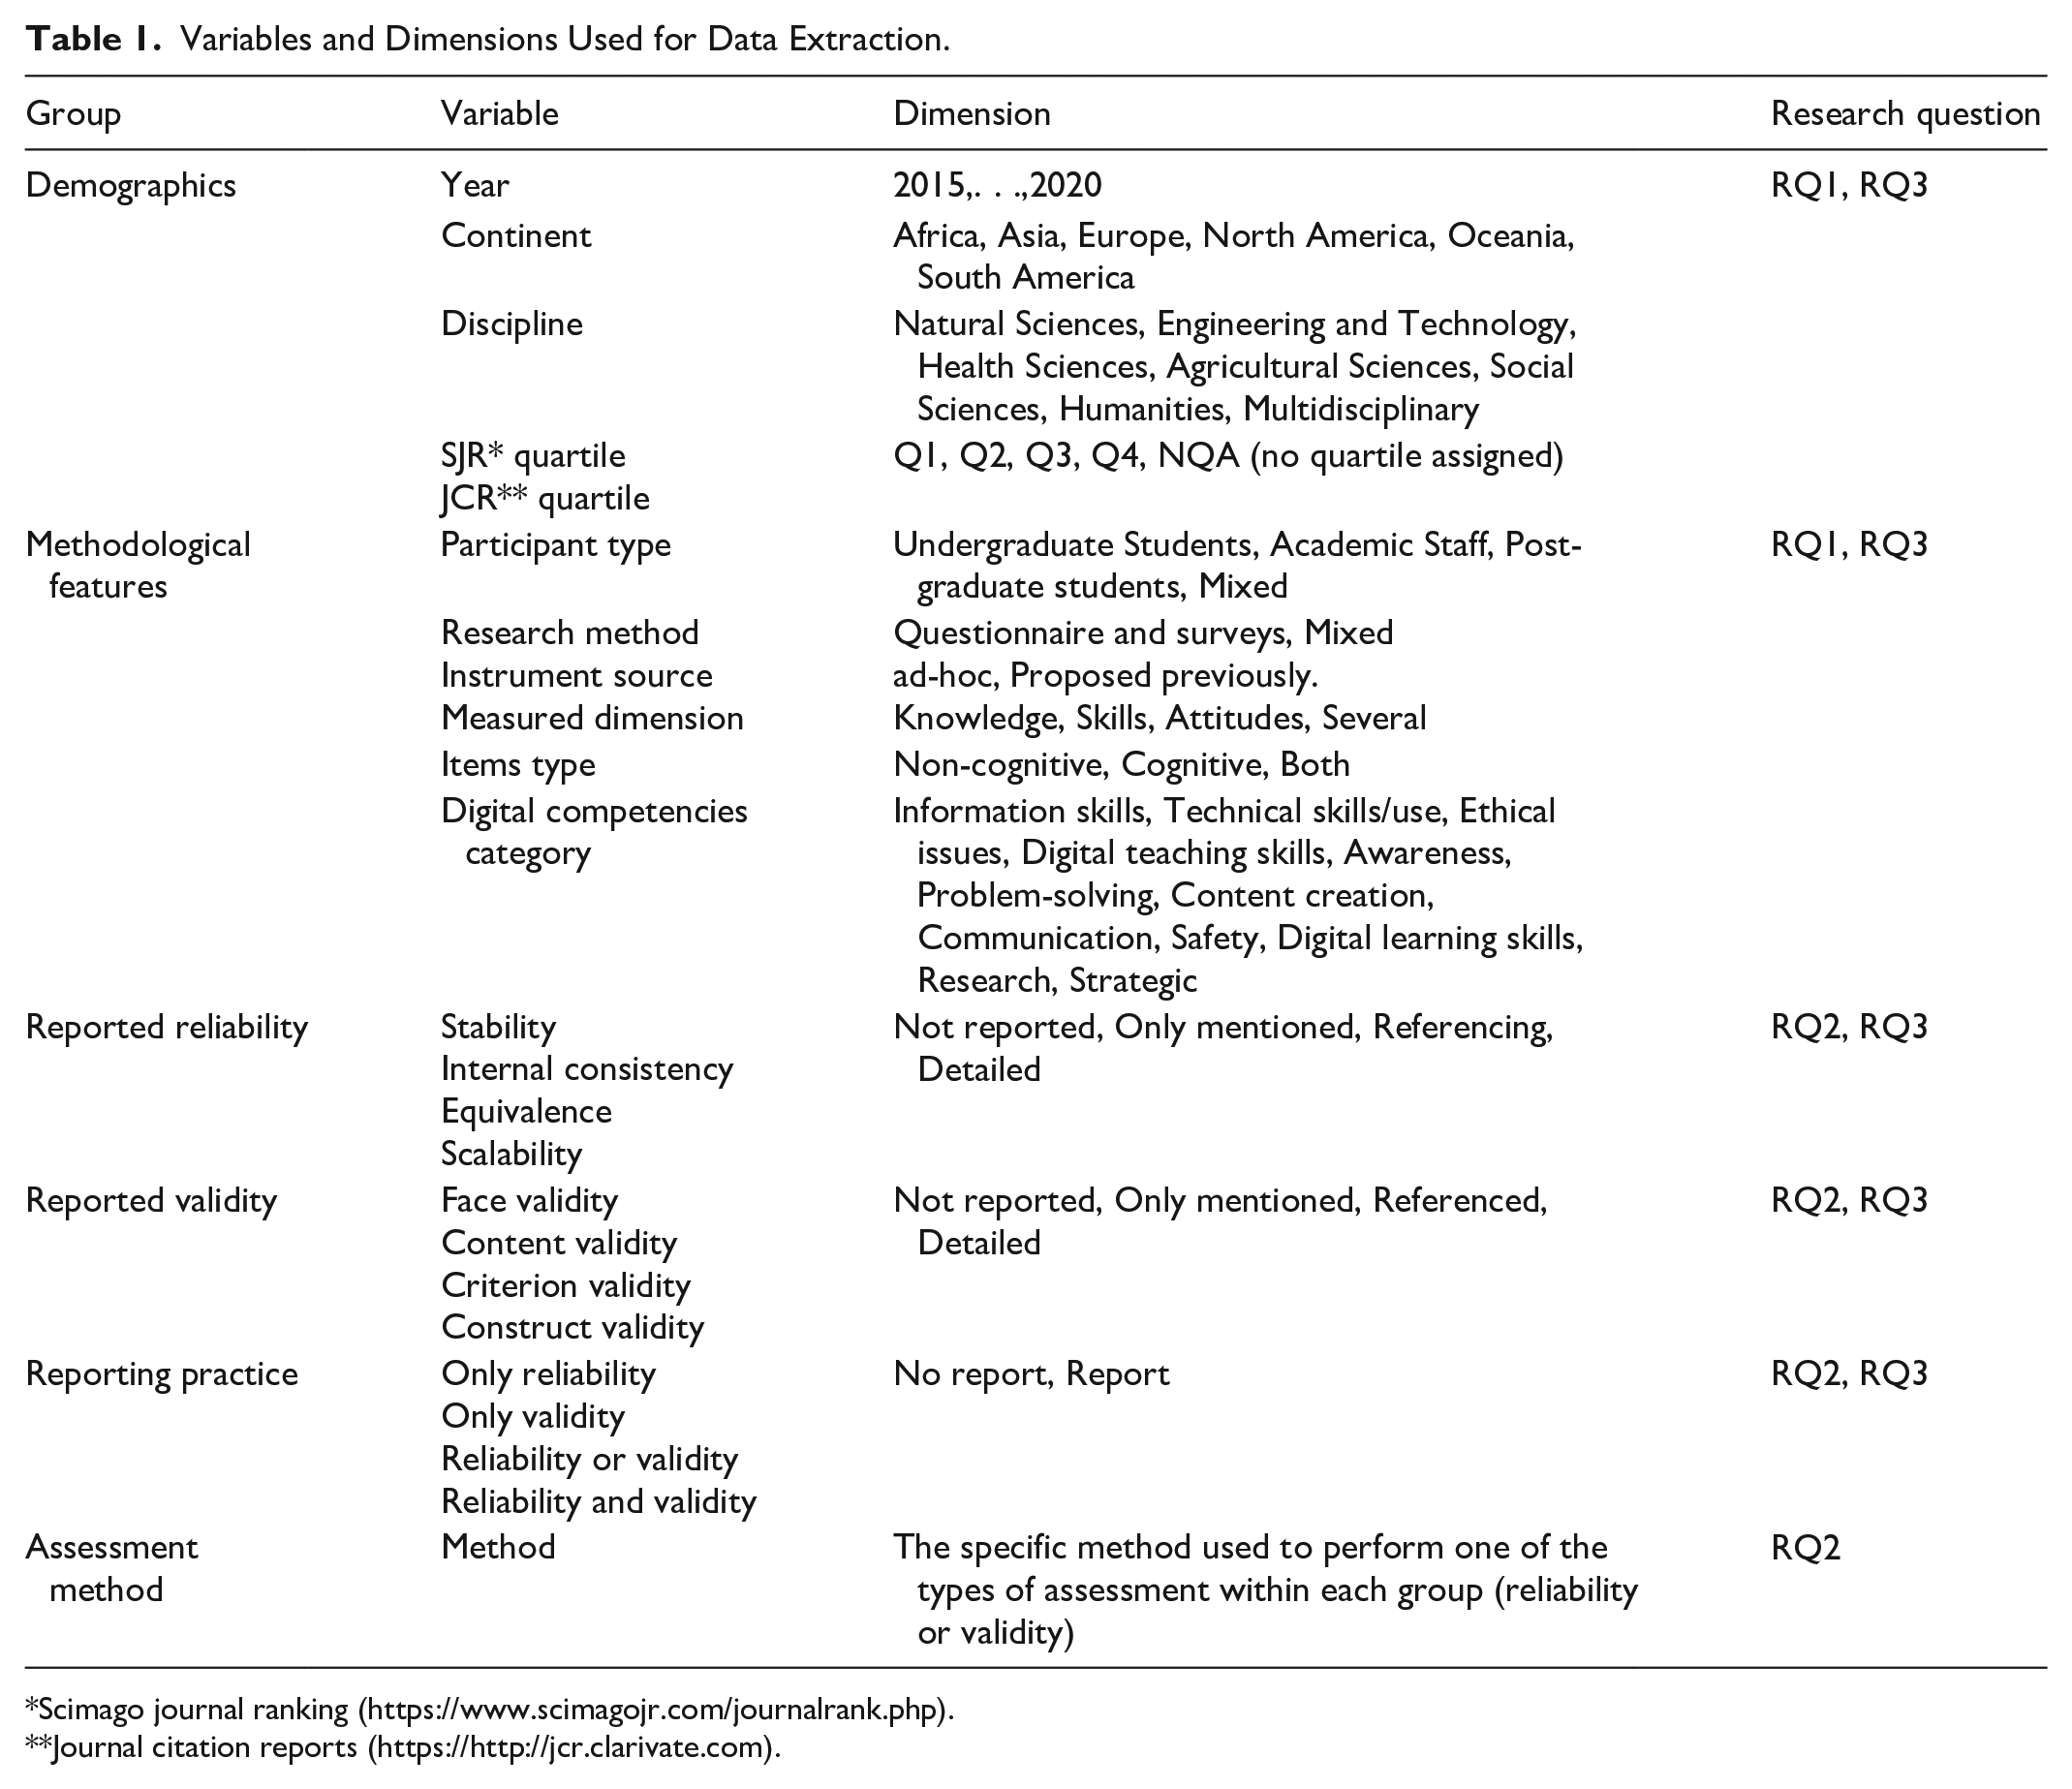
Scimago journal ranking (https://www.scimagojr.com/journalrank.php).
Journal citation reports (https://http://jcr.clarivate.com).
Analysis and Classification
After data extraction, the resulting 88 studies were analyzed and classified. As a result, a list of classified studies was obtained using the template in Table 1. These tabulated data can be accessed online at http://shorturl.at/rBQ24. In this online resource we have also included as an additional variable the framework (or previous work) from which the instrument for evaluating digital competencies was derived. Of course, this was done for studies whose Instrument source was classified as Proposed previously (see Table 1). Since we have relied on a spreadsheet (Google Sheets), the interested reader can easily filter the data to achieve interesting mappings with this and other variables.
To answer RQ3, we proceeded as follows. First, a Pearson’s Chi-squared test of independence was performed in order to analyze association between the demographic and methodological variables and the variable Practice. This is nonparametric test that is widely used for identifying the association between the categorical variables (Franke et al., 2011). Second, a post-hoc test was conducted on those variables that had a significant association in order to identify the specific dimension for which such associations occur. It is important to mention that in this analysis we have excluded the variable Digital competencies category because its levels do not have a one-to-one relationship with the studies. In other words, the studies addressed a variable number of digital competencies. Therefore, the data cannot be adequately partitioned to perform the analysis with the methods mentioned above.
Finally, with aim of identifying the combination of variable dimensions that explain the reporting practices of the studies, we used a classification tree (Breiman et al., 1984). This is also a nonparametric technique that is used to build a decision tree based on the data (Loh, 2014). Visually, each leaf is a class label while a branch is a conjunction of features leading to a class label. In our study, the class is the practice adopted by the study that includes the reporting of both reliability and validity assessments at the same time (variable Reliability and validity). So, the class labels are No report and Report. To build the decision tree, we relied on the R package rpart proposed by Atkinson and Therneau (1997). More specifically, we conducted a computational experiment over two hyperparameters of the decision tree in order to find the best model in regard to four indicators: accuracy, significance of the accuracy, Cohen’s kappa, and significance from the McNemar’s test.
It is important to note that other models of multivariate statistics (Pituch & Stevens, 2015) would have been applicable here (e.g., binary logistic regression). However, most of them are sensitive to the sample size. Since we relied on a small sample in this study, we considered it appropriate to use a nonparametric model that achieves a balance between precision and parsimony. In other words, we were looking for a model that is unaffected by sample size, describes the data as accurately as possible, and provides easily interpreted explanations. This was achieved by using decision trees (Zaki & Meira, 2020).
Validity Assessment
Following the indications provided by Petersen et al. (2015) we proceeded to assess the validity of our systematic mapping study. This assessment is carried out by identifying sources of threats in five types of validity and reporting what strategies the study adopted to mitigate them.
Descriptive validity
The fact that subjective studies (such as ours) have lower levels of descriptive validity than quantitative ones, is the main threat here. However, since our study is based on the extraction of structured information (e.g., following the template in Table 1), this threat is considered to be controlled. Thus, we conclude that our study has sufficient descriptive validity.
Theoretical validity
Two important sources of threats in this case are study selection and data extraction. In this regard, to avoid exclusion of relevant studies, we applied snowball sampling as indicated in Figure 1. In addition, two authors participated independently during the selection process. This allowed us to reduce selection bias. Finally, the data extraction (carried out by one of the authors) was reviewed by the other two to ensure the consistency of the results.
Generalizability
In order to analyze this type of validity, it is necessary to take into account the level of internal and external generalizability of our study. Specifically in relation to the methodology and the results obtained from it. In the first case, it is easy to conclude that the methodology has both internal and external generalizability. The main reason behind this statement is that it is based on a systematic method Petersen et al. (2015) that has been applied in different contexts. In the case of the results, on the one hand, it can be said that they can be generalized in the context of higher education, since they come from an important sample of literature on the subject. Thus, it can be concluded that they have a high degree of internal generalizability. On the other hand, we cannot affirm that they can be generalized externally, that is, to contexts such as the evaluation of digital competence in the field of education or in the definition of government policies.
Interpretive validity
Since all authors have worked together on previous studies, a threat occurs. Similar judgments might be made while selecting and analyzing the primary studies.
Reproducibility
This type of validity is guaranteed because a well-structured guideline was followed and enough details were provided in the supplementary materials.
Results
In this section, the results obtained from the research are presented. They are organized according to the research questions formulated previously.
(RQ1). Characteristics of the studies
Figure 2 shows the main features of the studies. It may be noted from Figure 2a that most of the studies were published in 2019 (26%). Moreover, it can be observed from Figure 2b that both Europe (43%) and Asia (31%) are the main sources of reported experiences. Students and teachers related to the Social Sciences discipline constitute by far the most studied population (53%), as shown in Figure 2c. In regard to the quality of the venue, Figure 2d shows that the works were issued in journals with quartile Q1 and Q3 (28%). A different situation occurs in the case of the JCR indicator (Figure 2e) where 69% were issued in venues not indexed.

Demographics and methodological features of the studies.
From Figure 2f, it can be observed that undergraduate students are the most studied population (62%). As shown in Figure 2g, questionnaires and surveys are the most common research methods (76%) with only a few studies relying on mixed methods (24%). The research methods employed instruments proposed for the first time in the study in 69% of the cases (Figure 2h). Figure 2i shows that most of these instruments are devoted to measuring several areas of digital competence (80%). Non-cognitive items were included in these instruments in the case of 65% of the studies (Figure 2j).
Finally, Figure 3 shows how the studies are distributed according to the digital competencies category. As can be seen, the two categories most addressed by the studies were Technical skills/use and Information skills. Both exceed 50% of the studies. Note also that there are two categories related to higher education that have been analyzed by several studies: Digital teaching skills (22.7%) and Digital learning skills (15.9%).
(RQ2.) Reporting reliability and validity assessments

Distribution of studies by digital competencies category.
Figure 4 summarizes how studies reported the reliability and validity assessments. From the plot in Figure 4a, we can observe that reliability is assessed through internal consistency in most of the cases (49%). It can be observed that 44% of these studies provided details in the text, while 5% relied on referencing previous studies. Equivalence is another type of reliability assessment that was reported by 7% of the studies. Both, Stability and Scalability were the lesser reported types of assessment. In the case of the first one, 98% of the studies did not report it, while in the case of the second one, 100% of the studies failed to report it.
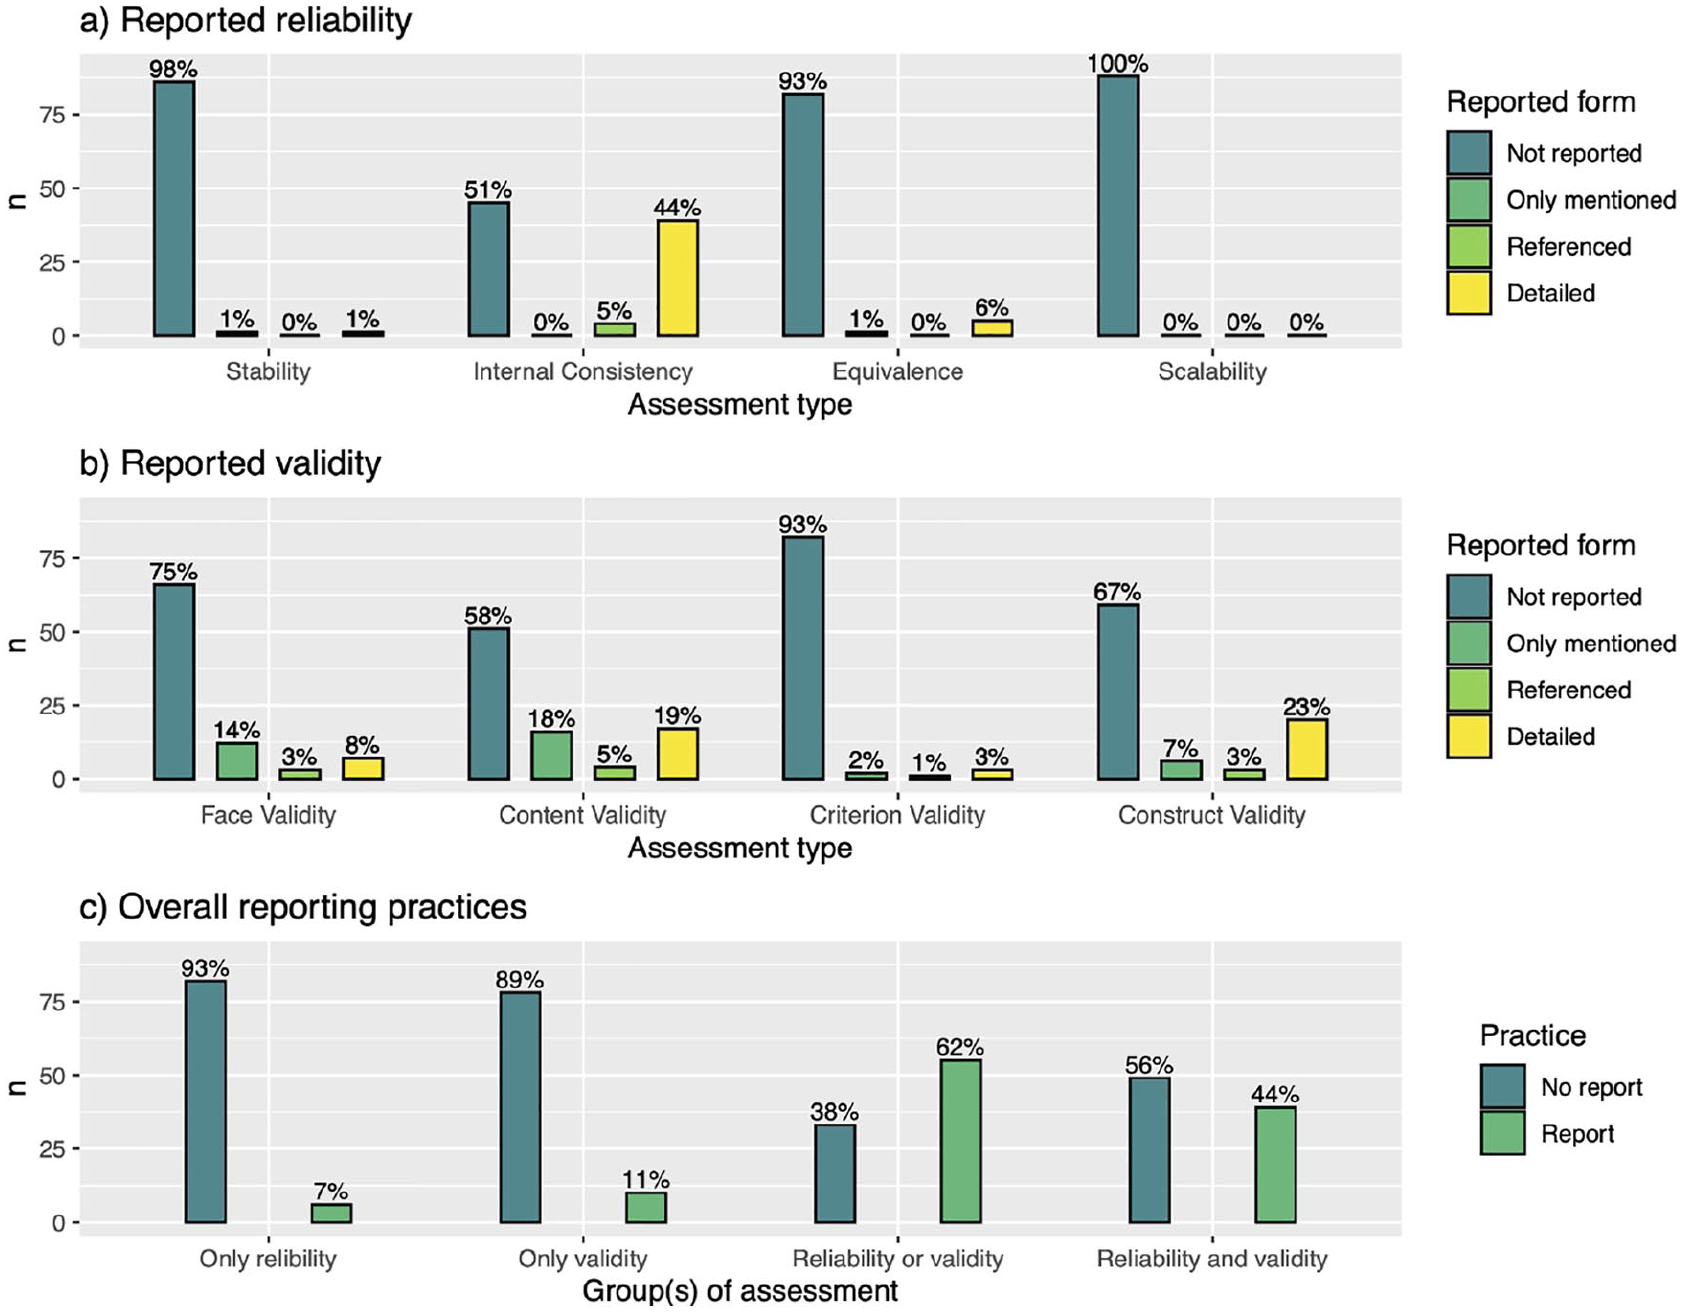
Reporting practices of reliability and validity while evaluating digital competence in higher education.
In the case of validity, Figure 4b shows a different pattern. It is evident that the studies relied on a more heterogeneous set of assessments. Face validity was reported by 25% of the studies. However, only 8% provided detailed evidence. Content validity was reported by 42% of the studies. In this case, 19% provided enough details. In contrast, criterion validity was conducted by only 7% of the studies. Among them, only 3% conducted it in a detailed manner. About 33% of the studies assessed validity through construct validity. Sufficient details about this assessment type were provided by 23% of the studies.
With the aim of providing a more general picture of the reporting practice of the studies, Figure 4c summarizes the aforementioned results. In this plot, we aggregated the results in four different categories, as defined in Table 1. It should be noted that 7% of the studies only reported reliability assessments, while 11% only reported validity assessments. Additionally, 62% of the studies reported reliability or validity assessments, and 44% reported both groups at the same time.
The specific methods that were employed by the researchers while conducting reliability and validity assessments are shown by Figure 5. According to Figure 5, a Cronbach’s alpha is the most common method for reliability assessment (82%) and,ore specifically, for assessing the internal consistency of the instrument. Cohen’s kappa, a popular statistic for quantifying agreement, was used for assessing equivalence (10%). Consistent with the results in Figure 4c, we observe in Figure 5b a greater diversity of methods for assessing validity. Expert judgment and Exploratory/Confirmatory Factor Analysis (EFA/CFA) are the most commonly reported methods. It should be noted that 35% of the studies employed Expert judgment for assessing the content validity, while EFA/CFA was used by 26% of the studies for checking the construct validity of the instrument.
(RQ3). Explaining the reporting practice
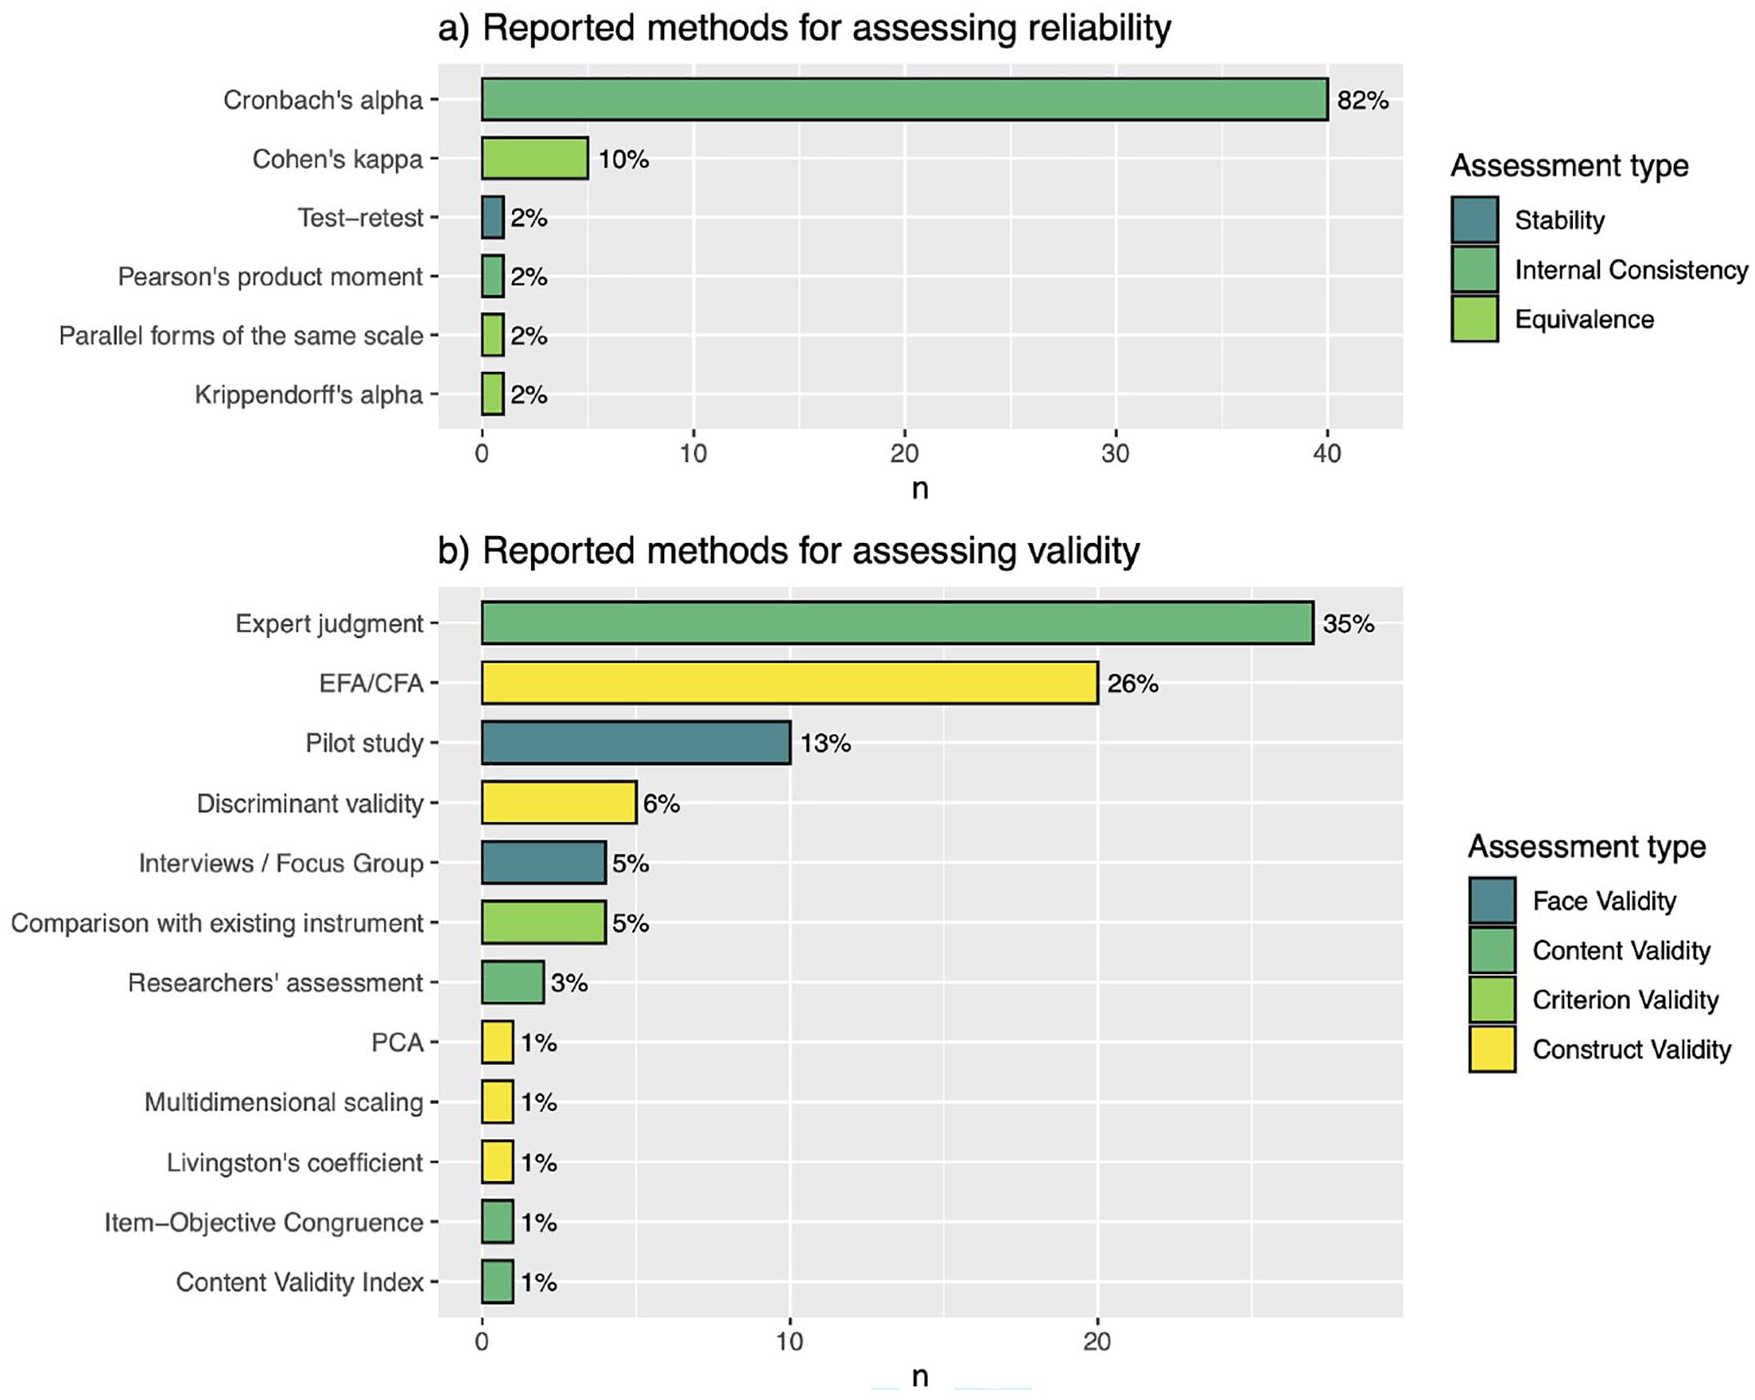
Specific methods reported.
To answer this question, we first conducted several Pearson’s Chi-squared tests of independence, one for each demographic and methodological variable versus the variable Reliability and validity. The results in terms of
Results from the Pearson’s Chi-Squared Test Between Demographics and Methodological Variables Versus the Variable Reliability and Validity.

In addition to the previous analysis (conducted for each variable individually), we fit a decision tree by using the demographic and methodological variables as predictors for Reliability and validity. Figure 6 shows the resulting model. Here, each node contains information about three aspects related to the classification process before the split is performed. First, the most likely class label (No report, Report) is shown. Second, each node includes the probability of being classified as Report (positive class label). Finally, the lower part of the node shows the percentage of studies covered by the decision rule derived from the concatenation of previous predicates. These predicates are shown in bold text in the lower outer zone of each node (except for those end nodes that are located at the bottom of the tree). It is important to note that the predicate concatenations (branches of the tree) are performed by using the Boolean operator AND.

Decision tree for predicting variable Reliability and validity.
It can be observed that this decision tree is consistent with the results from the previous analysis (see Table 2). Discipline is the most important variable since it is the responsible for the first split (top node), involving 100% of the studies. Before the splitting of the studies with this variable, there is a probability of 0.44 that the study will report the reliability and validity assessments (Report). However, since this probability is lower than 0.5, the dominant label is No report, as shown in this node. It should be noted that the probability of reporting (0.44) is consistent with the 44% shown by Figure 4c, which corresponds to the proportion of studies reporting both groups of assessments. It should also be noted that the split defined by the variable Discipline divides the studies into two independent groups: (1) studies with participants belonging to the fields of Engineering and Technology, Health Sciences, and Humanities (left branch), and (2) studies with participants belonging to several disciplines (Multidisciplinary), Natural Sciences, and Social Sciences (right branch).
The leaves of the decision tree (bottom nodes) indicate that 10 decision rules classify the studies. It can be seen that some rules are more complex than others, as they involve more predicates (more variable splits). Additionally, not all rules have the same level of case coverage. For example, the end node located in the lower right area of the tree corresponds to the final result of a rule that classifies a study as Report. This rule concatenates the following predicates: (Discipline = Multidiscplinary or Natural Sciences or Social Sciences) AND (JCR quartile = Q1 or Q2 or Q3) AND (Year 2018≥). This indicated that those studies that meet these characteristics have a 1.00 probability of reporting the reliability and validity. However, we saw that the case coverage of this rule is 12%. In other words, this rule allows the classification of 12% of the studies. By using a similar analysis, you can interpret the rest of the rules in the tree (Figure 6).
The quality of the prediction of the decision tree can be observed in Table 3 as the number of correct/wrong classified studies. This is the so-called confusion matrix (Zaki & Meira, 2020) in which the rows correspond to the predictions in the decision tree while the columns correspond to the reference data. As reference data, we used the same data set that was used to fit the tree. The reason for this decision was that our interest is to obtain an explanatory model instead of a robust prediction model that is capable of classifying studies not included in our review.
Confusion Matrix for the Decision Tree.

Table 3 shows that 47 studies were correctly classified as No report, while 24 were classified as Report. This indicated a prediction accuracy (observed proportion agreement) of 0.82 with a 95% confidence interval of [0.72, 0.89]. Based on a one-sided binomial test, it was observed that this accuracy is significantly higher than the proportion of the largest class (No report), which is 0.56. The obtained p-value = 2.15e-07 (<0.05) meant that the decision tree predicts better than chance. Additionally, the Cohen’s kappa computed between the decision tree predictions and the reference data was 0.63, which indicated a moderate strength of agreement (Landis & Koch, 1977). Finally, from the application of the McNemar’s test, we got a p-value = 4.53e-01 (>0.05), which indicated that the proportion of mis-classified cases for both class labels is statistically the same (Hoffman, 2019).
Discussion and Conclusion
The results described above allow us to conclude that:
The number of studies on the subject has grown over time. In particular, the number of studies published in the year 2020 (up to July) doubles the half of the previous year (2019). This indicates that if the trend continues, 2020 will end up with more studies than 2019. However, this growing trend is not exclusive to the literature on this topic but is a more general behavior in the context of higher education. While Spante et al. (2018) and Reis et al. (2019) reported similar results in the field of digital competence, studies such as (Granić & Marangunić, 2019) and (Murillo et al., 2021) did it in the context of technological acceptance and use of learning management systems, respectively.
The majority of the reported experiences came from Europe and Asia, and are based on university students who have careers in the social sciences. Other populations such as teachers have been studied to a lesser extent. Likewise, continents such as South America and Africa have been studied very little. Interestingly, experiences involving higher education institutions from several continents have appeared. Overall, this pattern was also observed by Spante et al. (2018) and by our previous work (Saltos-Rivas et al., 2020).
Most studies use questionnaires or surveys designed ad-hoc, which measure the various components of digital competence through non-cognitive indicators. These characteristics have important implications both for the field of study and the results reported. On the one hand, the abundance of ad-hoc instruments is a sign that researchers have focused more on proposing new instruments than on applying existing ones. On the other hand, measuring several components of digital competence is a positive aspect since it allows one to obtain a more integral evaluation from the participants. Finally, the fact that most of the instruments are based on non-cognitive indicators suggests that the reported digital competence is based more on participants’ perceptions and self-assessments than on objective knowledge. In our opinion, this could constitute a weakness of this field because considering oneself as digitally competent does not necessarily mean that one is so. Of course, a comprehensive evaluation should include that dimension along with some way to objectively prove that the participant has the knowledge, skills, and attitudes necessary to consider him or herself digitally competent. However, the latter requirement is not always easy to achieve, especially when the sample is very large and not under control by the researcher. So, our suggestion here is to rely on mixed research methods including both perceptions and objective knowledge as the way to guarantee a more valid measurement (Blayone et al., 2018; Hanbidge et al., 2018).
Technical and information competencies have been the most studied and, therefore, measured by researchers. This result is in line with what was previously reported by Sánchez-Caballé et al. (2020) However, our classification also revealed that there is a smaller number of studies that have focused on specific skills in the digital teaching/learning process. As a consequence, this gap is an opportunity for future research. Particularly in the current context, in which digital teaching has experienced a significant boom due to the restrictions that the COVID-19 pandemic has imposed on face-to-face teaching in HEIs.
The quality of the journals where the studies have been published can be considered high according to the SJR indicator, while it is low according to the JCR indicator. This is not entirely surprising considering the fact that SJR is a database-based indicator with greater coverage than the database from which the JCR indicator is derived (Delgado-López-Cózar & Cabezas-Clavijo, 2013). A similar pattern was found in (Saltos-Rivas et al., 2020).
56% of the studies did not provide evidence on how reliable and valid the instrument used was. Those that reported on reliability did so with emphasis on the instrument’s internal consistency, while those that reported on validity did so in three main types of evaluation: face validity, content validity, and construct validity. However, sufficient details about the evaluations performed are not always provided. We have also found that the specific methods for performing these types of assessments vary based on whether they are meant for reliability or validity assessments. While six methods were used in the first case, twice as many were employed in the second case. Regardless of these specific patterns, the key issue here is the high presence of studies that do not report these psychometric assessments. As pointed out by Furr (2011), this practice negatively affects the quality of the measurement, and therefore will have both direct and indirect effects on subsequent analyses. As a consequence, the results and conclusions of the study at hand could be questioned (Bandalos, 2018). As in our previous work (Saltos-Rivas et al., 2020), we have found that the number of studies that do not report on psychometric assessments is high.
Certain variables that characterize the studies explain the practices of reporting the reliability and validity assessments. The association analysis for each individual variable showed that only the discipline of the participants is significantly associated with the practice of reporting quality assessments. However, at the dimension level, no significant association was found. We attributed this result mainly to the size of the sample, which, while sufficient at the variable level, is insufficient at the dimensional level (Bergh, 2015). A more comprehensive analysis through the adjustment of a decision tree indicated that studies can be classified based on 7 of the 10 variables considered with an accuracy of 82%. In general, it was possible to observe that the practice of not reporting assessments is more probable in the case of studies that include participants belonging to the disciplines of Engineering and Technology, Health Sciences, and Humanities. It is also more likely to occur in the case of studies based on participants from various disciplines, Natural Sciences, and Social Sciences, as long as they are published in journals that are not indexed by JCR or have a Q4 quartile, and measure specific dimensions of digital competence. In contrast, the studies based on these last disciplines but published in journals with Q1, Q2, or Q3 with publication year of 2018 or later are more likely to report quality assessments. Although other more specific rules account for other interesting patterns (e.g., based on other variables), we believe that the most important one is precisely the one revealed by this last rule. In essence, it indicated that the tendency in recent years, at least in the case of studies based on certain disciplines and published in high-impact journals, is to report assessments of reliability and validity. This allowed us to conclude that it is highly probable that we will find these types of psychometric assessments in future studies. This is consistent with our previous findings (Saltos-Rivas et al., 2020), that is, for studies published from January 2018 through July 2020.
Implications
The aforementioned results have important implications. First, the fact that most studies are based on European university students in the social sciences is a clear indication that other populations have been studied very little. This offers opportunities for future research. Similarly, very few studies includes the assessment instruments that objectively measure digital competence through mixed research methods. Another way to contribute substantially to this field is to use such instruments and research methods.
Another important implication is that the results of the existing research should be interpreted with caution. The existence of a large number of studies that do not carry out psychometric evaluations of the instruments used allow for their results and conclusions to be questioned. Similarly, practitioners should be careful while choosing an instrument that measures the digital competence in their educational institutions. In addition to the appropriateness of the context and objectives pursued by the practitioner, the instrument should provide evidence that its quality has been evaluated.
Limitations
The major limitation of our work is related to the variables used to characterize the studies. In our opinion, there is the possibility that another set of variables will not only allow for a better characterization but also a better explanation of the practices of reporting reliability and validity. Our future work will focus on addressing these limitations in order to continue contributing to this important area of research.
Footnotes
Declaration of Conflicting Interests
The author(s) declared no potential conflicts of interest with respect to the research, authorship, and/or publication of this article.
Funding
The author(s) received no financial support for the research, authorship, and/or publication of this article.