
Abstract
Blackboard is an important Learning Management System (LMS) employed at most higher education institutions to engage and interact with students during their studies. Students within Material Science and Engineering (MSE) often use these LMS’s to absorb mathematical derivations, scientific information and submit coursework tasks. In this work, statistical analysis of the average times the MSE students spent on Blackboard during their entire Bachelor’s program period were compared to their final examination grades. Results show a positive linear correlation between the time students spent on Blackboard and their final grades. Another interesting observation was the fact that the students engage and interact more with LMS at certain periods within the week rather than performing unintentional activities. Similar to the constructivism learning theory, the results gave evidence to the fact that the more students actively engage with the LMS’s, the more they construct knowledge for themselves.
Keywords
Introduction
There have been growing usage of the Learning Management Systems (LMS) during and after the COVID pandemic era (Duin & Tham, 2020; Rabiman et al., 2020). Many higher education institutions employ the latest versions of these LMS in the delivery of lectures, interaction with students and posting information asynchronously. The impact of these LMS on students learning has not been fully investigated quantitatively and at times investigations are done in a more structured way that influences the thoughts of the participants involved in the study (Ghapanchi et al., 2020; Su & Chen, 2020). This work seeks to do the following; (1) investigate students’ choice of online tool and (2) find a possible link between the unconscious (i.e., not being aware of their actions) hour’s students spend on the online tool and their final grades to inform practice.
There have been many studies that explore student interactions with LMS in terms of the time students spent in different activities and the links to their performances (Cerezo et al., 2016; Li & Tsai, 2017). Cerezo et al. (2016) examined students’ asynchronous learning processes via an Educational Data Mining approach using data extracted from the Moodle logs of students who were grouped according to similar behaviors regarding effort, time spent working, and procrastination. They then matched their behaviors with the different levels of achievement and found that there were four different patterns of interaction with the LMS having different final marks. They concluded that clusters that are Task-oriented are efficient and high achievers because they invested a high quantity of time in their tasks than Non-Task-Oriented Group that devoted a small amount of time to work on the practical task but a large amount on theoretical contents.
Besides, Li and Tsai (2017) analyzed LMS system logs in which 59 computer science students participated in a blended learning course to learn mobile phone programing where learning materials such as lecture slides, video lectures, shared assignments and posted messages were used. They concluded that clusters such as Consistent use students and Slide intensive use students, who invested more time and effort in viewing the online learning materials had better learning and gained significantly higher homework and examination scores than the Less use students group who spent less time. In view of these investigations, it is essential to study how the number of hours spent on the LMS influences the students’ performances.
Learning Management Systems and Their Functions
Studies have disclosed that students’ motivation for accessing LMS tools vary greatly and that affect their learning performances significantly (Hwee Ling & Kan, 2020). In that study (Hwee Ling & Kan, 2020), a model of the information system was to evaluate students’ satisfaction in terms of the system quality, information quality and service quality of the LMS as well as considering the pedagogical dimensions of instructional learning, interaction qualities as well as perceived usage frequencies. In all, varied satisfactions were predicated based on the usage frequencies. From this point, it is therefore prudent to look at some of the functions associated with the LMS that enabled their usage.
A summary of the available LMS tools are shown in Table 1 and most of them come with good functionality, affordability, suitability, and limitations (Baikadi et al., 2018; Epp et al., 2020; Juárez Santiago et al., 2020; Simanullang & Rajagukguk, 2020; Tseng, 2020; Vallone et al., 2020)). From Table 1, it can be seen that apart from the many functions of the Blackboard LMS, it promotes the structuring of online discussions, allows the display of other internet platforms such as web pages, wikis, blogs, email and analytical monitoring tools (Tseng, 2020). The Massive Open Online’s (MOOCs) LMS support students’ discussions, allows quizzes and uploading of lectures materials (Baikadi et al., 2018). In addition, the MOOCs LMS enables better multiple pathways that allow forum use, lecture viewing, quizzing of students and coursework submissions for all students to ensure improved pedagogy (Ferguson et al., 2016). In regards to the Moodle LMS, it support students’ activities online by allowing videos to be embedded, discussion forums, chatting, lecture materials, and promotes the setting of quizzes (Simanullang & Rajagukguk, 2020). The Canvas LMS also enables students to download readings and participate in discussion forums (Mpungose & Khoza, 2020).
Examples of Learning Management Systems and Their Functions.

Further information from Table 1 suggests that while the Accord LMS offers a free-accessible and tailored multicultural training for school professionals (Vallone et al., 2020), Schoology enables teachers and students to create groups and courses, administer resources, integrate resources from external platforms, and present statistics of students’ progress (Juárez Santiago et al., 2020).
Currently, most universities use Blackboard as an online platform tool or LMS to store educational resources, post coursework information, give feedback, upload lecture information, and engage with the students (Almoeather, 2020; Conley et al., 2020; Naim & Alahmari, 2020). Studies on Blackboard reveal that it supports students’ engagement and improve their performances (Heirdsfield et al., 2011; Liaw, 2008; Martin, 2008; Romanov & Nevgi, 2007). In the past, Heirdsfield et al. (2011) investigated staff and students’ perceptions on using the Blackboard LMS and found that students benefited from the opportunity to engage with their peers whereas staff viewed face-to-face interactions as valuable learning experience. Martin (2008) reported that both students and instructors responded positively to the Blackboard LMS experience when he explored the benefits of Blackboard content delivery in a computer literacy course.
Previously, comparisons of Blackboard were made with other LMS’s (Biswas, 2013; Machado & Tao, 2007; Sicat, 2015).In those studies, Machado and Tao (2007) compared Moodle with Blackboard among faculty and student groups at the California State University Monterey Bay in a survey and noted that students prefer Moodle because of the ease of its usage. Sicat (2015) also recommended the use of Schoology as a blended learning tool to improve communication skills in writing proficiency and pointed out that it has the strongest potential to connect and collaborate with school stakeholders on one platform. From Table 1, it is evident that the Blackboard is a superior e-learning software that can manage course curriculums and enhance the learner’s engagement.
Purposes of This Study
Previous studies regarding the time students spent online and the possible link to their performances were done using refined course programs and having specified time frames and selected groups (Calafiore & Damianov, 2011; Cerezo et al., 2016; Li & Tsai, 2017; Romero & Ventura, 2010). This work investigates the real unconscious average time students spent online, throughout their entire years of studies, and the possible link to their final exam grades. Furthermore, this might remove any unconscious bias within the data because the students were not aware of the activity. The data for the whole group was treated without any classification. The main focus of the work is to bring out any relationship between the time students spent online and the grades obtained at the end of their course.
The work is structured as follows; Firstly, a survey was done to find out students’ preferred forms of engagement during their studies to inform practice, and secondly, find a relationship between the students’ Blackboard log in times and their final grades achieved.
Method
The investigations were performed on data received from undergraduate Material Science and Engineering (MSE) students. There were two pathways (1 and 2) of investigations as depicted in Figure 1 and these are as follows;

Investigation pathways.
The survey questionnaire was designed to include the type of program, year, type of learning style, method of learning new concepts, the preferred form of engagement, type of internal and external digital resources (see Appendix A, section 1). Responses were obtained from eighty-three (83) students but the random students had options to select multiple choices per question. An example response from a student is as shown in section 1 (Appendix A) that shows that the student was able to select all five (5) options in the learning styles, three (3) from the method of learning new concepts, four (4) options from the forms of engagement and two (2) from the internal digital in support learning. Consequently, if all 83 students in Table A1 (Appendix A) select all 5 options of the forms of engagements, there would be 415 selected items. In view of this, the results obtained in Table 1 (Appendix A) revealed 212 selected options for the forms of engagement. These constitute 46 responses for the feedback from the lecturers, 45 for Blackboard, 41 for face-to-face lectures, 39 for demonstrations, 36 for coursework, 1 for sheets received from a lecturer at start of the lecture, 1 for a podcast with much content, 1 for interactive seminars, 1 for one-to-one engagement with an academic and 1 for going over contents because of being slow learner. The same scenario applies to the results obtained for the type of internal and external digital resources used.
During the statistical analysis, the averages of the total average times for each year were calculated, as shown in Table B2 (Appendix B), in addition to some trend analysis to enable visualization of the relationships between the login times and the final grades.
Calculating Simple Moving Average
To visualize the trend of the bivariate data between the average time students spent online and their final grades, trend analysis (Esterby, 1993; Hess et al., 2001; Kivikunnas, 1998) were performed. Four (4) point simple moving average (SMA) (Educba, 2020) were calculated using the formula;

Where Sn, Sn + 1, Sn + 2, and Sn + 3 are four (4) consecutive numbers from the table. The procedure is to start with the first four numbers within a column and move to the next four consecutive numbers as depicted in Table B3 (Appendix B). The order was repeated until all SMA’s were completed.
Calculating the Product Moment Correlation Coefficient (r)
The Product Moment Correlation Coefficient (r), also known as Pearson correlation coefficient or Pearson’s r (Derrick et al., 1994; Puth et al., 2014; Wolfram Mathworld, 2020) was used to predict the correlation between time spent by the students and their final grades after the SMA trend analysis. The correlation coefficient, r, is given by;

where


It is worth to mention that x represents the variables for the total average of the average times students spent over the 3 years, and y, the variables for their final grades obtained at the end of their studies. The r-value can be defined as;

Where r = 1 means a positive linear correlation, r = −1 a negative linear correlation, and r = 0 denote a no correlation.
Results
The results for the two pathways were treated separately. Firstly, the survey data were analyzed to confirm the type of electronics used by the students within the department. It is worth mentioning that the Blackboard is the only LMS used at our university but the survey wanted to find out whether students rely more on it or have other additional platforms. Secondly, pathway 2 focuses on the analysis of the average time spent by students on Blackboard over the 3 years and their final grades. The following sections show results from the survey and the Blackboard analysis.
Results From Survey Data
Results obtained from the survey revealed that the students rely more on the feedback from the lecturer, Blackboard usage, face-to-face discussions with the lecturer, demonstrations from the lecturer of graduate teaching assistance and coursework set on Blackboard as shown in Figure 2. The results can be attributed to the fact that the MSE program involves more mathematical derivations, theory and science definitions. Hence, students get more information on Blackboard LMS in terms of discussions with lecturers and their feedback, derivations activities, reading list, and coursework. It was also noted from the interactions with some other students that some of them do not engage well with seminars and other meetings because they focus more on achieving their required grades rather than attending academic engagements.

Responses according to the forms of engagement (see Table A1 in Appendix A).
On the type of digital resources used by students, it was unsurprising to see students rating Blackboard higher than the other resources (Figure 3) because the university uses only the Blackboard LMS. Moreover, the higher rating of podcasts is linked to the fact that the podcast in our institution is accessed through the Blackboard LMS. Furthermore, other digital platforms such as YouTube can always be embedded on Blackboard. It means that the result in Figure 3 is more informative and justifies why a relationship between average Blackboard log times and students’ final grades is vital to students’ learning. It also confirms that most students within MSE rely more on the Blackboard and our analysis in the second pathway is unbiased.

Responses according to the type of internal digital resources used (see Table A2 in appendix A).
Relationship Between the Times Students Spent on Blackboard and Their Final Grades
Figure 4 shows the average hours students spent online per day for the two-semester period plotted against their final coursework and exam grades. The results demonstrate that while coursework grades appear to remain constant, the exams grades seem to predict some weak positive linear correlation when both were compared with the average log times. Reasons behind the uncorrelated nature between the coursework grades and average times were not known but could be related to several factors. It might be that some students might have only downloaded their coursework information and log off immediately after the download while others might have read directly from the Blackboard pages, thus increasing their log in duration. Others may have joined their peers and log into one computer which might also affect the data. However, it was prudent to work with the exams grade as most students use similar learning techniques in the preparation before taking their final examinations. The preparation times, lecture information, and exam guidelines will be the same for all students but the time students take to absorb that information varies. This is because there might be differences in the learning styles, information absorption rate, capacity of their working memories and that might affect their final grades (Sweller & Chandler, 1994; Yeung, 1999). In all, the is very representative of the students’ ability since they did all get the same information from the Blackboard LMS.

Average login hours per day within two semesters over 3 year periods plotted against final grades. The insert represents a graph of the average hours spent each day within the two-semesters (see Table B1 in Appendix B).
Another intriguing analysis is shown in the inset of Figure 4. In the insert, the specific times students spend on Blackboard have been plotted against the specific day within the week. The insert shows that students engage more with the Blackboard between Wednesdays and Fridays during the two-semester periods than any other day. This suggests that any important and urgent information, as well as coursework deadlines posted on Blackboard, must be scheduled between Wednesdays and Fridays. Periods between Saturday and Monday are not suitable for assignment or assessment deadlines because students do not engage or interact on those days.
Average time students spent versus final grades
To have a clear visualization of the trend between the average times students log into the Blackboard and their final grades over 3 years (similar to Figure 4), the data were treated statistically by using the four (4) point moving average. The full results are as displayed in Table B3 (Appendix B). The trend analysis involves the average of the total averages students spent over the 3 years and their final grades. As described under section 2.1., the first 4 numbers (Table B3, Appendix B) in each column were averaged and followed by the next 4 consecutive numbers. The procedures were repeated until all averages were completed.
Figure 5 shows the results after the trend analysis and give evidence of a strong correlation between the overall average time students spent on Blackboard versus their final grade. Concerning the complexity of the data, the trend analysis was very essential in promoting the visualization of the correlation. This is because the exact usage of the Blackboard LMS during the students’ learning could not be established perfectly but the data give an indication of the Blackboard usefulness. From Figure 5, the r-square value of .56 gives evidence of a strong positive correlation between the treated data.
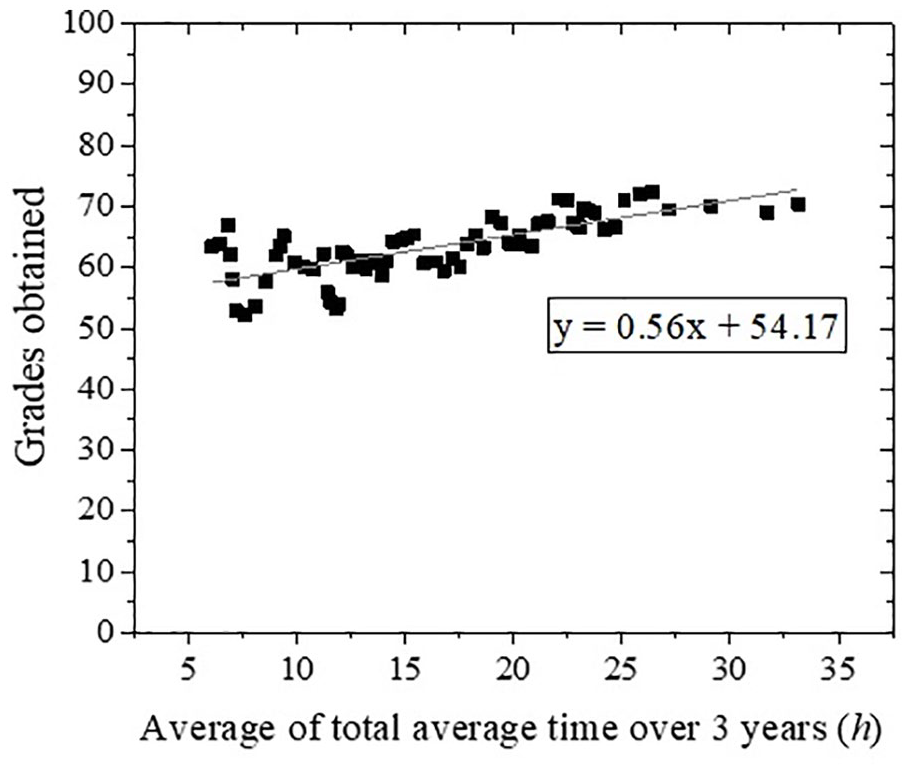
A plot of the average of the total averages of time spent over the 3 years versus their final grades after the 4 points moving average applied to the data (see Table B3 in Appendix B).
Product moment correlation coefficient (r)
Using the treated data from the 4 points moving average, manual calculation of the correlation coefficient (r) was performed. As described under section 2.2, the data in Table B4 (Appendix B) were created. From the results (i.e., Table B4, Appendix B),
Meaning,


and


This result proofs that the bivariate data after the trend analysis had a true positive linear correlation with an r around 0.7. The square of this value gives 0.5 (i.e., r2 = 0.5) and this is similar to the computational value in Figure 5.
Discussions
Overall, the students within the MSE program engage more with the Blackboard LMS since this is the only LMS used at the university and they log in more often between Wednesdays and Fridays. The result is similar to another study where students prefer Blackboard to Moodle after investigating their perceptions and experiences (Carvalho et al., 2011). The most interesting observation is the fact that students interact more with the Blackboard at certain periods, unlike previous studies where it was suggested that activities must be routinely scheduled at different days of the week and at different times each week to allow more students’ participation (Larkin & Belson, 2005). The results from this study recommend that deadlines should be scheduled between Wednesdays and Fridays. The decrease in Blackboard log in times between Sundays and Mondays propose that students might be very busy with non-academic or personal activities.
Another important observation from this investigation was the positive correlation between the time students log in to Blackboard over the 3 years and their final grade after the trend analysis. Before the trend analysis, it was evident that the correlation was weak (Figure 4) and that shows the complexity of the data. Factors such as technology barriers from students (Al Meajel & Sharadgah, 2018), misunderstanding as a result of internationalization that hinders the flow of information (Tange, 2010), type of learning styles (Graf & Liu, 2010; Heaton-Shrestha et al., 2007; Huang et al., 2012; Preidys & Sakalauskas, 2010), and students inactivity after logging onto Blackboard (Kashima & Matsumoto, 2012) may influence the results before the trend analysis. Hence, the trend analysis was necessary to overcome those complexities in other to visualize the relation between the log in times and the final grades.
The positive correlation between the average student login times and their final grades also means that the more interactions students have with the LMS, the higher their grades. Several previous research goes in accordance with these findings. This result can be compared to the Task-oriented students who became efficient and high achievers because they invested a high quantity of time in online tasks (Cerezo et al., 2016). Also, the results can be compared to the Consistent and Slide intensive use participants who invested more time and effort in viewing online learning materials and had better learning as well as gaining significantly higher homework and examination scores (Li & Tsai, 2017). Furthermore, the result can be linked to another study that showed that Blackboard usage had a positive impact on students’ academic performance at all levels (Nyabawa, 2016).
The act of enhancing performances with increasing LMS interactions can be related to the constructivism learning theory (Wu, Hsiao et al., 2012) that considers learning to be an active, constructive process. Meaning the students must actively construct their learning by actively engaging with the Blackboard LMS (Vogel-Walcutt et al., 2011).
Implication of the Study
The student preferred the Blackboard LMS because that is the only LMS software available but the question of why some students spend much time can be linked to several factors. First of all, this can be explained by cognitive processes. In the cognitive learning theory, learning happens when previously stored knowledge in the brain is continually processed to create new knowledge and enhance conceptual development (Bartlett & Bartlett, 1995; Bernstein, 2018; Satzinger, 1998). It implies that those students that spent more time on the Blackboard LMS had enough time to process stored information and create new ones. This is also confirmed by Piaget who described learning as a result of forming new schemas (i.e., a pattern of thought) and building upon previous schemas and he proposed that during learning, there is an organization of schemas and adaptation of schemas (Chalmers, 2003). Furthermore, information retention is better when learners create the knowledge themselves by absorbing and readjusting previous schemas (McNamara, 1995). This study suggests that students who spend much time absorbing and processing information may develop more new information than those who spend less time.
Secondly, the question of why some students will like to spend more time on the Blackboard LMS may be due to the level of the screen design. An excellent screen design promotes spontaneous processing of information, reduces cognitive load, and improve students’ learning activities (Nichols, 2016). Normally, on-screen reading demands a greater cognitive load than print reading because readers have to engage with additional navigational activities such as scrolling, clicking, etc (DeStefano & LeFevre, 2007; Lauterman & Ackerman, 2014). Hence, some students who might be more attracted by the Blackboard interface may spend more time than others.
Thirdly, the level of education of the MSE students might also affect their quest in finding new information on the Blackboard LMS and this is because some early year students or unskillful students might lack the basic computer skills to scan through the Blackboard screen and this may impact their ability to absorb information. Previously, researchers concluded that positive moods urge students toward using computers, while negative moods contribute to avoiding computer usage (Dambrot et al., 1988; Mitra, 1998). This is true as this notion was also confirmed by a previous study that revealed that computer skills greatly affect the mood of efficiently scanning computer screens (Rozell & Gardner, 2000). This may affect the time durations that students spent on Blackboard LMS but the study noted that the time spent to scan urgent information on the Blackboard LMS is approximately equal for all students during their exam periods. Lastly, the question of what students do on the Blackboard LMS cannot be fully explained at this moment. Furthermore, studies will be conducted to find out what the MSE students do when they log onto Blackboard LMS and the duration of those specific activities on the LMS. Another important point is the influence on the upgrades that occur within the period of the 3 years. This was mitigated because the University’s Blackboard has a continual updating license that allows the automatic update of the software and these updates happens without notice. This work confirms that the Blackboard software updating processes did not affect the students’ moods and software updates occurred for all students.
Conclusion
This work demonstrates that students interact more with the Blackboard LMS at certain periods and the interactions with the LMS had positive impacts on their academic performances. Quantitatively, there was a positive linear correlation between the average times students spent online and their final grades after trend analysis were performed on the data. The result contributes to the existing knowledge within the online community and encourages the need for allowing students to interact more with the institutional learning platforms. It is worth mentioning that the data could not be screened further to differentiate students’ activities after logging onto the Blackboard LMS but the information is very informative. The results imply that when students spend more time on the Blackboard LMS, they create new information by re-processing old information in the brain and that increases their chances to get good grades. It also indicates that a good LMS, with good functionality, can promote good students’ mood to navigate further and develop new knowledge.
Footnotes
Appendix A
Appendix B
Declaration of Conflicting Interests
The author declared no potential conflicts of interest with respect to the research, authorship, and/or publication of this article.
Funding
The author received no financial support for the research, authorship, and/or publication of this article.