
Abstract
This study identifies the main factors influencing turnover among convenience store employees from a managerial perspective and infers the changes necessary to reduce such high turnover rates. Employing the decision-making trial and evaluation laboratory (DEMATEL) methodology, it investigates the degree of mutual influence between evaluation indicators and constructs a network relation map for evaluation dimensions and criteria. This study also uses the DEMATEL-based analytic network process method to compute the influential weights of each dimension and criteria. According to the empirical results of the causality model, convenience store employees must first improve the relatedness dimension, and managers must first improve the existence dimension. These findings can help convenience store managers address talent retention and turnover problems, develop effective strategies to lower the high turnover rates at convenience stores, and offer solutions to new industry entrants to avoid potential problems that might lead to early exit.
Introduction
A rapidly Taiwan aging population, coupled with dwindling numbers of youth, has created many complex population-related social problems (see Figure 1). The declining birth rate is the biggest source of problems associated with student enrollment in schools, and supply and demand in the labor and employment market (Wu et al., 2013). With the declining birth rate and rising salaries becoming major problems in Taiwan, many companies are unable to find suitable talent. Serious workforce shortages have forced Taiwan’s labor-intensive manufacturing industry to move offshore, and the service sector is employing foreign workers, making it more difficult for local job seekers to find employment in the country. Many job seekers enter the workplace without understanding the skills and abilities required for the job, which ultimately results in fallout between managers and employees, and undermines labor-management harmony (Altmann et al., 2018; Kreemers et al., 2018).
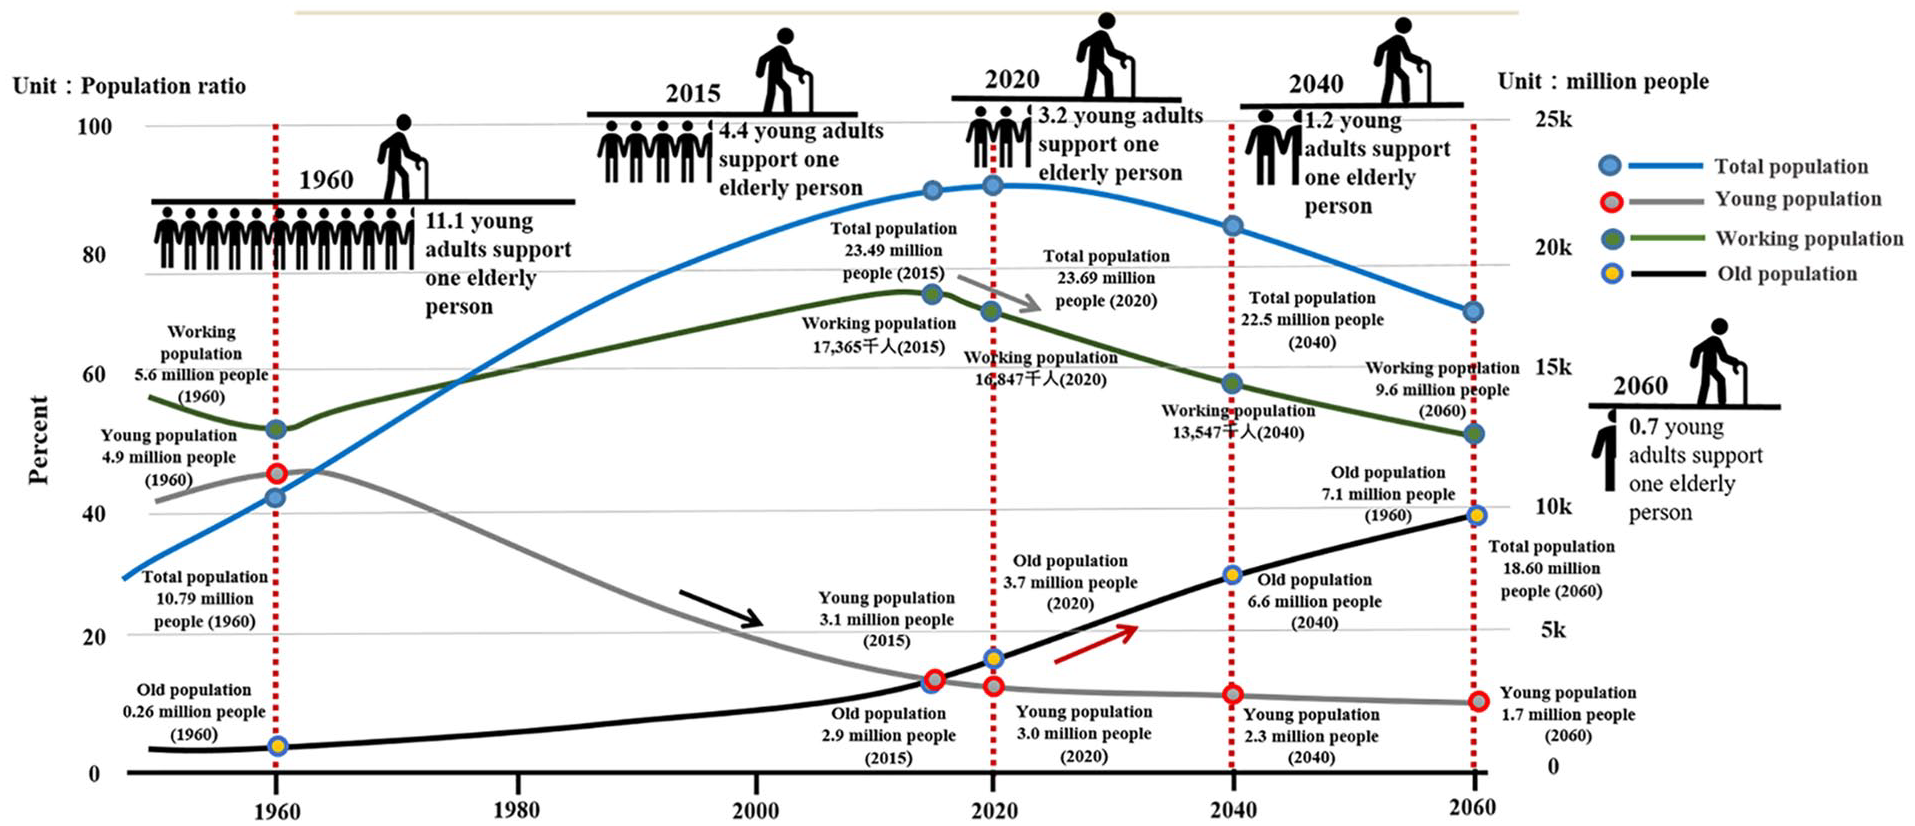
Change in Taiwan’s population.
As third-year students in the Department of Marketing and Logistics Management are required to undertake an internship for credits, the students selected Taiwan FamilyMart Co. Ltd., which collaborates with our university, at the recommendation of the company’s human resource manager. In 2018, the students started their internship at FamilyMart, a convenience store chain. During the 1-year internship, the students identified several problems at different FamilyMart stores. The most serious challenge was a high employee turnover rate. From an employer’s perspective, this problem arises because it is difficult to find good employees. However, employers not only fail to understand the root cause of the problem, but also ponder on a multitude of problems related to wages, co-worker relations, and self-actualization from the employees’ perspective, leading to poor performance in these areas, eventually resulting in operational difficulties (Chang et al., 2015).
With the declining birth rate and increasing outbound migration in Penghu County, convenience stores, in particular, are facing a serious shortage of trained workforce. Our observations show that recruitment advertisements have become permanent fixtures at convenience stores. New employees at convenience stores quit in less than 3 weeks, as they are unable to endure the highly labor-intensive work (Gjerløv-Juel & Guenther, 2019; Rosengren & Bondesson, 2017). Among the major industries in Taiwan, the convenience store chain industry is closely related to public life (Cheng et al., 2009). In response to the recent lifestyle changes and the transformation of Taiwan’s industrial structure, the growth of convenience stores across Taiwan’s retail landscape has spread to other cities and townships, creating a new trend and gradually replacing Kám-Á-Tiàm, which are traditional grocery stores. Traditional grocery stores emphasize long-term interpersonal relationships, while chain-type convenience stores focus on “service” and “convenience” and target less price-sensitive consumers. Their business philosophy entails a “complete product mix, quality assurance and freshness, cleanliness and hygiene, and friendly and quick service.”
Based on our observations, we identified five serious problems: the employment of various management methods at different stores, a responsibility system, the under-reporting of overtime work, different pay rates for the same job, and workplace bullying. These problems have led to high turnover rates at convenience stores, rising costs due to repeated newcomer training, and frictional unemployment in society (Caliendo et al., 2016). Scholars have proposed various interpretations of the definition of turnover; however, all these interpretations include interpersonal relationships. Therefore, it is impossible to separate employee turnover from the influence of factors such as interpersonal relationships (Matthews et al., 2018; Rasheed et al., 2020; Stamolampros et al., 2019; Yang et al., 2012).
Tourist seasons affect the business of convenience stores in Penghu. They have very different sales turnovers in winter and summer, primarily because tourists are reluctant to visit Penghu in the winter because of the northeast monsoon. Employee workload increases drastically in summer, when the gentle south wind passes through the county but becomes relatively light in winter; consequently, many employees resign when summer arrives, resulting in a serious shortage of workers when workforce is most needed. The heavy workload makes it difficult to hire new employees; however, they join when the workload becomes more manageable, followed by a wave of employee turnover at the beginning of the peak season. The workload gap between peak and off-peak seasons, together with labor-management confrontation, seriously affects the operation of convenience stores. Therefore, this study identifies the reasons for employee turnover and assess managers’ opinions about the various reasons or factors that cause employee turnover (Yang et al., 2012).
This study uses convenience stores in Penghu as samples and conducts in-depth research and investigation into key factors influencing employee turnover at convenience stores. To address the research questions, this study first determines the key common factors for managers and employees by reviewing the relevant literature. Second, it investigates the network relationships between indicators using the decision-making trial and evaluation laboratory (DEMATEL) method, after confirming the research framework. Then, based on the analysis results, it draws a network relation map (NRM) between the criteria to identify important influential criteria (Gölcük & Baykasoğlu, 2016). Third, it computes the influential weight of each evaluation criterion using the DEMATEL-based analytic network process (DANP) (Tsai, 2020; Tsai et al., 2020). Finally, it analyses each evaluation criterion to determine how these results can help convenience store operators understand the main reasons for employee turnover and retention, and incorporate relevant improvements.
Literature Review and Theoretical Background
This section explains the theories adopted in this study and presents a series of in-depth discussions on the trends affecting employee retention in convenience stores and the factors employees consider before quitting. This section reviews the meaning of a convenience store, and the theories and literature related to talent retention and turnover behavior.
Relationship Between Employee Turnover and Talent Retention
Employee turnover
Employees quit their jobs for many reasons, the two critical reasons being “I get paid too little” and “I am treated unfairly” (Matthews et al., 2018; Stamolampros et al., 2019; Yang et al., 2012). Turnover refers to a person leaving an organization or company, although Yang et al. (2012) believed that turnover could have both broad and narrow meanings. In the broad sense, turnover refers to the movement of labor from one place to another (movement between regions), one job to another (movement between jobs), or one industry to another (movement between industries) (Stamolampros et al., 2019; Yang et al., 2012). In the narrow sense, turnover refers to a related activity or experience, such as switching employment units, a change of position, or an individual entering or leaving an organization (Matthews et al., 2018; Yang et al., 2012).
Conflict often arises between employers and employees because of differences in values, generation, background, and salaries (Pitafi et al., 2018; Rubenstein et al., 2020). Owing to low salaries, employees naturally opt for jobs that offer higher salaries, which results in high turnover rates (Matthews et al., 2018). Often, an employee’s departure can turn sour; therefore, employers eventually come to devalue young employees. As the young quit their jobs after short periods, they are less likely to pass on the techniques and technologies that employers own; this makes employers reluctant not only to share such techniques and technologies but also to offer high salaries. Consequently, young employees do not remain in their jobs for long because they do not learn any new techniques nor do they receive high salaries. Eventually, these industrial techniques and technologies are lost, while frictional unemployment rises (Caliendo et al., 2016; Lucia-Palacios et al., 2020; Matthews et al., 2018).
Companies bear unimaginably high costs when employees quit. The cost of employee turnover can be divided into explicit and implicit costs. Explicit cost is visible in accounts, including training development and acquisition costs, whereas implicit cost includes vacancy costs, expenses arising from low productivity loss, the psychological impact on retained employees, loss of knowledge and technology, and inefficiency costs due to the lack of expertise before employees quit (Kaak et al., 1998). As the above argument shows, companies will face increasing replacement costs if they do not retain employees, ultimately resulting in operational difficulties.
Talent retention
Retention is the action an organization takes to encourage workers to remain in their original units and continue to work or engage in the same type of professional work or work of the same nature by adjusting regulations or strategies (Oludayo et al., 2018; Yang et al., 2012). With regard to formulating strategies, some scholars believe that the prospects for retaining employees increase if employers can meet their higher-level needs at work (Oludayo et al., 2018). For instance, Dubin (1956) found that a high level of involvement is positively correlated with work engagement. Some scholars noted three strategies to retain employees. First, provide a generous remuneration package and profit sharing. Second, motivate employees to like their work and achieve a work–life balance. Third, inform employees of the company’s prospects and development to build their sense of coherence with the company (Festing & Schäfer, 2014; Oludayo et al., 2018; Yang et al., 2012).
Based on these arguments, this study infers that adequate salaries alone cannot persuade employees to stay in their jobs willingly. It is necessary to provide them with goals and a work–life balance and ensure their fair treatment before the turnover rate can be properly reduced (Kennedy & Daim, 2010; Yang et al., 2012).
Existence-Relatedness Growth Theory
This subsection discusses the relationship between the existence-related growth (ERG) theory and Maslow’s hierarchy of needs by introducing both theories separately and highlighting their similarities. Finally, this study employs ERG theory to infer the main reasons for employee turnover and managers’ opinions about the major reasons employees quit their jobs at convenience stores in Penghu.
In 1972, Alderfer condensed Maslow’s hierarchy of needs into three categories, namely existence, relatedness, and growth, and presented these as components of the ERG theory (Alderfer, 1969, 1972). Existence refers to basic survival needs, including material and physiological, and safety needs; it is equivalent to physiological and safety needs in Maslow’s hierarchy of needs. Material needs include water, food, and clothing; physiological needs include exercise, leisure, and sleep; and safety needs include protection from fear, anxiety, and danger (Alderfer, 1972; Chen et al., 2012; Yin & Zeng, 2020). Second, relatedness refers to a category of needs for maintaining satisfactory interpersonal relationships with others, including a sense of belonging and respect; it is equivalent to social needs in Maslow’s hierarchy. Belonging needs refer to acceptance by others as a member of the group, while respect needs pertain to enabling someone to perceive value in their existence (Alderfer, 1972; Yin & Zeng, 2020). Finally, growth refers to a category of needs for striving to achieve goals and fulfill dreams, including self-esteem and self-actualization, and it is equivalent to esteem and self-actualization needs in Maslow’s hierarchy. Esteem needs mainly refer to the pursuit of self-confidence, achievement, dominance, and a sense of competence, whereas self-actualization needs refer to realizing one’s potential or assisting others in their growth (Yin & Zeng, 2020).
ERG theory differs from Maslow’s hierarchy of needs in two ways. First, Maslow’s hierarchy emphasizes the order or hierarchical prioritization of human needs, whereas ERG theory has no such order; thus, lower-level needs do not necessarily have to be met first. Furthermore, according to ERG theory, motivation may be influenced by multiple needs simultaneously. For example, a person may pursue salary (existence needs), interpersonal relationships (relatedness needs), and personal growth (growth needs) all at once. Second, Alderfer (1972) argued that an individual’s development involves not only the satisfaction–progression process, but also the frustration–regression process. This clearly shows that an individual will focus more on satisfying lower-order needs before the higher-order ones or that they will fulfill lower-order needs when they feel that their attempts to meet their higher-level needs are frustrated. He also opined that each type of need has its own motivation (Ingvardson et al., 2020; Sun & Teng, 2017; Yin & Zeng, 2020).
Development of Evaluation Attributions to Retain Talent and Reduce Employee Turnover at Convenience Stores Based on ERG Theory
This study uses ERG theory with suggestions gleaned from a literature review and discussions with industry specialists to identify criterial indicators for talent retention and turnover reduction strategies adopted by Penghu’s convenience stores.
Existence perspective
The existence perspective is a key measure for influencing talent retention and employee turnover at convenience stores (Chen et al., 2012). This study considers the following measurements in the existence dimension. Pay (E1) refers to the direct and indirect remuneration that an organization pays employees for their labor. This includes a basic salary, allowances, bonuses, and benefits (Chiang & Ohtake, 2014; Dai et al., 2017). Health (E2) refers to appropriate social support and other work resources that can help employees reduce or relieve work pressure, build good interpersonal relationships, develop environmental perception, maintain emotional stability, and be passionate about work, while improving their physical and mental health (Berniell & Bietenbeck, 2020; Loh et al., 2019). Working environment (E3) encompasses salary and benefits, autonomy, challenge, learning and promotion opportunities, interpersonal relationships, and internal affirmation (e.g., a sense of satisfaction and honor, a sense of accomplishment, and self-actualization) at work, which will affect work motivation and expectations (Teo et al., 2020; Tsai et al., 2015; Zhu et al., 2020). Working hours (E4) is the period in which an employer asks employees to work, based on the stipulations of the labor contract. Employees contribute to the labor force during their working time in order to obtain wages to maintain their basic needs. Therefore, working time should be positively correlated with wages; however, it must not exceed the necessary range to avoid compromising employee health and prevent absences (Berniell & Bietenbeck, 2020; Park et al., 2017). The reward and punishment mechanism (E5) refers to the provisions that stipulate rewards and punishments for specific employee behaviors at work (Güngör, 2011; Zhang et al., 2020).
Relatedness perspective
Relatedness has a significant influence on other perspectives of existence and growth (Yin & Zeng, 2020). This dimension attempts to improve prospects for convenience store managers and employees to reduce employee turnover. In the relatedness dimension, the following measurements are considered. Organizational atmosphere (R1) refers to the unique organizational style that differentiates an organization from others. It is a persistent feature of the internal environment, which is formed through interaction between the organization’s members. Members can feel it, and it affects their behavior. It is also the value of organizational characteristics (Grolleau et al., 2013; Tsai et al., 2015). Leadership style (R2) refers to personal characteristics expressed through leadership. Leaders’ values, experiences, organizational culture, and personality traits influence their personalities. Leaders integrate their ideas into the organization’s cultural context and exert their influence to achieve organizational goals. Leadership style is also a comprehensive representation of leaders’ cognition and behavior in the organizational cultural context (Boukis et al., 2020; Vieira et al., 2018). Disagreement with the supervisor (R3) is when an employee disagrees with the supervisor’s leadership style and management philosophy (Newstead et al., 2019). Organizational structure (R4) refers to the formal arrangement of work within an organization. An organization can have different structures depending on its objectives. Organizational structure can determine an organization’s operating model and work pattern. It can also determine the allocation of responsibilities to different positions and the review of different entities, such as branches, departments, workgroups, and individuals (Lee & Yang, 2011; Schulman, 2020). Mood at work (R5) refers to employees eliciting or suppressing their emotions to create a caring, safe atmosphere. Such an employee needs mental and emotional balance, which sometimes relies on their personality (Cho & Yang, 2018; Gallagher, 2012).
Growth perspective
The growth dimension helps convenience stores produce creative, competitive offerings (Kim et al., 2020). In the growth dimension, this study considers the following possible measurements. Corporate image (G1) refers to customers’ perception of the entity and the enterprise’s behavior. This also includes the company’s name, culture, business philosophy, and diversity of products and services. It is the result of the interactive effect of all enterprise-related customer experiences, feelings, ideas, and knowledge (Graciola et al., 2020; Ko et al., 2013). Lack of education and training (G2) refers to an enterprise’s inadequacy in strengthening its employees’ ability, knowledge, and attitudes through training. This prevents the enterprise from improving overall organizational performance and strengthening its centripetal force (Soltani & Morice, 2020). Work flexibility (G3) refers to how employees deal with the dilemma of balancing work and family in many European countries, the United States, and Japan. Work flexibility is also a solution for enterprises when hiring talent, enhancing competitiveness, or reducing costs. This results in a win-win work pattern for workers and enterprises (Ağralı et al., 2017; Burdin & Pérotin, 2019). Personality (G4) refers to the composition of multiple traits. These are persistent features and attributes that distinguish individuals. These attributes are collectively called personality traits (Adjei & Clark, 2010; Yao & Li, 2021). Burnout at work (G5) refers to a situation in which an individual becomes unable to adapt to and effectively solve problems because of physical and psychological stress in the working environment, resulting in physical and mental exhaustion. It also refers to the phenomenon in which an individual negatively copes with the work environment, gradually loses the enthusiasm to work, and experiences reduced personal accomplishment (Kilroy et al., 2020; Park et al., 2020).
This study developed appropriate indicators based on the literature review, preliminary interviews with convenience store managers, and the talent retention and turnover criteria created by major convenience stores. These indicators were identified before interviewing convenience store managers and employees.
Creating an Evaluation model for Improving Talent retention and Turnover at Convenience Stores From the Managers’ and Employees’ Perspectives
This study objectively analyses the various issues upon which convenience store managers must focus to retain talent, understand why employees quit their jobs, and respond to such situations. More importantly, this study provides feasible and appropriate talent retention strategies for managers and assists in striking the best balance in the relationship between managers and employees. Based on the literature review, expert opinions, and the questionnaire results, this study constructs the evaluation dimensions and criteria for talent retention and employee turnover at convenience stores in Penghu. Next, the study confirms the causal relationships between the evaluation dimensions and the criteria using DEMATEL and computes the influential weight of each evaluation dimension and criterion using DANP. This section explains the research methods used in this study.
DEMATEL Method
The DEMATEL method can facilitate an effective understanding of a complex structure of causal relations. By examining the degree of influence between elements, matrix computations are employed to obtain the causal relations and degree of influence between elements in order to build an NRM that approximates structural equation modeling (SEM). According to Fontela and Gabus (1976), the Battelle Memorial Institute of Geneva developed the DEMATEL method in 1973 for use in the Science and Human Affairs Program to study a complex tangle of real-world problems (e.g., environmental protection, ethnicity, energy, and other complex intertwined issues) in order to identify feasible solutions through hierarchical structures (Gabus & Fontela, 1973). The DEMATEL technique can effectively combine expert knowledge to clarify the causal relations between various variables. Additionally, the DEMATEL technique aims to determine the interdependence and degree of interdependence between multiple indicators (Kilic & Yalcin, 2020).
DEMATEL is widely used in various fields. It has been used by the National Taiwan Museum (Tsai & Lin, 2016, 2018), as well as in green marketing (Tsai et al., 2020), safety management (Yazdi et al., 2020), the service industry (Tsai, 2020), and to study social media addiction (Dalvi-Esfahani et al., 2019). The empirical results of these studies show that direction relation maps obtained using DEMATEL can effectively illustrate complex problems’ causal structure and relationships.
To summarize the abovementioned literature, DEMATEL is an effective method for constructing and analyzing structural models, and it is often used to identify relationships in social phenomena and address dependence problems between factors (Horng et al., 2013; Tsai & Lin, 2018; Tsai et al., 2020; Zhao et al., 2019).
DANP Method
Proposed by Saaty (1996), the analytic network process (ANP) is a decision-making evaluation method for solving feedback and dependence problems between hierarchies. The traditional analytic hierarchy process (AHP) assumes that each evaluation attribute is independent and does not influence any other attributes (Saaty, 1980; Wu et al., 2010, 2011). However, in practice, this assumption seems to be very intense, and mutually influential relationships may be present between attributes. The ANP can address non-linear and complex hierarchical relationships. As the ANP’s decision-making process can better reflect real-life phenomena than AHP, it has been widely used in recent years (Chen & Ren, 2018; Karimi et al., 2019; Wu et al., 2009).
The DANP model is an integrated research method proposed by Ou Yang et al. (2008). They argued that ANP assumes that each cluster has the same degree of influence, thus ignoring the fact that different clusters should have different degrees of influence. Hence, they proposed the combination of DEMATEL and ANP to solve this problem. The DANP method employs DEMATEL to verify the different degrees of influence among clusters, while the “dynamic importance influence relationship,” hidden in the total influence relationship matrix from DEMATEL, is applied to the supermatrix from ANP. The matrix is then continuously multiplied to obtain stable results for convergence between evaluation attributes, which approximates the use of questionnaires in the ANP method to verify the influence and importance of criteria. Hence, a combination of DEMATEL and ANP is proposed, where the total influence relationship matrix from DEMATEL is applied to the supermatrix from ANP to enable the model to address actual situations (Tsai, 2020).
As the above explanation shows, DANP considers the fact that different clusters have different degrees of influence. However, only the DEMATEL questionnaire is required in DANP. There is no need to combine the traditional methods of DEMATEL and ANP, that is, by conducting a DEMATEL questionnaire survey to confirm the mutually influential relationships between evaluation attributes to construct a network hierarchical structure and then conducting an ANP questionnaire survey to determine the weights of evaluation attributes and obtaining the results of the evaluation. Therefore, this study employs DANP to simplify the questionnaire survey process and considers different degrees of influence between the evaluation criteria (Chen & Lin, 2018; Chiu et al., 2013).
Procedure for Constructing an Evaluation Model for Talent Retention and Turnover in Convenience Stores
This paper first explains the procedure for constructing an evaluation model for talent retention and turnover at convenience stores in Penghu. Next, based on the literature review, expert opinion, and the questionnaire results, this study obtains the influential dimensions for talent retention and turnover at convenience stores, applies DEMATEL to confirm the causal relationships between the evaluation dimensions and criteria, and constructs an NRM for all evaluation dimensions. Subsequently, this study adopts DANP to compute the influential weight of each evaluation indicator. The analysis results can serve as a reference for convenience store managers and employees. Figure 2 presents the framework for constructing decision-making models.

Framework for constructing decision-making models.
The steps for constructing an evaluation model for talent retention and turnover at convenience stores in Penghu are as follows:
Step 1: Construct an individual direct relation matrix
Suppose there are

Step 2: Calculate the average direct influence relation matrix
The average score of

Step 3: Testing for consistency
This step examines whether the results of the questionnaires completed by
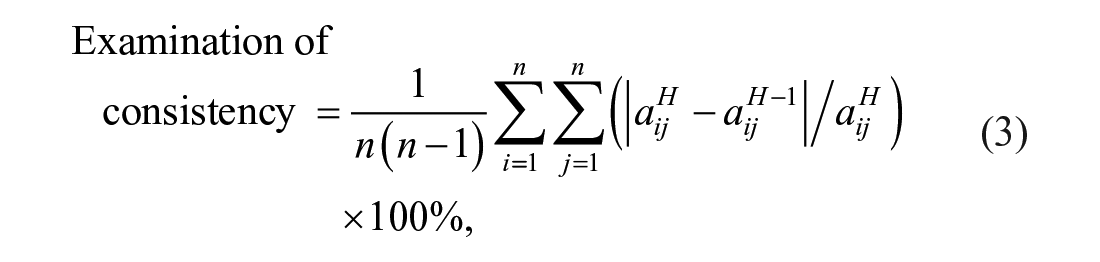
where
Step 4: Calculate a normalized average direct influence relation matrix
The average matrix


Step 5: Calculate the total influence relationship matrix
When the number of times matrix

Step 6: Establish an NRM
Each column and row of the total influence relationship matrix


where
Step 7: Construct transposed and normalized total influence relationship matrices
The normalized total influence relationship matrix


Step 8: Determine local weights of dimensions and criteria
The transposed total influence relationship matrix

Step 9: Determine global weights of all criteria
The local weight of each criterion is multiplied by the local weight of its corresponding dimensions to obtain the global weight of all criteria

Empirical Analysis for Talent Retention and Turnover in Convenience Stores From the Managers’ and Employees’ Perspectives
Based on the decision-making models constructed in Section 3, this study uses convenience store managers and employees in Penghu as research samples and designs and distributes a DEMATEL questionnaire comprising three major dimensions—existence (E), relatedness (R), and growth (G)—developed through the literature review. It then conducts a calculation analysis to determine their weights using DANP. Finally, it examines how managers should improve the work environment to reduce the rising employee turnover rates.
Using the DEMATEL Technique to Create a Causality Map
The questionnaire survey data are collected and compiled as follows. Based on the relevant literature and reference data collected using the appropriate research methods, we compile and analyze data according to the following steps:
Step 1: Design the questionnaire
This study developed two DEMATEL questionnaires: one for managers and one for employees. These questionnaires are designed based on the literature review, as well as expert opinions and discussions. The study analyses the key decision-making factors influencing talent retention and turnover at convenience stores in Penghu using the three dimensions; 15 indicators are used as the elements for a five-point pairwise comparison scale, where 0 represents no influence, 1 indicates low influence, 2 shows moderate influence, 3 denotes high influence, and 4 represents extremely high influence.
Step 2: Questionnaire distribution
The research methods used in this study emphasize the opinions of convenience store managers and employees. The number of convenience stores in Penghu has increased rapidly (15 convenience stores, the geographical locations of which are shown in Figure 3). Therefore, we distributed the questionnaires only to convenience store managers (11) and employees (40) (including those who recently quit) in Penghu. We used two questionnaires, one for managers and one for employees, to investigate and solicit managers’ opinions about the key factors influencing employee turnover and employees’ decision to quit, as well as their opinion on the degree of mutual influence between these factors.
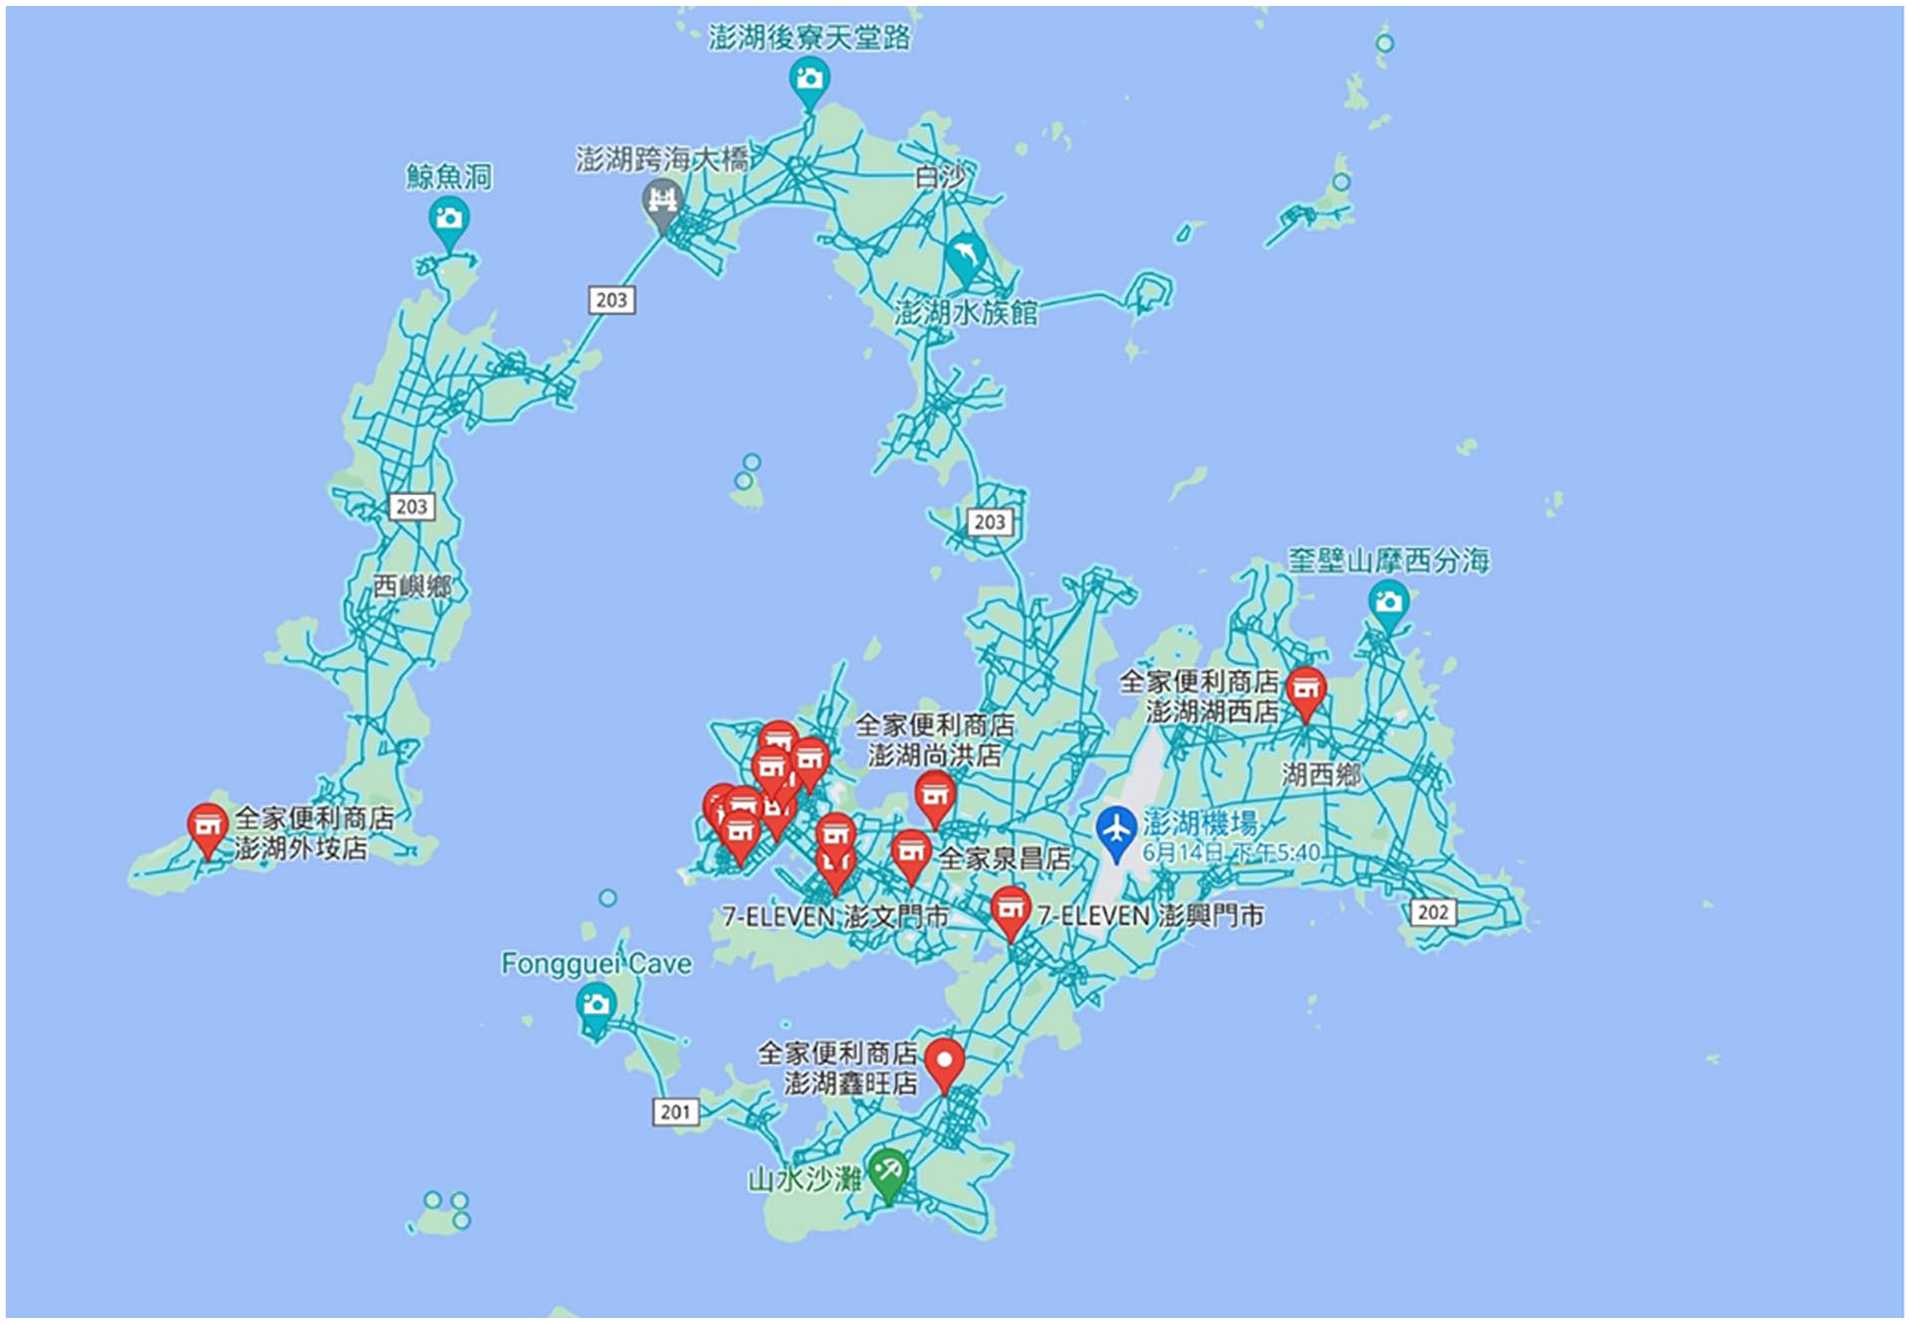
Geographical location of the case (convenience stores) in Penghu.
Step 3: Examination of consistency
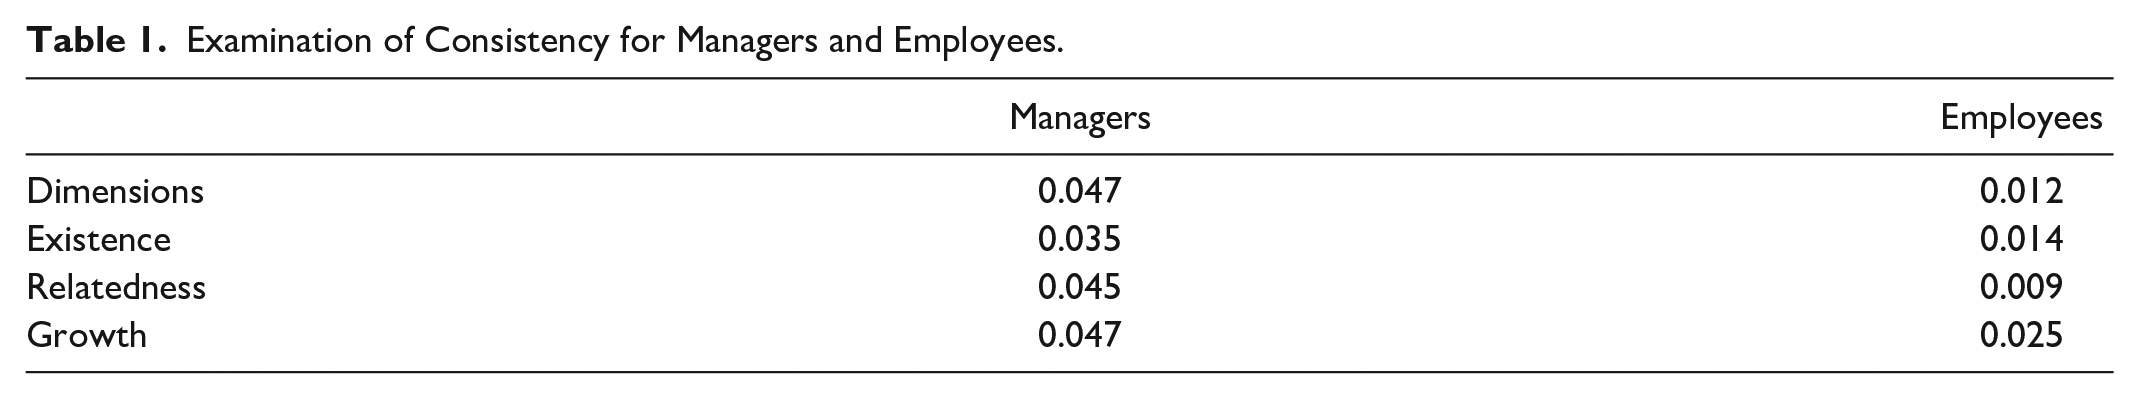
We successfully distributed and collected 11 DEMATEL manager questionnaires and 40 DEMATEL employee questionnaires; both had a return rate of 100%. We then examined consistency to analyze the data collected in both sets of questionnaires to confirm that the responses reached a consensus. The responses are consistent if the values calculated during the examination of consistency are less than 0.05. Table 1 shows the values calculated in this test.
Examination of Consistency for Managers and Employees.
Step 4: Construct DEMATEL data and draw an NRM
Dimensions (employees)
E, R, and G are influenced factors along the horizontal axis and influence factors along the vertical axis. The sum of influence factor Di is obtained by summing the values along the horizontal axis, while the sum of influenced factor Sj is obtained by summing the values along the vertical axis. The threshold value is calculated using the average value of the total influence relationship matrix to determine the direction of mutual influence between the criteria in the NRM. The threshold value for dimensions (employees) is 7.092, while the figures in bold represent dimensions that reached the threshold value, as shown in Table 2.
The Total Influence Matrix of Criteria T (Employee Perspective).

Note. Any value greater than the threshold value is presented in bold (Dimensions [7.092], Existence [1.207], Relatedness [1.224], and Growth [0.847]).
Di + Sj represents the degree of correlation, whereas Di–Sj represents the degree of cause, which determines cause and effect. If Di–Sj is positive, it indicates that the dimension is a cause. If Di–Sj is negative, it signifies that the dimension is an effect. These values are used to draw the NRM. For employees, one dimension is a cause and two dimensions are effects, as shown in Table 3.
Sum of Influences Given and Received on Dimensions and Criteria (Employee Perspective).
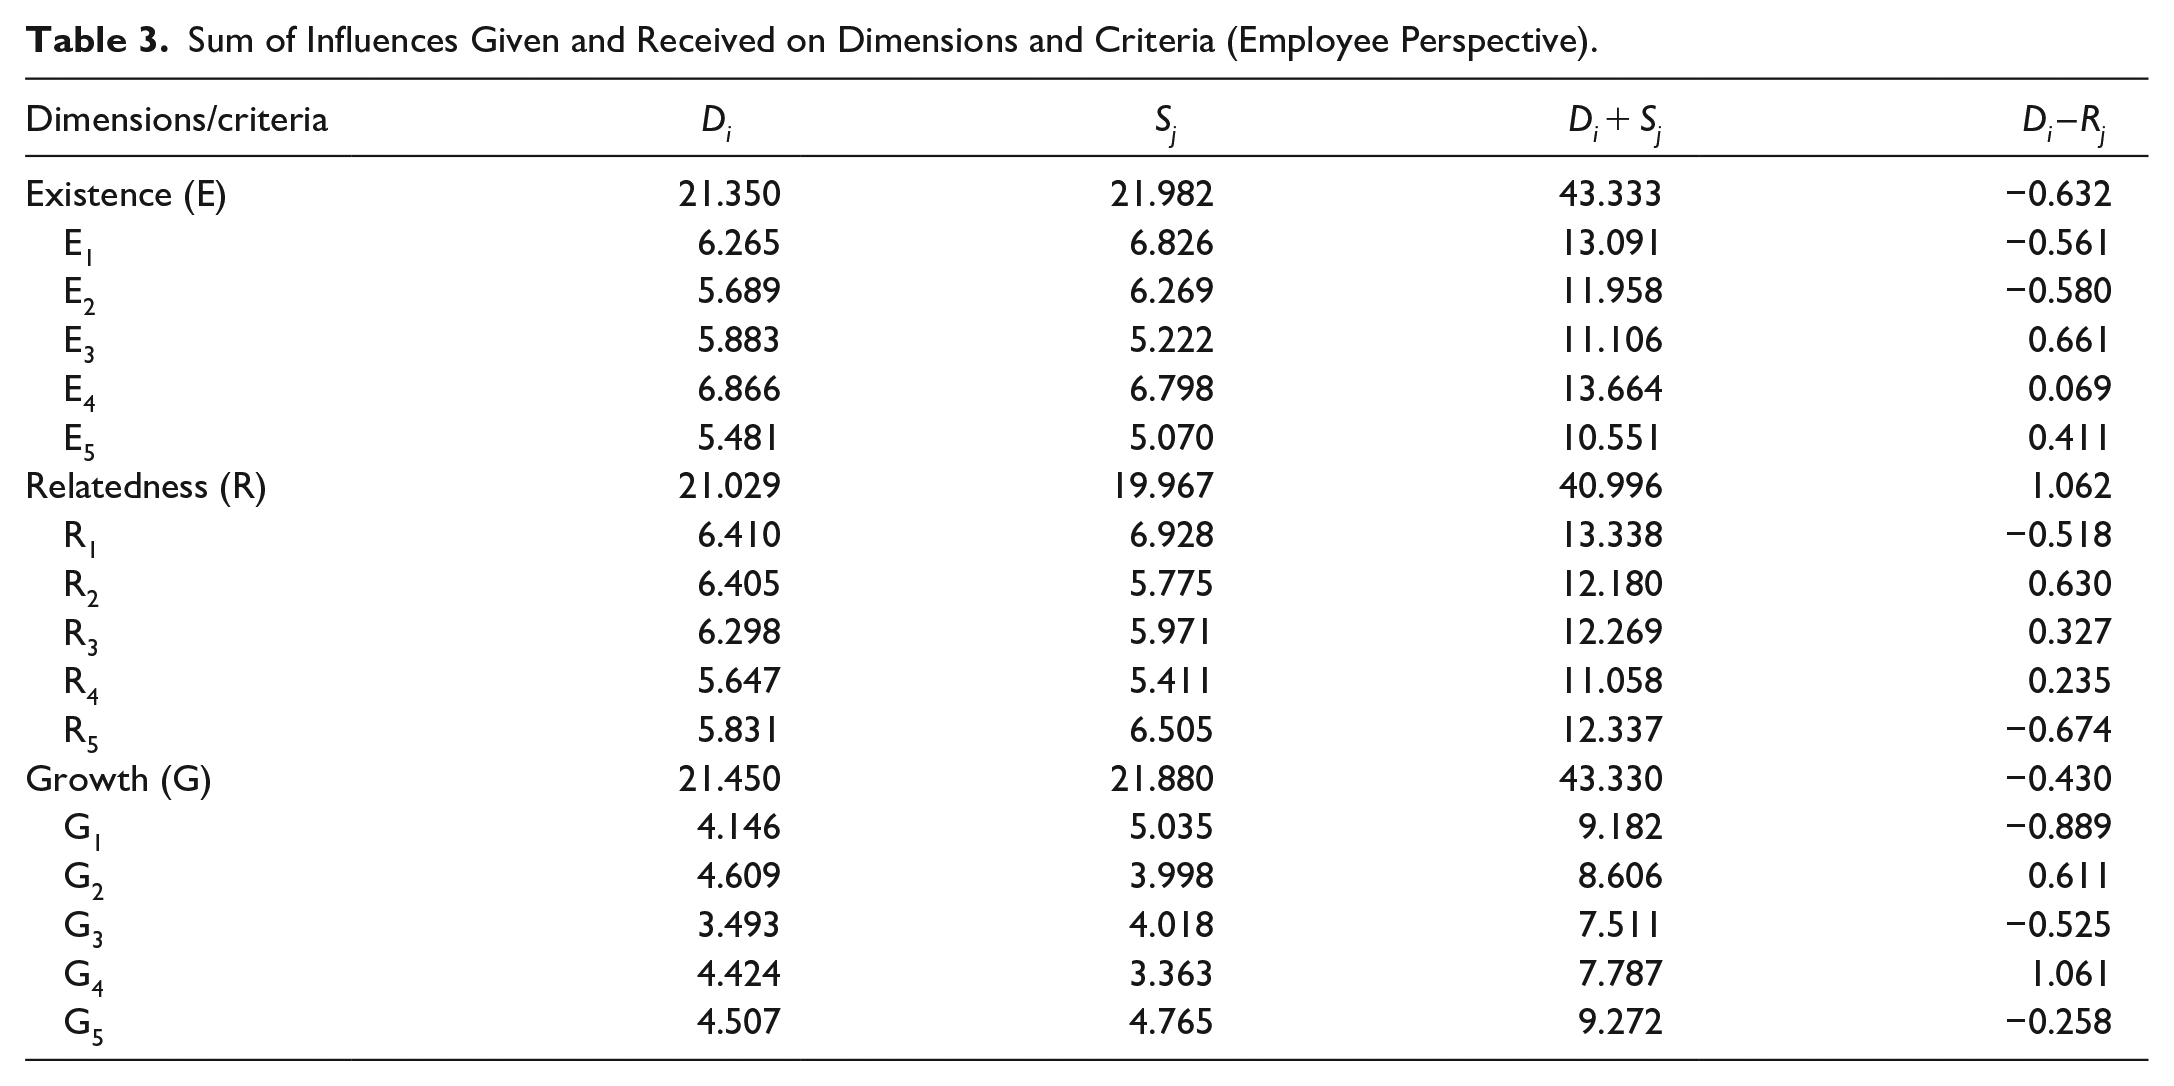
As Figure 4 shows, employees believe that the main reason for employee turnover is relatedness, likely due to the fact that convenience store work requires cooperation. If employees have poor relationships with their colleagues during their shift, it could delay the end of work and gradually foster the idea of quitting. If relatedness can be improved, both existence and growth can be changed. With an understanding of the reason for improving relatedness, our internship experience shows that since convenience stores offer low wages, the likelihood of an employee continuing increases if that employee has good relationships with colleagues, as this influences the reason for achieving growth needs. Owing to these good relationships, employees consider continuing in their jobs for a long time, and they participate in the intensive on-the-job training provided to convenience store employees. Furthermore, employees who enjoy good relationships at work desire recognition from colleagues and managers, and thus strive to work harder.
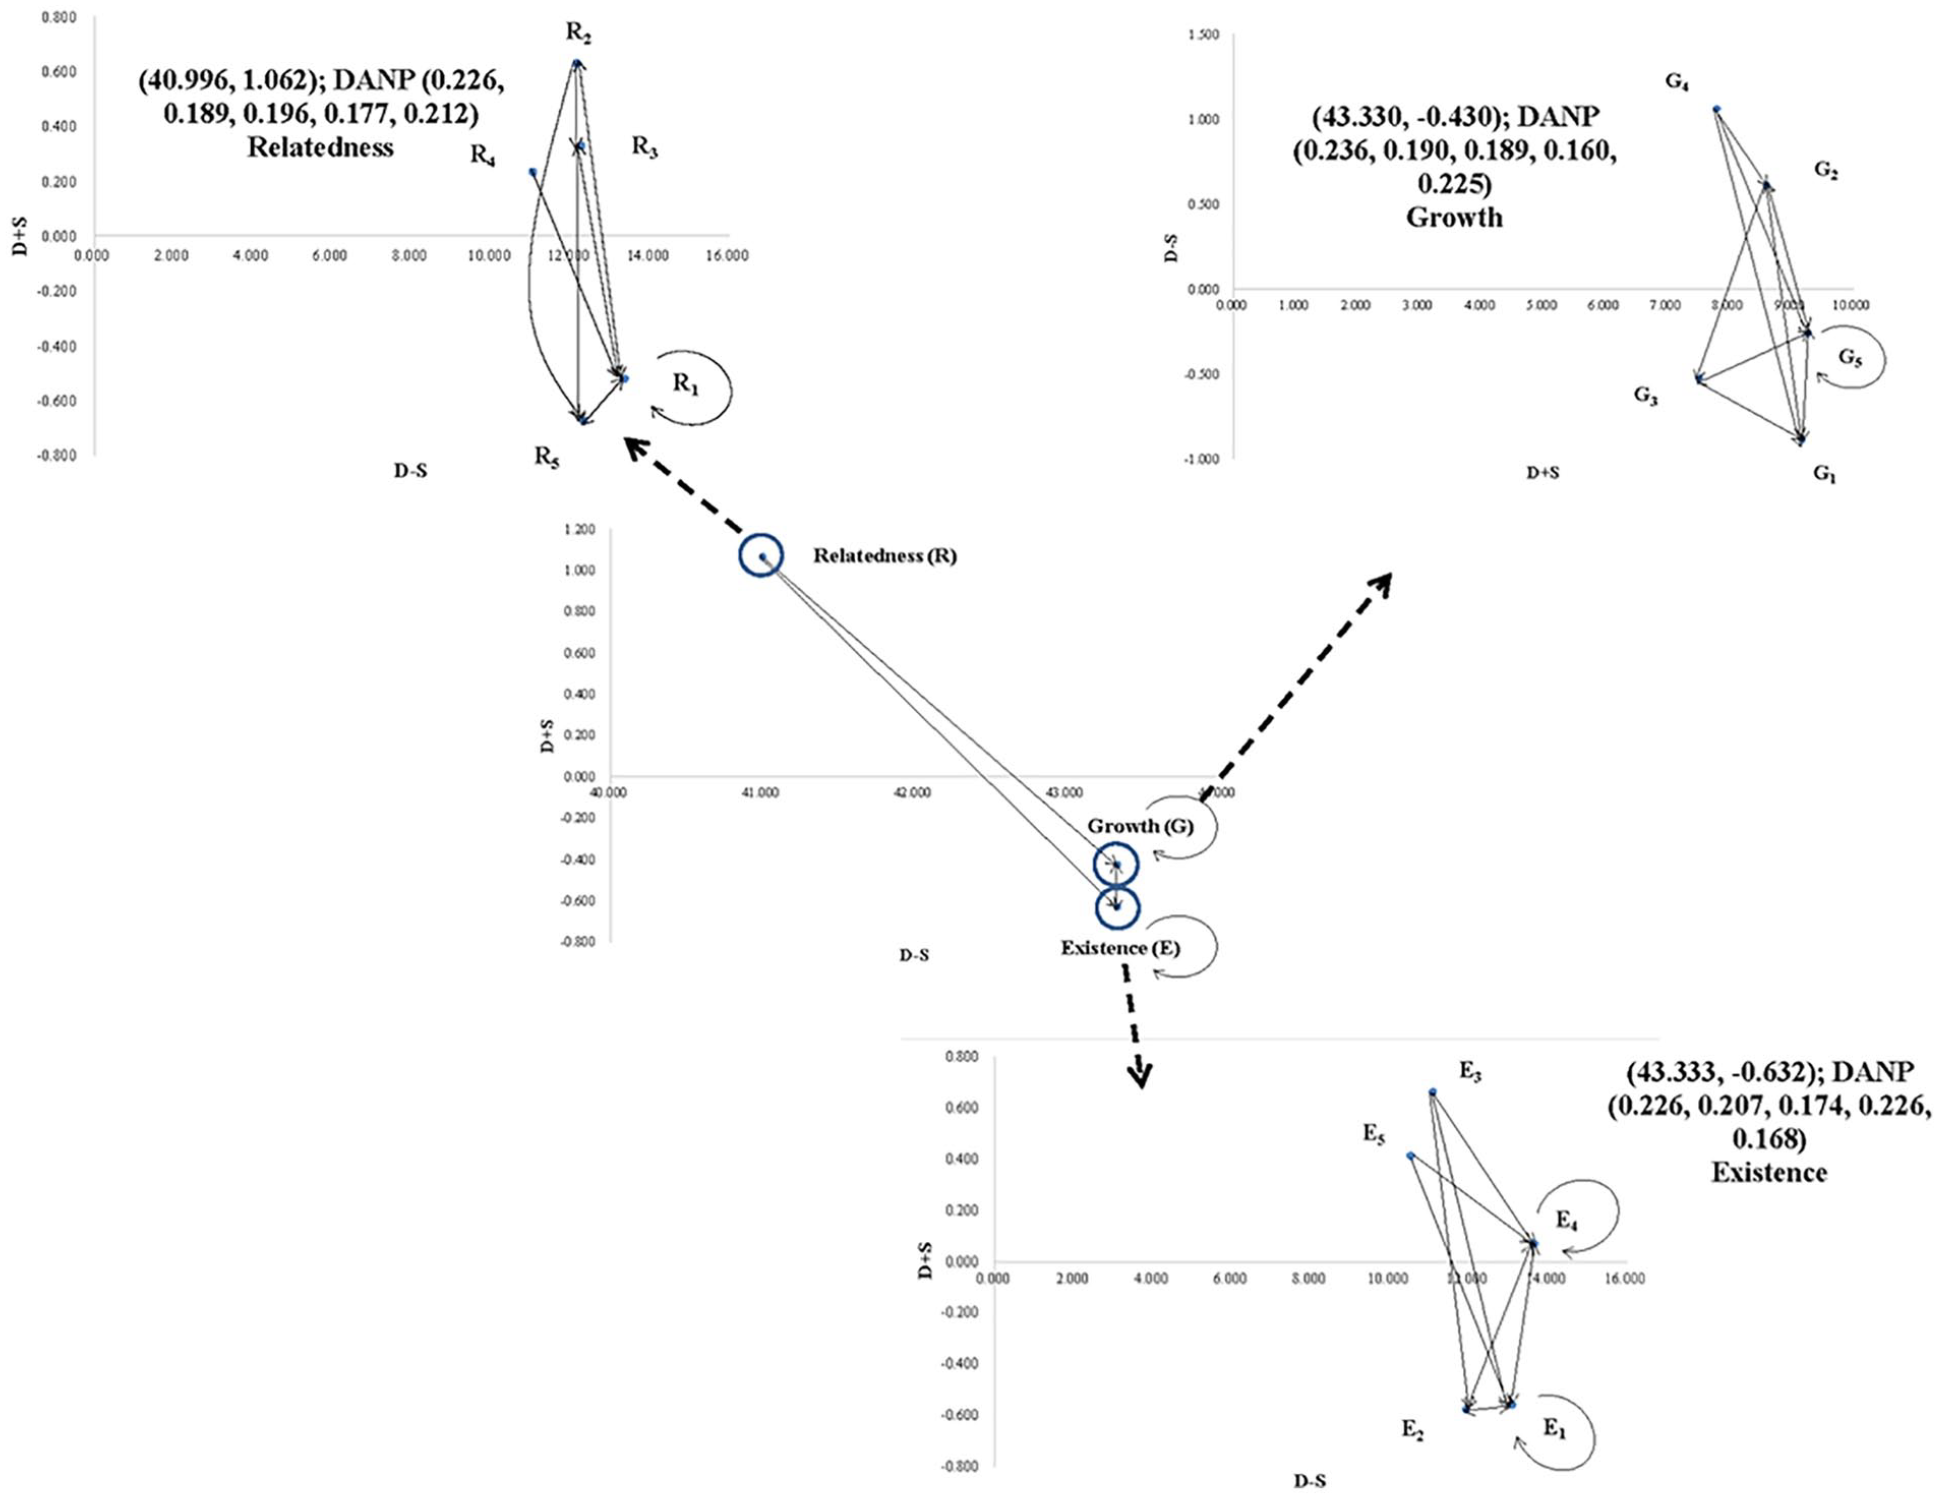
NRM of each dimension and criterion for talent retention and turnover of convenience stores (employee perspective).
Dimensions (managers)
E, R, and G are influenced factors along the horizontal axis and influence factors along the vertical axis. The sum of influence factor Di is obtained by summing the values along the horizontal axis, while the sum of influenced factor Sj is obtained by summing the values along the vertical axis. The threshold value is calculated using the average value of the total influence relationship matrix to determine the direction of mutual influence between the criteria in the NRM. The threshold value for dimensions (managers) is 2.653, while the figures in bold represent those that have reached the threshold value, as shown in Table 4.
Total Influence Matrix of Criteria T (Manager Perspective).

Note. Any value greater than the threshold value is presented in bold (Dimensions [2.653], Existence [1.200], Relatedness [1.613], and Growth [1.767]).
Di + Sj represents the degree of correlation, whereas Di – Sj represents the degree of cause, which determines cause and effect. If Di – Sj is positive, it indicates that the dimension is a cause. If Di – Sj is negative, it shows that the dimension is an effect. These values are used to draw the NRM. For employees, one dimension is a cause and two dimensions are effects, as shown in Table 5.
Sum of Influences Given and Received on Dimensions and Criteria (Manager Perspective).
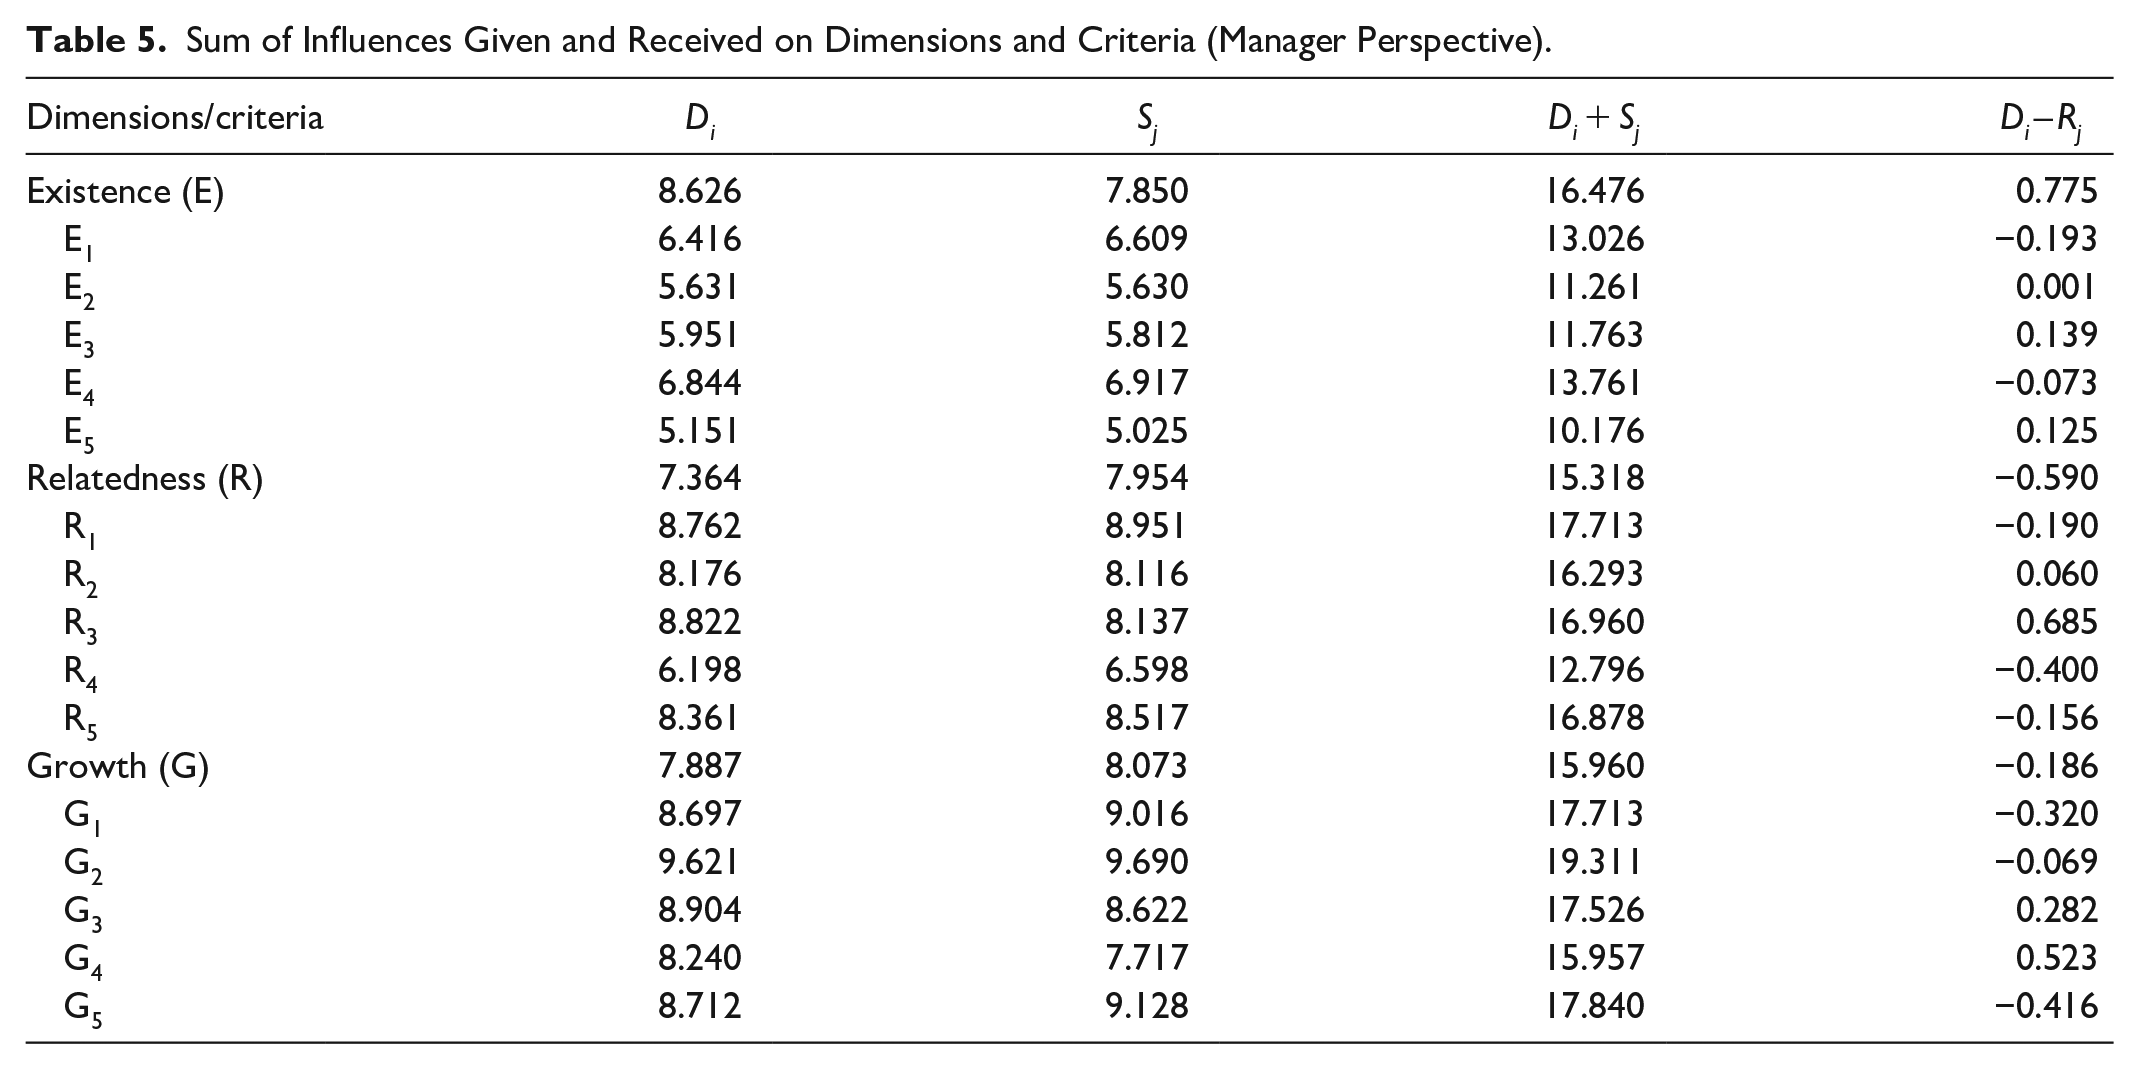
As Figure 5 shows, the main influence, according to managers, is relatedness. Perhaps this is because in the past, the basic pay an employee received upon first entering the workplace was half of what it is today, leading managers to believe that employees will stay as long as they offer them good wages and ensure their safety. Managers sense that they can improve relatedness by offering good compensation. Perhaps, this is because they believe that employees do not work hard enough and get into arguments with supervisors because they receive low pay, and thus they are unwilling to put in more effort and work harder. Therefore, according to managers, paying adequate wages encourages employees to work hard and actively pursue personal growth. If the employer cannot satisfy employees’ existence needs, various problems emerge, such as failure to work harder, reluctance to cooperate with supervisors, and low intention to learn and grow, eventually leading to employee turnover.

NRM of each dimension and criterion for talent retention and turnover of convenience stores (manager perspective).
Criteria under the Existence dimension (employees)
Along the horizontal axis, E1, E2, E3, E4, and E5 are influenced factors, while E1, E2, E3, E4, and E5 along the vertical axis are influence factors. The sum of influence factor Di is obtained by adding the values along the horizontal axis, while the sum of influenced factor Sj is obtained by summing the values along the vertical axis. The threshold value is calculated using the average value of the total influence relationship matrix to determine the direction of mutual influence between the criteria in the NRM. The threshold value for sub-dimensions under the Existence dimension (employees) is 1.207, while the figures in bold represent those that have reached the threshold value, as shown in Table 2.
Di + Sj represents the degree of correlation, whereas Di – Sj represents the degree of cause, which determines cause and effect. If Di – Sj is positive, it means that the dimension is a cause. If Di – Sj is negative, it means that the dimension is an effect. These values are used to draw the NRM. For employees, three sub-dimensions are causes and two sub-dimensions are effects, as shown in Table 3.
Figure 4 shows that Working Hours is the main sub-dimension and that it has the greatest influence under the Existence dimension for employees. This shows that employees attach greater importance to factors such as getting off work on time and whether working hours are too long. Judging from our internship experience, problems such as getting off work late, rotating shifts, and short-notice shift changes often occur at convenience stores, interrupting employees’ rest days and forcing them to remain updated with work information at all times. Most convenience stores pay employees hourly wages, and working at a convenience store is only a transitional job option for employees who are either still studying or in the midst of changing jobs. Frequent interruptions to rest days may disturb their ability to focus on learning the skills required to change jobs, forcing them to quit their convenience store job. If employers can improve this dimension and implement appropriate changes in the working environment, they will be able to increase employees’ work efficiency, overall revenue, and even improve their pay. Consequently, employees will choose to continue with their jobs and become the next generation of managers.
Criteria under the Existence dimension (managers)
Along the horizontal axis, E1, E2, E3, E4, and E5 are influenced factors, while E1, E2, E3, E4, and E5 along the vertical axis are influence factors. The sum of influence factor Di is obtained by summing the values along the horizontal axis, while the sum of influenced factor Sj is obtained by summing the values along the vertical axis. The threshold value is calculated using the average value of the total influence relationship matrix to determine the direction of mutual influence between the criteria in the NRM. The threshold value for sub-dimensions under the Existence dimension (managers) is 1.200, while the figures in bold represent those that reached the threshold value, as shown in Table 4.
Di + Sj represents the degree of correlation, whereas Di – Sj represents the degree of cause, which determines cause and effect. If Di – Sj is positive, then the dimension is a cause. If Di – Sj is negative, the dimension is an effect. These values are used to draw the NRM. For managers, three sub-dimensions are causes and two sub-dimensions are effects, as shown in Table 5.
As shown in Figure 5, managers believe that Pay is the most influential factor. This finding shows that managers perceive employees’ value as based on their workload. Managers also assert that the Working Environment, which is a cause, is the main factor influencing existence needs. This indicates that managers believe that for most employees, workplace safety is a major concern. Therefore, managers believe that if they provide a safe working environment for employees, they can significantly improve the company’s talent retention. A good working environment will increase employees’ work efficiency and reduce overtime work. In addition, due to improved working hours, more employees will stay in their jobs, thus reducing employee turnover. If the working environment is poor, employees will undoubtedly believe that their work is dangerous and not worth the risk because of the low pay. Moreover, not only may employees consider a poor working environment to be detrimental to their work efficiency, they may also see its potential to extend their working hours, which will fatigue them and eventually force them to quit.
Criteria under the Relatedness dimension (employees)
Along the horizontal axis, R1, R2, R3, R4, and R5 are influenced factors, while R1, R2, R3, R4, and R5 along the vertical axis are influence factors. The sum of influence factor Di is obtained by summing the values along the horizontal axis, while the sum of influenced factor Sj is obtained by summing the values along the vertical axis. The threshold value is calculated using the average value of the total influence relationship matrix to determine the direction of mutual influence between the criteria in the NRM. The threshold value for criteria under the Relatedness dimension (employees) is 1.224, while the figures in bold represent those that reached the threshold value, as shown in Table 2.
Di + Sj represents the degree of correlation, whereas Di – Sj represents the degree of cause, which determines cause and effect. If Di – Sj is positive, it indicates that the dimension is a cause. If Di – Sj is negative, it means that the dimension is an effect. These values are used to draw the NRM. For employees, three sub-dimensions are causes and two sub-dimensions are effects, as shown in Table 3.
Figure 4 shows that Leadership Style is the main influencing factor because convenience store managers wield excessive power, and their perceptions are always seen as correct, even when they are wrong. If employees are unable to accept such a perspective, it will certainly affect the Organizational Atmosphere and Mood at work. Thus, employees often work in a tense atmosphere and feel restless, which affects them both physically and mentally, and eventually compels them to leave their jobs. If employers can change their leadership style effectively and are willing to delegate responsibilities to increase employees’ ability to make independent judgments, thereby reducing the authoritarian culture imposed by store managers, they can reduce labor disputes and improve the overall organizational atmosphere, which will effectively reduce employee turnover.
Criteria under the Relatedness dimension (managers)
Along the horizontal axis, R1, R2, R3, R4, and R5 are influenced factors, while R1, R2, R3, R4, and R5 along the vertical axis are influence factors. The sum of influence factor Di is obtained by adding the values along the horizontal axis, while the sum of influenced factor Sj is obtained by summing up the values along the vertical axis. The threshold value is calculated using the average value of the total influence relationship matrix to determine the direction of mutual influence between the criteria in the NRM. The threshold value for sub-dimensions under the Relatedness dimension (managers) is 1.613, while the figures in bold represent those that reached the threshold value, as shown in Table 4.
Di + Sj represents the degree of correlation, whereas Di – Sj represents the degree of cause, which determines cause and effect. If Di – Sj is positive, it means that the dimension is a cause. If Di – Sj is negative, it indicates that the dimension is an effect. These values are used to draw the NRM. For managers, two sub-dimensions are causes and three sub-dimensions are effects, as shown in Table 5.
Figure 5 shows that the main reason is Disagreement with the Supervisor. In the convenience store industry, a supervisor’s ideas are usually representative of the entire convenience store. Employees who do not accept their supervisor’s ideas are deemed unable to accept the company’s ideas; therefore, they eventually quit. This situation can improve if managers are flexible and willing to only make decisions after discussing the possibilities with employees. For instance, labor–management meetings can be held regularly to understand supervisors’ thoughts, while effective channels can be provided such that employees can raise various problems with managers anonymously. Employers and employees are essentially on opposing sides. However, if they can communicate with each other effectively, the probability of conflict can certainly be reduced, leading to a better organizational atmosphere, and thus reducing employee turnover. Oddly, managers do not believe that Organizational Structure will be influenced by any factors. This could be a blind spot among supervisors, as they are unable to identify problems in their own organization.
Criteria under the Growth dimension (employees)
Along the horizontal axis, G1, G2, G3, G4, and G5 are influenced factors, while G1, G2, G3, G4, and G5 along the vertical axis are influence factors. The sum of influence factor Di is obtained by adding the values along the horizontal axis, while the sum of influenced factor Sj is obtained by summing the values along the vertical axis. The threshold value is calculated using the average value of the total influence relationship matrix to determine the direction of mutual influence between the criteria in the NRM. The threshold value for sub-dimensions under the Growth dimension (employees) is 0.847, while the figures in bold represent those that have reached the threshold value, as shown in Table 2.
Di + Sj represents the degree of correlation, whereas Di – Sj represents the degree of cause, which determines both cause and effect. If Di – Sj is positive, it implies that the dimension is a cause. If Di – Sj is negative, it indicates that the dimension is an effect. These values are used to draw the NRM. For employees, two sub-dimensions are causes and three sub-dimensions are effects, as shown in Table 3.
As Figure 4 shows, Personality Trait is the most important indicator influencing growth needs. This probably indicates that most employees believe that personality traits influence all their workplace problems. Employees with good personality traits will not contribute to the loss of the company’s positive corporate image. However, personality traits cannot be changed; hence, most employees believe that before hiring, a company should focus on their personality first and then their abilities. Hiring that does not reflect this prioritization will probably have significant adverse effects on the company.
Criteria under the Growth dimension (managers)
G1, G2, G3, G4, and G5 along the horizontal axis are influenced factors, while G1, G2, G3, G4, and G5 along the vertical axis are influence factors. The sum of influence factor Di is obtained by summing the values along the horizontal axis, while the sum of influenced factor Sj is obtained by summing the values along the vertical axis. The threshold value is calculated using the average value of the total influence relationship matrix to determine the direction of mutual influence between the criteria in the NRM. The threshold value for sub-dimensions under the Growth dimension (managers) is 1.767, while the figures in bold represent those that reached the threshold value, as shown in Table 4.
Di + Sj represents the degree of correlation, whereas Di – Sj represents the degree of cause, which determines cause and effect. If Di – Sj is positive, it means that the dimension is a cause. If Di – Sj is negative, it means that the dimension is an effect. These values are used to draw the NRM. For managers, two sub-dimensions are causes and one sub-dimension is an effect, as shown in Table 5.
Figure 5 shows that Work Flexibility is the main influencing factor. In managers’ opinion, if employees have a moderate degree of freedom at work, they will be more serious about working and less prone to job burnout. Therefore, their intention to quit will decline. Personality Trait, which is the second main influencing factor, influences Lack of Education and Training. This may be because managers believe that employees with poor personality traits can be identified during education and training and will not be formalized; hence, Lack of Education and Training will not influence other indicators.
Using the DANP Technique to Find Indicators’ Influential Weights
The main purpose of DANP is to determine the weights used to identify the criteria employees and managers emphasize when making decisions about retention and turnover. This study uses the DANP formulas described in Section 3 to determine the weight of each criterion from the questionnaires collected and identify both important and insignificant factors through analysis (as shown in Tables 6 and 7).
DANP Weights Analysis (Employee Perspective).
Note. The values in ( ) denote ranking order.
DANP Weights Analysis (Manager Perspective).

Note. The values in ( ) denote ranking order.
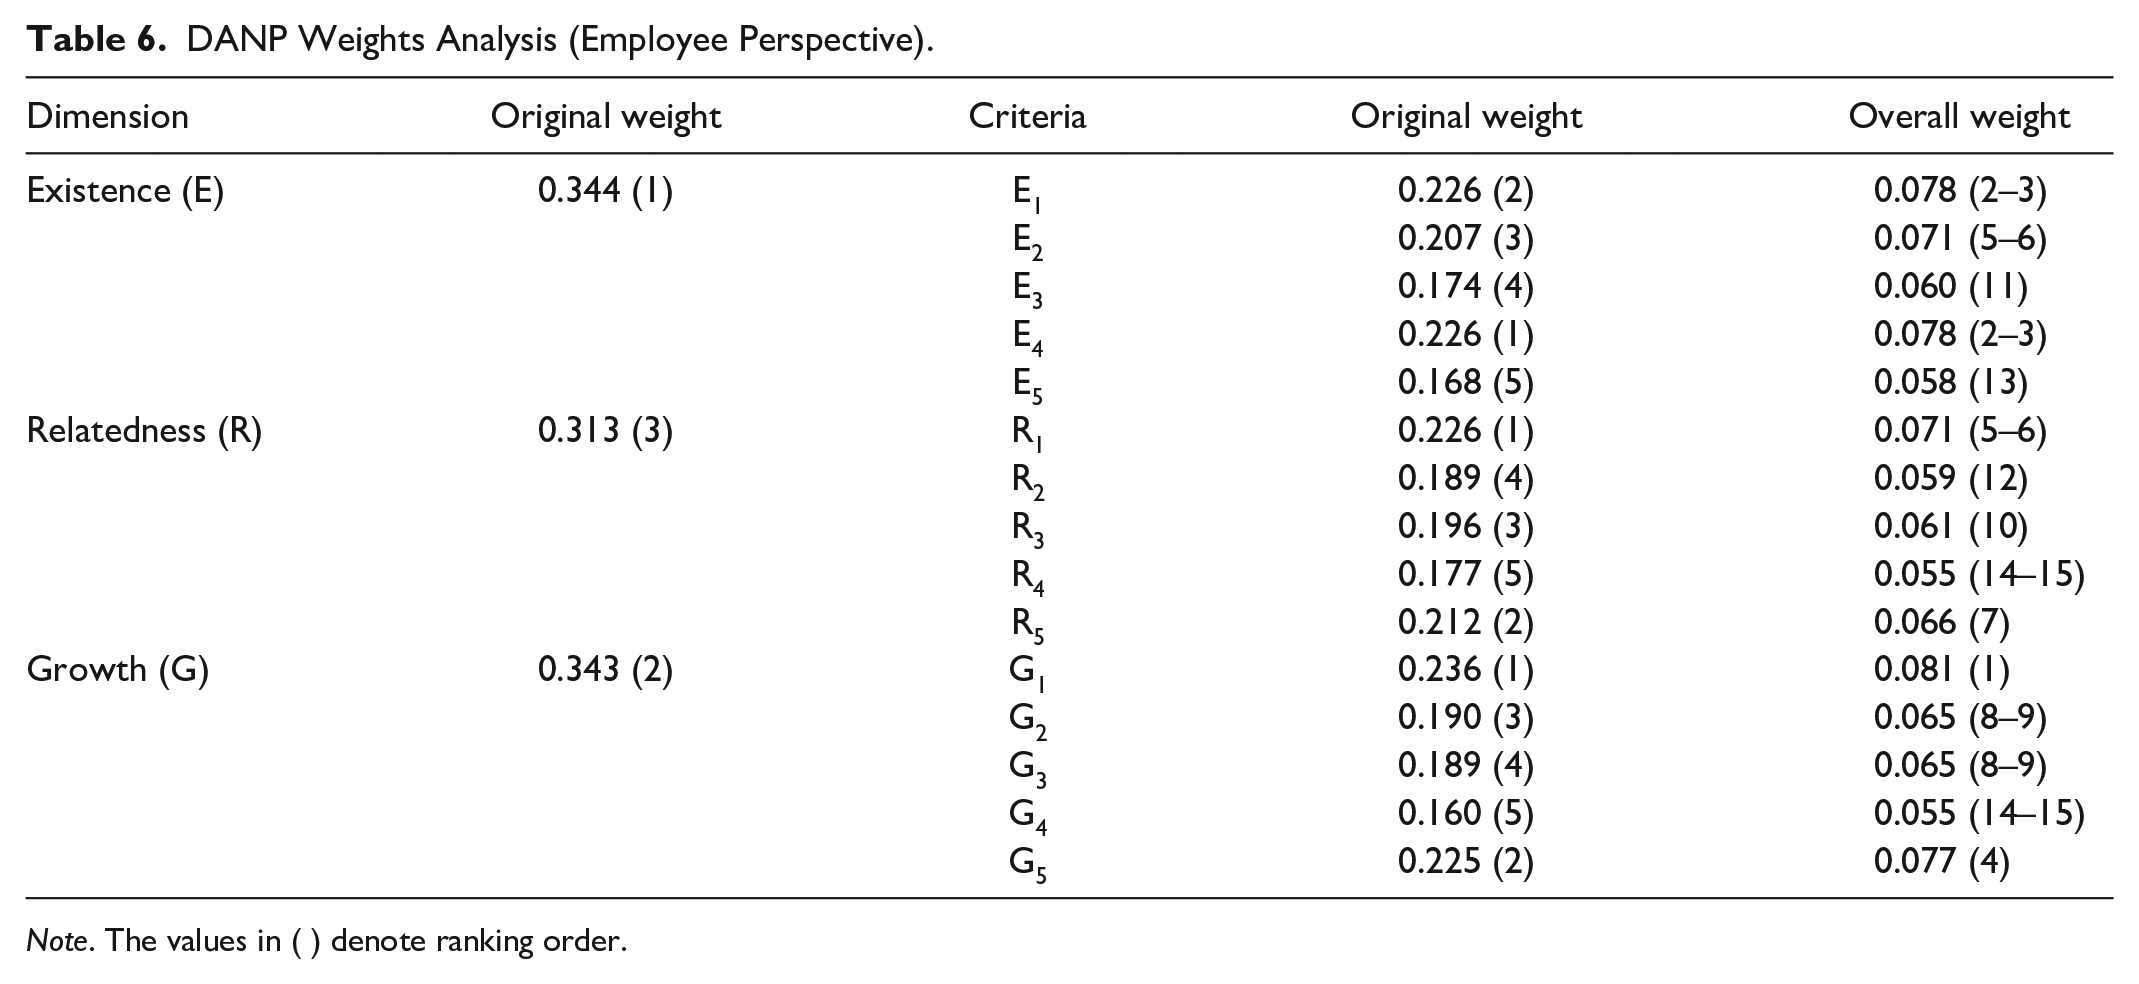
Based on the criteria for employees’ dimensions, Existence (E) is the most important, followed by Growth (G). This indicates that employees emphasize these two factors the most before quitting. Among the sub-dimensions under Existence, the most important factor is Working Hours. The duration of working hours influences the intent to work. The least important factor is the Reward and Punishment Mechanism because it is an internal assessment system established by companies; since employees do not experience the impact of this mechanism, it has little influence on their work intention.
Based on the criteria for managers’ dimensions, Growth (G) is the most important factor, followed by Relatedness (R). This indicates that according to managers, employees emphasize these two factors the most before quitting. Among the sub-dimensions under Growth, the most important factor is Lack of Education and Training, as managers opine that adequate education and training will influence employees’ intention to stay, whereas the least important factor is Personality Trait because managers believe that personality traits will not have any such influence.
Discussion and Managerial Implications
This study objectively analyses the various issues upon which convenience store managers should focus to retain talent, understand why employees quit, and respond to such situations. More importantly, it provides feasible and appropriate talent retention strategies for managers to apply in practice and assists in striking the best balance in the relationship between convenience store managers and employees.
The empirical results are as follows. First, according to the causality model, we can recognize the interrelationships between each dimension and criterion in the NRM (Figures 4 and 5). In the case of convenience store employees, relatedness, as illustrated in Figure 4, affects other dimensions such as growth and existence. Clearly, relatedness is important, as it has the strongest influence in its relationship with the other dimensions. Hence, in order to reduce employee turnover, convenience store employees must improve this dimension first, followed by growth and existence. In the case of convenience store managers, existence, as noted in Figure 5, affects growth and relatedness. Clearly, existence is important, as it has the strongest influence in its relationships with the other dimensions. Hence, when identifying talent retention strategies at convenience stores, managers must first improve this dimension, followed by growth and relatedness.
Second, after discussing the dimensions, we described each criterion considered for convenience store managers and employees. Figures 4 and 5 illustrate the NRM of the criteria, according to the analysis results. Hence, for convenience store managers, considering the influential relationships between these criteria, working environment (E3) was the most influential in the existence dimension and must be improved first, followed by health (E2), the reward and punishment mechanism (E5), working hours (E4), and pay (E1). Similarly, for employees, the influential relationships between these criteria show that work hours was the most influential in the existence dimension and must be improved first, followed by working environment, the reward and punishment mechanism, pay, and health. Moreover, Figures 4 and 5 provide further details on the causality relationship between convenience store talent retention and turnover models, based on managers’ and employees’ perspectives. Each evaluation dimension and criterion creates the behavior necessary to induce job turnover in convenience stores. Therefore, convenience store managers and employees must evaluate all the dimensions and criteria to understand how to use them to retain talent and reduce job turnover, as illustrated in Figures 4 and 5. The subsequent evaluation model can then be applied to convenience stores in Penghu.
Finally, the study used DANP to confirm the influential weight of each of the 15 criteria. Among convenience store employees, as Table 6 indicates, the highest weights belong to corporate image (G1; 0.081), pay (E1; 0.078), working hours (E4; 0.078), burnout at work (G5; 0.077), health (E2; 0.071), and organizational atmosphere (R1; 0.071). This indicates that corporate image, pay, and working hours can encourage convenience store employees to retain their jobs. The lowest weights belong to leadership style (R2; 0.059), the reward and punishment mechanism (E5; 0.058), organizational structure (R4; 0.055), and personality trait (G4; 0.055); consequently, these actions are the least influential. Figure 4 and Table 6 both illustrate the prioritization of improvement criteria from top to bottom, as improving the most influential criteria produces substantial effects. In prioritizing the dimensions and criteria for improvement, the NRM must be considered to reduce any gaps and meet the demands of convenience stores. Improving different criteria could also influence the results, either directly or indirectly.
Among convenience store managers, as Table 7 indicates, the highest weights and thus the strongest influence belong to working hours (E4; 0.076), organizational atmosphere (R1; 0.074), lack of education and training (G2; 0.074), pay (E1; 0.073), mood at work (R5; 0.070), and burnout at work (G5; 0.070). This indicates that working hours, organizational atmosphere, lack of education and training, and pay can assist managers with talent retention. The lowest weights belong to personality (G4; 0.059), the reward and punishment mechanism (E5; 0.055), and organizational structure (R4; 0.054); consequently, these actions are the least influential. Figure 5 and Table 7 both illustrate the prioritization of improvement criteria from top to bottom, as improving the most influential criteria produces substantial effects. In prioritizing the dimensions and criteria for improvement, the NRM must be considered to reduce any gaps and meet managers’ needs. Improving different criteria could also influence the results, either directly or indirectly.
The data analysis shows that when formulating talent retention strategies, managers can implement improvement strategies from different perspectives than before. This will assist them in implementing appropriate methods in areas that need to be improved in order to retain suitable talent. Simultaneously, dimensions and criteria related to talent retention allow managers to analyze employees objectively. Based on the results, employees can determine the areas upon which they should focus before quitting and determine if they have the required skills, experience, and attitude to stay at their job. This information can assist employees qualitatively and quantitatively when they are hired at FamilyMart convenience stores by creating better job retention prospects. By analyzing the dimensions and sub-dimensions of turnover, employees can understand themselves better and recognize the problems they do not want to face at work. Furthermore, employees can also understand the work they value the most after leaving their job, and identify their ambitions, thereby reducing their prospects of quitting in the future.
In summary, the talent retention and turnover evaluation model differs from those used in previous studies and makes valuable contributions to the research on convenience stores in Penghu. The evaluation model can help managers and employees improve their efficiency in talent retention and implement a strategy to reduce employee turnover.
Conclusions, Recommendations, and Limitations
This study established the sources of dimensions and criteria for both managers and employees. It also determined the causal relationships between them, formulated improvement strategies through computations and maps based on the comparative analysis conducted for both managers and employees, and obtained three research results.
Conclusions
The following suggestions are proposed based on the findings. First, based on the literature review, this study identified three dimensions, namely existence, relatedness, and growth. It also identified 15 criteria: pay, health, working environment, working hours, the reward and punishment mechanism, organizational atmosphere, leadership style, disagreement with the supervisor, organizational structure, mood at work, corporate image, lack of education and training, work flexibility, personality, and burnout at work. These dimensions and criteria are important indicators to assist convenience store managers with employee retention, as they indicate factors that encourage employees to either stay or quit. Second, this study employed the DEMATEL analysis method to draw an NRM of dimensions and criteria for employees and managers, and determined the causal relationships between them. Finally, this study employed the DANP analysis method to compute each indicator’s influential weight and then determined managers’ and employees’ preferences in making decisions about retention and turnover at convenience stores based on these weights. Finally, it provided suggestions to help managers reach a common ground with employees.
Recommendations for Future Research
This study investigated the factors influencing employee turnover based on the needs in the dimensions of existence, relatedness, and growth. It is suggested that future research consider Herzberg’s two-factor theory and further divide the sub-dimensions proposed in this study into hygiene factors and motivating factors in order to investigate ways to inspire employees, thereby increasing their intention to stay in their jobs and reducing their intention to quit. Moreover, dimensions and sub-dimensions related to talent retention allow managers to assess employees objectively. When interviewing respondents and reviewing completed questionnaires, there may be ambiguities in the answers and actual situation of respondents due to external interference; hence, future research can incorporate fuzzy theory. Hence, we can only make improvements based on the primary reasons for employee turnover at convenience stores.
Research Limitations
This study has investigated the reasons for employee turnover at convenience stores in Penghu based on related needs while being objective and precise. However, there were two limitations. First, this study has only investigated the reasons for employee turnover from the perspective of managers at convenience stores in the main island of Penghu but did not conduct the same investigation at convenience stores in the outer islands of Penghu. Therefore, it remains to be seen if the study findings are distorted. Second, the study respondents were rank and file employees at convenience stores in Penghu. Although the questionnaire data were consistent, it was not possible to fully understand the reasons for employee turnover due to the uneven age distribution of employees at each convenience store. Hence, improvements can only be made on the main reasons to reduce employee turnover rates.
Footnotes
Declaration of Conflicting Interests
The author(s) declared no potential conflicts of interest with respect to the research, authorship, and/or publication of this article.
Funding
The author(s) received no financial support for the research, authorship, and/or publication of this article.