
Abstract
Although the web accessibility of universities around the world is well documented, much remains unknown about this aspect of higher education institutions in the UK. Using three automated web accessibility tools (TAW, WAVE and EIII Page Checker), this study explores the accessibility of the homepages of 66 research-intensive universities with respect to the WCAG 2.0 checkpoints. The results show that the most common checkpoint violations involve the provision of text alternatives for non-text content, contrast errors and the need to increase the computability of webpages with future technologies and tools. The results show that there are variations between UK universities, and there is some evidence of consistent compliance amongst the university homepages. However, when evaluated against results from similar studies of web accessibility in other countries, these web pages perform well. Overall, this study adds to the body of knowledge on web accessibility in higher education in the UK.
Introduction
An increase in the use of technology in the UK has led to web accessibility becoming a major issue. A common focus of web accessibility is the topic of disability. There are an estimated 13.7 million disabled people in the UK. A person is defined as disabled if they have a self-reported long-standing condition, illness, or impairment that reduces their ability to carry out day-to-day activities (Office for National Statistics, 2020). The definition of web accessibility has expanded since the initial definitions set out by Slatin and Rush (2003), Thatcher et al. (2002) and the World Wide Web Consortium (W3C, 2020a). Berners-Lee’s famous statement, “The power of the Web is in its universality. Access by everyone, regardless of disability is an essential aspect” set in motion the study and design of webpages to ensure that they meet the needs of the user (W3C, 2020a).
However, web accessibility should not focus solely on people with disabilities, and this was highlighted in guidance from the UK Government (2020) on making services accessible. The aim of accessibility is to make services available to as many people as possible. Factors which may affect the ability of a individual to use a service include health (a user may have a broken arm, or may be fatigued or recovering from a stroke), location (the user may have a Wi-Fi connection, or may be in a noisy café or an outdoor park) and equipment (the user may have an older mobile phone or an outdated internet browser).
The need for a unified, diverse definition of web accessibility was stated by Petrie et al. (2015), who analyzed 50 definitions of web accessibility. These definitions were taken from a variety of sources such as standards, papers, guidelines and online sources, from the period 1996 to 2014. The analysis highlighted six core concepts: groups of users and their characteristics; what users should be able to do; the characteristics of the website; the technologies used; the design and development of the website; and the characteristics of the situations of use.
In 1997, the W3C published their Web Content Accessibility Guidelines (WCAG), which consisted of checkpoints for use in the design of accessible webpages. WCAG 2.0 was published in December 2008, and WCAG 2.1 in June 2018. For each checkpoint, there are testable criteria for success that are based at three levels: A, AA, and AAA. WCAG 2.0 and 2.1 consist of 12 and 13 guidelines, respectively, and cover four principles, which specify that web content must be perceivable, operable, understandable, and robust. Table 1 summarizes the implications of these principles.
Guideline Principles of WCAG.
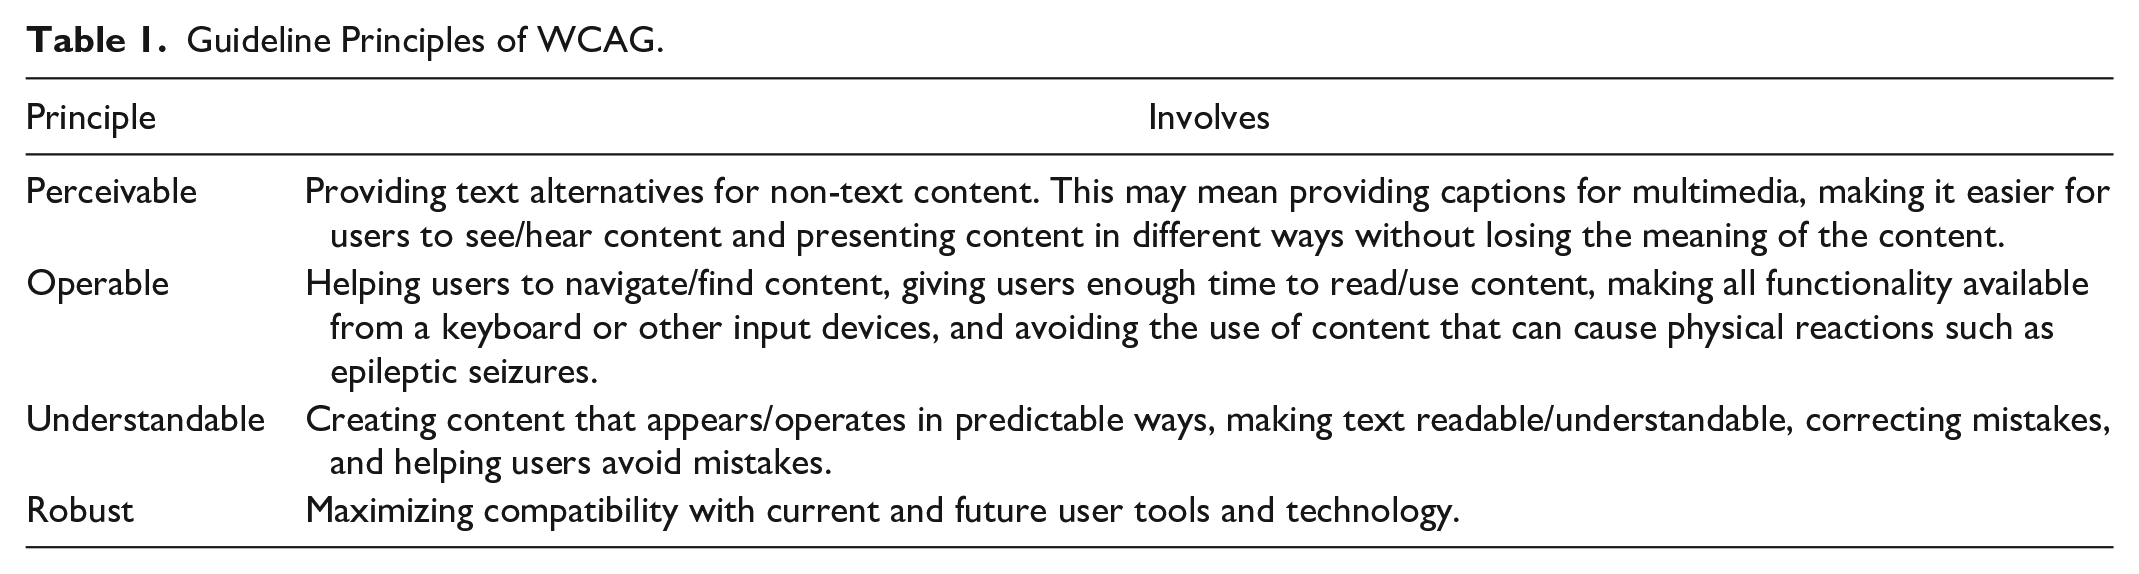
The three confirmation levels (A, AA, and AAA) are used to meet the needs of a variety of situations and users: level A refers to the minimum level of accessibility, whereas level AAA reflects a broad level of accessibility for a variety of situations. Since some content is not able to meet the criteria for level AAA, the WCAG does not recommend conformance at this level. Meeting the criteria for level AA means that the criteria for level A must also be met (University of California, 2020)
An example that illustrates the difference between these levels of conformity centers on the WCAG 2.1 criteria for “time-based media audio-only and video-only (pre-recorded).” One criterion at level A is as follows: “Captions are provided for all pre-recorded audio content in synchronized media, except when the media is a media alternative for text and is clearly labelled as such.” The corresponding criterion at level AA is: “Captions are provided for all live audio content in synchronized media,” and for level AAA, this is: “Sign language interpretation is provided for all pre-recorded audio content in synchronized media.” Each level contains more detail and adds to the experience for the user. Level AAA is the optimum form of compliance and can ensure that a webpage is accessible to the maximum number of users (W3C, 2020b).
In 2018, legislation was introduced in the UK to force public sector websites and applications to meet certain standards of web accessibility. This law, The Public Sector Bodies (Websites and Mobile Applications) (No.2) Accessibility Regulations 2018, required public sector organizations to ensure that their websites and mobile applications complied with WCAG 2.1 AA accessibility standards and to publish an accessibility statement to explain how accessible their website/mobile applications were (Ilona, 2018).
Universities are public sector organizations, and the use of accessible websites and mobile applications can enhance the experience for students who from a wide variety of backgrounds with varying amounts of technical experience. One area which needs more research is web accessibility within UK universities. A study by Sloan et al. (2002) analyzed 11 UK university websites, using a combination of an automated analysis tool (Bobby), manual evaluation against the WCAG guidelines in force at the time, and heuristic evaluation. The results showed that only two of 11 websites met the criteria for classification as accessible.
Using a slightly different approach, Abu Shawar (2015) evaluated the accessibility of six websites for universities in Jordan against six from the UK and six from other Arab regions. To assess the accessibility, an automated tool (WAVE) and manual checking were utilized. The results indicated that the accessibility errors of the university websites in Jordan and the Arab regions were greater than those in the UK. Rashidi et al. (2013) studied various elements of the websites of British and Iranian university websites to compare their quality, focusing less on web accessibility and more on the usability of the web pages. Their results showed that websites for Iranian universities contained higher rates of error compared to British ones.
A more extensive study by Sitemorse (2019) of higher education institutions in the UK found that 80% of the universities tested scored less than five out of 10 for web accessibility. Of the 349 universities studied, 134 institutions scored zero out of ten for accessibility. The authors ran a WCAG audit, searched for broken links and measured the performance of the website, although the way in which the WCAG audit was carried out was not disclosed and the methodology used to check for accessibility was not released to the public.
In view of the lack of research into the web accessibility of UK universities, the aim of this study is to explore the levels of conformity of the homepages of research-intensive universities in the UK, using various automated web accessibility tools. The goals are to assess whether web accessibility standards are being met (and if not, which violations are the most frequent) and how the results compare with those of similar studies in the UK and around the world. The results from this study will allow research intensive universities and other stakeholders to analyze the accessibility of the information presented on the university homepage. Accessible information is of benefit to stakeholders for research collaborations, attracting potential students, partnership working, and supporting students/current researchers at the university.
Inaccessible information may affect business and reputation. The Public Sector Bodies (Websites and Mobile Applications) (No.2) Accessibility Regulations 2018 will not be met, and this can cause issues in the future. From a research standpoint, this study will add to research already done on web accessibility of UK university webpages and will allow comparisons to be made with other research intensive in other countries.
The structure of this paper is as follows. Section 2 describes previous studies from around the world on web accessibility and higher education. Section 3 gives the details of the methodology used here, and Section 4 presents the results. Section 5 discusses the results and Section 6 concludes the paper.
Previous Studies of Web Accessibility in Higher Education
There have been numerous studies of web accessibility around the world. Different countries have varying laws and policies on web accessibility, and examples include Australia’s Disability Discrimination Act 1992, China’s voluntary web accessibility standard of 2008, Hong Kong’s 1999 policy on the dissemination of information through government websites, Norway’s regulations of 2013 on the universal design of ICT, and New Zealand’s online practice guidelines of 2013. One positive aspect is that many countries have incorporated WCAG 2.0 web accessibility guidelines, despite the fact that laws and policies in this area are several years old (W3C, 2020c)
Appendix Table 1 summarizes various web accessibility studies involving university webpages from around the world. A variety of methodologies have been utilized, including popular automated tools such as WAVE and TAW. Several studies such as those by Kane et al. (2007), Kesswani and Kumar (2016), Parajuli and Eika (2020) and Thompson et al. (2010) have utilized manual extraction methods in their methodologies to explore the web accessibility of university homepages. The results of most of these studies have highlighted the issue of a lack of basic compliance by these webpages.
Studies such as those by Alahmadi and Drew (2017), Laufer Nir and Rimmerman (2018), and Parajuli and Eika (2020) have assessed the accessibility of additional university webpages, for example those of individual courses or libraries, which were more rounded in terms of accessibility. Although university homepages are public-facing webpages, accessibility standards should also be followed by private-facing pages, such as those that can only be accessed by staff and students at the university. Unlike other studies in this area, Laufer Nir and Rimmerman (2018) focused on a single university as a case study and explored other types of webpage to allow for a broader view of accessibility, examining nine pages in total. The accessibility results for the library homepage were compared with those of another university. However, the study findings presented a snapshot rather than an overall image of accessibility across higher education institutions in Israel.
In terms of guidelines, most of the studies in Appendix Table 1 assessed the university webpages against the WCAG 2.0 checkpoints, while earlier studies used the WCAG 1.0 guidelines. Rana et al. (2011) used both WACG 1.0 and 2.0 for their accessibility assessment. Only one of the most recent studies (Parajuli & Eika, 2020) assessed web accessibility using the WCAG 2.1 guidelines, which were published in 2018.
The studies in Appendix Table 1 highlight the current debate over whether automated tools or manual evaluation are more effective in assessing web accessibility. A large majority of the studies utilized automated tools, but some (Kesswani & Kumar, 2016; Kurt, 2011; Parajuli & Eika, 2020) used a combination of automated and manual techniques. In the study by Parajuli and Eika (2020), visually impaired participants took part in accessibility tasks relating to university homepages. The Firefox Accessibility Evaluation Toolbar was used for manual evaluation by Kesswani and Kumar (2016), and Kurt (2011) manually assessed the (X)HTML and CSS codes for the university homepages. However, in Thompson et al.’s (2010) study, a Web accessibility expert assessed the websites, and did not incorporate automated methods. This methodology has not been adopted in subsequent work in this area.
The studies in Appendix Table 1 used varying sample sizes drawn from a range of countries. Authors such as Alahmadi and Drew (2017), Kane et al. (2007), Kesswani and Kumar (2016) and Máñez-Carvajal et al. (2019a) analyzed webpages from universities from different countries, allowing for various comparisons between accessibility evaluations and the corresponding results, and giving a larger overall sample size.
In this section, we have shown how the evaluation of accessibility amongst university webpages has evolved over the years. In the next section, we will explain the details of the methodology used in the present study.
Methodology
To investigate and compare the accessibility of university homepages in the UK, the top 66 universities from Scimago (2020) were selected, and these are listed in Appendix Table 2. Scimago ranks each university based on its research performance, innovation results and social impact, which is measured by the visibility of its website (Scimago, 2020). Scimago was used in a study by Acosta-Vargas et al. (2020) to select Latin American universities in order to evaluate their web accessibility. In total, 120 research universities were ranked by research performance. According to the Complete University Guide (2021), there are currently 130 UK universities in total.
The aim of the current study is to answer the following research questions:
RQ1 What are the most common major violations of web accessibility checkpoints in UK university homepages?
RQ2 How do the results of this study compare with those from other countries?
Automated Tool Selection
Based on previous studies (Baroudi et al., 2020; İşeri et al., 2017; Laufer Nir & Rimmerman, 2018; Máñez-Carvajal et al., 2019a), WAVE, TAM and EIII Page Checker were selected as tools for assessing web accessibility. For this study, automated tools were selected rather than manual evaluation such as user testing, since the latter is more time- and labor-intensive, and user evaluation is subjective. Although both automated and manual approaches have their respective limitations, Verkijika and De Wet (2020) highlighted that the use of automated tools to measure web accessibility can be equally as effective as a manual approach. Several studies (e.g., Akgül, 2021; Baroudi et al., 2020; Ismail & Kuppusamy, 2019; Máñez-Carvajal et al., 2019a) have all successfully used automated tools alone.
WAVE (https://WAVE.webaim.org/) is an online accessibility evaluation tool that can not only detect many WCAG errors but also incorporate a human evaluation of web content. WAVE checks the compliance of the webpage against WCAG 2.1 checkpoints, and highlights using icons any information on the webpage that is important for an accessibility evaluation. Red icons indicate accessibility issues that need to be fixed, while green icons show accessibility features which could be improved and the other icons/alerts indicate elements which need to be examined. WAVE creates a summary of its findings and displays them in six categories (errors, contrast errors, alerts, features, structural features, and accessible rich internet applications (ARIAs). Documentation is provided for each icon and for items that the system cannot check, in order to allow the user to check these themselves. For example, WAVE may not be able to check whether the alternative text is correct and appropriate and will therefore flag this text for the user so it can be evaluated (Wave, 2020).
TAW is an automatic online tool for measuring the level of web accessibility of webpages against the WCAG 2.0 guidelines. There are two types of checks in TAW: automatic, in which the tool detects an accessibility issue which must be solved, and manual, in which the tool detects the existence of a web accessibility problem the evaluator must confirm or discard (TAW, 2020). When a webpage is analyzed, the results of the analysis are presented in the form of problems, warnings, or “not reviewed” items. Warnings require a human review, while “not reviewed” items require a full manual review, because the tool is unable to evaluate the issue. The problems, warnings and “not reviewed” items are displayed against the checklist for the WCAG 2.0 guidelines in all four areas (perceivable, operable, understandable, and robust). This allows the evaluators to establish a strategy for fixing the webpage to make it more accessible, and to access information about each checkpoint.
The EIII (European Internet Inclusion Initiative, 2020) developed a page checker that allows for an evaluation of the accessibility of webpages, based on the WCAG 2.0 guidelines. The results of the evaluation are transferred into a grading chart, and scores are given as follows: 100 = no tests failed; 95 to 99 = a few tests failed; 85 to 95 = some tests failed; 70 to 85 = many tests failed; 0 to 70 = most tests failed.
Results
Tests of the web accessibility of the homepages of 66 UK universities produced a variety of results, which are presented in Appendix Table 3. These results are described in more detail in subsequent sections.
EIII Page Checker
The results from this tool shows that 10.6% of universities failed many tests, and the University of Essex had the lowest score of 75.51%. For this university, 69 barriers were identified, and the failed tests are shown in Figure 1. The number of instances in which the University of Essex homepage passed or failed checkpoints can be seen from Figure 1.

Checkpoints failed by the University of Essex.
Most of the checkpoints with violations highlighted in Figure 1 referred to many instances, such as needing to add alternative text to images (1.1.1), providing descriptive labels for forms (3.3.2), adding unique IDs for elements (4.1.1) and providing titles for links (4.1.2). The University of Essex passed 12 checkpoints and failed 11.
Of the total sample of university homepages, 38% failed some checkpoints, and only two universities (University of Bath and University of Cambridge) scored 100%. One university returned a server error when the homepage was put through the checker. The average accessibility score was 93.28, with a standard deviation (SD) of 5.28, a skewness of −1.36 and kurtosis of 1.48. The highly skewed distribution indicates that very few universities scored above average. This is shown by the positive kurtosis value, which means that many of the scores were in the tail end of the distribution that is, average or below average.
WAVE
Contrast errors refer to the text and background colors. Of the university homepages tested, 74.2% contained this type of error. The average was nine errors, with an SD of 8.59, indicating some variance between universities. The most common type of contrast error was a very low level of contrast between the text and the background color. The contrast ratio should be more than 4.5:1, and in these cases was too low. It is important to fix this error, especially for users who have problems such as limited vision or color blindness. The higher the contrast ratio, the easier the text is for a user to read. A weak positive relationship (R2 = 0.028) was observed between the number of ARIA elements and the number of contrast errors. More interactive webpages did not necessarily have more contrast errors. ARIA elements are attributes that are added to HTML elements to make applications and web content more accessible to users who rely on assistive technology.
One significant finding was that 95.45% of the university homepages had ARIA elements in their homepages, and 13 of them contained more than 100 instances. The homepage of the University of Leicester had the most ARIA elements, with 772. WAVE can identify the manual checks that need to be done for ARIA elements, for example:
○ Ensuring that each ARIA label value or element is descriptive and accurate.
○ Ensure the state, roles and properties of each element are used correctly.
○ Ensure that tab index is used correctly.
○ Ensure that the live region is properly tested and presents content updates (this is important for screen readers);
○ Ensure that an element that is defined as a button functions as a button, and that it is navigable with a keyboard.
○ Ensure that the element triggers an ARIA menu, list box, tree, or grid.
This highlights how manual checks can help to increase web accessibility and make web designers aware of the need for compliance. WAVE determined that when contrast errors were excluded, 72.7% of university homepages still contained errors, with an average of 5.18. These errors can affect certain types of users and represent a failure to meet WCAG 2.0 standards. Four homepages (University of Essex, Plymouth University, Bangor University, and Cranfield University) contained more than 10 errors. The most common types included empty links, missing form labels and empty headings. In the same way as for the EII page checker Cranfield University and the University of Essex failed more tests.
Alerts may cause accessibility issues, and these were prevalent amongst the webpages examined here, with 33% containing more than the average of 24. Kings College London contained the most alerts, with 148. Many of these were due to redundant title text, in which the advisory information for the title attribute value is identical or similar to the element text. This should be avoided; instead, the text should describe what the element is when users hover over it and advise the user on how to use the element.
Based on the total number of errors and alerts, including contrast errors, there were 2,281 checkpoint violations with an average of 19 violations per university. Of the sample examined here, 66.6% had an above-average number of violations, indicating that some work still needs to be done to improve web accessibility.
Figure 2 shows that there was a weakly positive relationship between the interactivity of a homepage and the total number of violations. This finding illustrates that a small number of universities are taking responsibility for ensuring web accessibility and marketing themselves effectively. However, the results from WAVE show that many of these universities have work to do in order to achieve basic compliance with web accessibility standards. The presence of contrast errors means that it is difficult for some users to access information from the university homepage. This can affect interactions between (potential) students and the university, and can hinder the marketing efforts of the university in terms of advertising its research accomplishments.

Relationship between interactivity and number of web accessibility violations.
TAW
Figure 3 presents a breakdown of the types of errors highlighted by TAW with the corresponding categories of WCAG guidelines.

Types of error per category of the WCAG guidelines (total number of problems = 2,250; warnings = 7,594; unverified issues = 1,107).
Problems highlight areas in which accessibility corrections are needed. The average number of problems was 34, with an SD of 25.28. Most of the problems were related to the category of robustness, which reflects how reliably data can be interpreted by a wide variety of users who rely on assistive technologies. The most frequent types of problems were associated with guideline checkpoints 1.3.1 (Info and relationship), 1.1.1 (Non-text content), 4.1.1 (Parsing) and 4.1.2 (Name, role, value). Checkpoints 1.1.1 and 1.3.1 are related to the aspect of perceivability, whereas 4.1.1, and 4.1.2 are related to robustness.
Checkpoint 1.1.1 relates to all non-text content presented to the user having a text alternative, while 1.3.1 focuses on the structure, information and relationships which are conveyed through presentation, available in text or determined via programming. Checkpoint 4.1.1 relates to markup language and ensuring that elements have complete start and end tags, do not contain duplicate attributes and are nested correctly, and that element IDs are unique unless the specification allows for these features. 4.1.2 focuses on all user interface components and ensuring that the name and role can be programmatically determined, and that states, properties can be programmatically set by the user when appropriate. Notification regarding changes to user interface components must be available to user agents and assistive technology, so that it can be conveyed back to the user. The checkpoints mentioned here are level A guidelines, which refer to basic accessibility standards. Other types of problems indicated by our TAW analysis of these universities were related to checkpoints 2.4.4 (Link purpose in context), 3.1.1 (Language of page), 3.2.2 (On input) and 3.3.2 (Labels or instructions).
The total number of warnings was higher than the number of problems and unverified issues combined. The average number of warnings was 115, with an SD of 80.14. A total of 28 universities had more than the average number of warnings that required human review. The university with the highest number of warnings was the University of Keele, which had warnings for checkpoints 1.3.2 (Meaningful sequences), 1.4.4 (Resize text), 2.4.1 (Bypass blocks), 2.4.2 (Page title), 2.4.6 (Headings and labels), 3.3.1 (Error identification), 3.3.3 (Error suggestion) and 3.3.4 (Error prevention). These warnings mainly related to checkpoints in the category of operability, and this result was also found for the other 27 universities. This category is concerned with user interface components and navigation.
The lower numbers of unverified issues highlighted that manual reviews of some issues were still required in some cases. The average number of unverified issues was 16.7, with 41 universities having more than an average number of unverified issues on their homepage. In the same way as the warnings, unverified issues were mainly related to operability. Eight universities had the highest number of unverified issues. Unverified issues require a full manual review and cannot be automatically reviewed. These issues were related to guidelines such as 1.3.3 (Sensory characteristics); 1.4.1 (Use of color); 1.4.3 (Contrast minimum), 1.4.5 (Images of text), 2.1.1 (Keyboard), 2.1.2 (No keyboard trap), 2.2.1 (Timing adjustable), 2.2.2 (Pause, stop, hide), 2.3.1 (Three flashes or below threshold), 2.4.3 (Focus order), 2.4.5 (Multiple way), 2.4.7 (Focus visible), 3.1.2 (Language of parts), 3.2.1 (On focus), 3.2.3 (Consistent navigation), and 3.2.4 (Consistent identification). Most of the guidelines fell into the category of operability, which relates to user interface components.
Figure 4 shows the variance of violations amongst the universities and shows all instances in which the WCAG 2.0 checkpoints were not met.

Number of instances in which checkpoints were not met by universities.
A total of 47% of the universities had more than the average number of 166 instances, indicating that some work remains to be done. An SD of 93 indicated a large variance between universities. The University of Keele had the highest number of instances, whereas Kings College London, The University of Manchester, University of Nottingham, University of Birmingham, University of Southampton and London School of Hygiene and Tropical Medicine had the least.
The top five universities with the highest number of instances (University of Keele, University of Hull, Liverpool John Moores University, University of Reading, and University of Leicester) had varying results from the other two accessibility validators. The University of Keele returned a server error with the EIII page checker, and an analysis with WAVE showed an above-average number of total instances in which checkpoints were not met. However, there were other universities with higher numbers of instances where checkpoints were not met. For the University of Keele, most of the instances were based on structural elements. In comparison, the University of Hull achieved a high score with the EIII Page Checker (90.39), but WAVE identified a relatively high number of instances where checkpoints were not met (535 compared to 526 for the University of Keele).
Overall, the results from these automated accessibility tools highlight several areas which need to be worked on. Some universities have been better at implementing web accessibility than others.
Discussion
RQ1: What are the Most Common Major Violations in Web Accessibility Checkpoints in UK University Homepages?
The results from the various automated accessibility tools presented in Section 4 highlighted a variety of checkpoint violations. The areas in which these tools indicated that corrections were needed, and the most common violations and checkpoints were as follows:
□
□
□
□
□
□
□
□
The violations span all four categories of guidelines (perceivable, operable, understandable, and robust). The higher number of Priority 1 (Level A) violations indicates that most universities need to correct various elements to achieve basic accessibility compliance. Table 2 shows the violations picked up by TAW and the corresponding percentages of university homepages that violated each checkpoint.
Percentage of University Homepages with Violations of Checkpoints.

A comparison of our results with those of other studies that explored the web accessibility of UK universities, such as those by Abu Shawar (2015) and Rashidi et al. (2013), highlighted some similarities in the results. Although the two other studies had significantly smaller samples, they explored more webpages from the sample of universities. Abu Shawar (2015), who utilized WAVE, found that the most common error in UK university websites was an absence of form labels. This was a common checkpoint violation highlighted in this study.
The number of accessibility errors found for the UK universities by Abu Shawar (2015) was slightly lower than the errors found by WAVE for the homepages of some of the same universities used in this study. This highlights that there are some universities that take web accessibility more seriously, and which can share best practice guidelines and tips on how to create web accessible webpages. The impact of checkpoint violations was emphasized by Rashidi et al. (2013), who examined webpage errors in 10 UK university websites. These were divided into major and minor errors. Major errors related to server connectivity, document type declarations, applet usage, image loading, frame tag usage and broken links. Minor errors were mainly associated with HTML tags, which play a big part in web accessibility errors and affect a website’s visual quality. They were related to image, font, script, style, form, link, table, body, head and frame tags.
The study by Sitemorse (2019) found that of the 349 universities studied, 80% scored less than five out of 10 for web accessibility, and 134 scored zero. Similar results were observed in our study. The EIII page checker showed that 87.9% of university homepages failed web accessibility tests. When WAVE was utilized, 74.2% of the university homepages were found to contain web accessibility errors, and when TAW was applied, 100% of the webpages showed problems. The results for the UK indicate that although universities are in some cases taking web accessibility seriously, there is some way to go in terms of achieving compliance for the homepages of all research-intensive universities. As universities try to attract more students by making their homepages more interactive, web accessibility must not be forgotten, and these pages must meet more than the basic accessibility checkpoints to attract more students. The university cannot achieve equality and diversity if students struggle to access information. The UK studies did not cover priority levels.
RQ2: How do the Results of This Study Compare With Those of Other Countries?
Previous studies, such as those by Baroudi et al. (2020), İşeri et al. (2017), Máñez-Carvajal et al. (2019a) and Máñez-Carvajal et al. (2019b), have used similar sets of automated tools to the ones used in this study.
The results from the EIII checker reported by both Baroudi et al. (2020) and İşeri et al. (2017) showed that despite the use of a small sample (half as many universities as this study), 30% and 37% of the universities, respectively, failed some tests. In the present study, 36% of the university homepages failed some tests and only 10.6% failed many tests. This indicating that UK institutions are on the right path in terms of web accessibility. However, few studies have utilized the EIII page checker, unlike WAVE and TAW; one of the reasons for this is that the EIII page checker does not go far enough in terms of highlighting the categories of errors and their priorities.
Our results from WAVE were favorable compared to those reported by Baroudi et al. (2020) and İşeri et al. (2017), and the average number of errors and the standard deviation were lower for the UK university homepages. Studies such as those by Máñez-Carvajal et al. (2019a) and Máñez-Carvajal et al. (2019b) identified more contrast errors in their WAVE analyses, whereas the universities examined here performed well. The average number of contrast errors reported by Baroudi et al. (2020) was 46, whereas İşeri et al. (2017) found 42, Máñez-Carvajal et al. (2019a) found 49.9 and Máñez-Carvajal et al. (2019b) found 23. The present study used a larger sample of universities and found an average of 6.56 contrast errors.
The TAW tool was able to gather more information on the categories of errors and priorities. The greatest numbers of common errors reported in prior studies differ. We found a higher total number of errors than Máñez-Carvajal et al. (2019a) and Máñez-Carvajal et al. (2019b), but this can be explained by the larger sample used in our study. However, the average number of errors reported here (34) was relatively low compared to the totals found by Baroudi et al. (2020) (93.8), İşeri et al. (2017) (35) and Máñez-Carvajal et al. (2019a) (35 for Spain, 85.6 for Chile and 49.73 for Mexico).
In terms of error categories, our study and that of İşeri et al. (2017) mainly found errors in robustness, whereas Baroudi et al. (2020), Máñez-Carvajal et al. (2019a) and Máñez-Carvajal et al. (2019b) found errors in perceivability. Problems with robustness indicate that the content needs to be interpretable by assistive technology and user agents. This is in comparison to perceivability errors which centers on work being done on the user interface components. Baroudi et al. (2020) highlight this finding, and state that the user interfaces for Jordanian universities need to be improved.
Most of the non-compliance problems had level A or AA priorities, and there was a higher percentage of non-compliance with level A. This finding was also reported by Máñez-Carvajal et al. (2019b) but not by Máñez-Carvajal et al. (2019a), who found that Level A compliance was significantly higher. Some of the studies in Appendix Table 1 (Akgül, 2021; Parajuli & Eika, 2020; Rana et al., 2011; Verkijika & De Wet, 2020) also highlighted a lack of compliance with Level A checkpoints.
Common errors such as missing form labels and empty headings were associated with checkpoints at both level A and level AA. As in the present study, Máñez-Carvajal et al. (2019a) and Máñez-Carvajal et al. (2019b) also found that the errors most frequently detected by TAW were 1.1.1 (Non-text content), which is important for users who rely on screen readers, and 2.4.4 (Link purpose in context), which helps users to navigate the website.
However, there were differences in the categories of understandability and robustness. For the former, the present study and Máñez-Carvajal et al. (2019a) found high numbers of instances of inadequate use of label elements 3.3.2 (Labels or instructions), whereas Máñez-Carvajal et al. (2019b) found that form control errors were more common. In terms of robustness, source code errors (e.g., unique IDs for elements, correct element attributes and titles for links) were found to be the most common in this study and those by Máñez-Carvajal et al. (2019a) and Máñez-Carvajal et al. (2019b).
Currently, there are no web accessibility studies which specifically focus on research intensive universities abroad. To provide a comparison with research intensive universities in other countries, the methodology in this study was applied to the top 5 Scimago (2021) research performance rated university homepages. The universities were based in the United States, Africa and Asia.
In terms of EIII Page Checker, the universities in the United States performed well, with an average score of 92.32. This score was the closest to the UK average score of 93.28. For the United States, a standard deviation (SD) of 3.92, indicated some consistency between the EIII scores and the compliance with web accessibility checkpoints. Homepages of Africa and Asia universities both had lower average scores (85.20, SD 7.08 and 81.19, SD 8.33) respectively, showing more failed checkpoints.
The most common checkpoints not met included Africa (4.1.2- Use HTML form controls and links and 1.1.1 Use alt on img elements), Asia (1.1.1 Use alt on img elements and 4.1.2- Accessible name for image links) and United States (4.4.1-Define ids for elements and 4.1.2- Accessible name for image links). In comparison, the common missed checkpoints for UK universities were contrast errors and missing form labels.
Examining the results from the WAVE tool, all the universities sampled from Africa and the United States had contrast errors. From the Asia universities, two universities had no contrast errors leaving 60% which had contrast errors. For the UK, 74.2% of universities had home pages which had contrast errors. In terms of ARIA elements, none of the Asian Universities and one of the African universities had any. The United States universities all had ARIA elements with an average of 108. Similarly, 95.45% of the UK university homepages had ARIA elements. This indicated that the UK, United States, and African universities are designing interactive homepages to attract stakeholders and potential students.
TAW detected that most of the problems were categorized in different areas (Africa- Operable, Asia-Perceivable and United States-Robust). United States demonstrated similar results to UK universities in terms of category most problems appeared in, but the average number of problems was slightly lower at 24. The Asian universities had the highest number of problems overall- 536 (SD- 76.4) indicating a lot of work is needed for accessibility corrections compared to the UK and United States. Africa had a slightly lower total of 412 (SD- 42.2) problems overall but there is also still work to do to address the web accessibility issues. Overall, the results of the studies described here show that countries are at different stages on their journey towards web accessibility. Our study of UK university homepages highlights that work needs to be done to correct common errors, with a particular focus on contrast errors. This will allow more users to be able to access material on the homepages and will “future proof” these web pages against new technologies.
The results from the automated web accessibility tools applied to several universities in Africa, Asia and the United States show that UK universities performed well against universities from those countries. However, compliance with some Level A checkpoints was not achieved, and this needs to be addressed. Web accessibility performance needs to be consistent between all universities. Those universities who performed well in terms of web accessibility need to share guidelines for best practice, and discussions need to take place amongst universities to allow for improvement.
Limitations
The sample of universities in this study did not include all the universities in the UK, and consequently the results gives a more focused snapshot of web accessibility, rather than a rounded view. The reason behind this was to focus on the universities which performed well research wise. The further down the university is in the Scimago rankings, the less research intensive it is likely to be. A larger sample of universities from other countries will allow more meaningful comparisons.
The methodology utilized here involved three automated tools, rather than focusing on one. University homepages were sampled in this study, instead of using a more in-depth approach in which fewer universities were sampled but more webpages associated with the university were tested
Conclusions and Future Work
The issue of web accessibility is important for research-intensive universities, as they aim to attract students and advertise their research to stakeholders. This study, which assessed the web accessibility of UK university homepages against the WCAG 2.0 guidelines, recorded a variety of results. The most common checkpoint violations involved providing text alternatives for non-text content, contrast errors and increasing the computability of webpages with future technologies and tools. The use of three automated web accessibility tools highlighted the variability between these homepages in terms of their accessibility. However, compared to the web accessibility of similar webpages from other countries around the world, the UK universities performed well. This study will inform research intensive universities of where they need to improve the design of their home page and webpages.
Future research will involve examining university web accessibility further by examining more webpages for each university and a greater number of universities overall. A more in-depth investigation into the challenges that users face when accessing information from university webpages is also needed, as this will give a more rounded view of the accessibility of these pages. More research is needed into the accessibility of research-intensive universities abroad. This can act as a comparator with results from this study.
Footnotes
Appendix
Results.

| University | EIII Page Checker Score | WAVE | TAM problem | Warning | Unverified | ||||||||||||||||||
|---|---|---|---|---|---|---|---|---|---|---|---|---|---|---|---|---|---|---|---|---|---|---|---|
| E | CE | A | F | S | AR | T | P | O | U | R | T | P | O | U | R | T | P | O | U | R | T | ||
| 1 | 99.8 | 3 | 6 | 7 | 37 | 122 | 9 | 184 | 5 | 7 | 1 | 17 | 30 | 86 | 74 | 6 | 16 | 182 | 4 | 7 | 5 | 0 | 16 |
| 2 | 94.64 | 1 | 4 | 8 | 16 | 36 | 2 | 67 | 4 | 0 | 3 | 12 | 19 | 21 | 16 | 12 | 6 | 55 | 4 | 9 | 4 | 0 | 17 |
| 3 | 100 | 0 | 0 | 6 | 38 | 41 | 1 | 86 | 3 | 0 | 0 | 2 | 5 | 33 | 49 | 0 | 0 | 82 | 4 | 8 | 6 | 1 | 18 |
| 4 | 99.12 | 4 | 4 | 16 | 33 | 96 | 25 | 178 | 1 | 7 | 0 | 2 | 10 | 29 | 52 | 6 | 105 | 192 | 4 | 9 | 5 | 0 | 18 |
| 5 | 89.34 | 1 | 13 | 148 | 18 | 71 | 280 | 622 | 0 | 0 | 1 | 0 | 1 | 1 | 2 | 0 | 0 | 3 | 4 | 9 | 5 | 1 | 19 |
| 6 | 98.98 | 0 | 2 | 44 | 73 | 71 | 2 | 192 | 0 | 0 | 1 | 0 | 1 | 1 | 2 | 0 | 0 | 3 | 4 | 9 | 5 | 0 | 19 |
| 7 | 93.88 | 0 | 2 | 14 | 34 | 29 | 9 | 88 | 25 | 0 | 10 | 27 | 62 | 14 | 25 | 12 | 0 | 51 | 4 | 8 | 5 | 9 | 17 |
| 8 | 97.05 | 1 | 7 | 17 | 14 | 32 | 2 | 73 | 0 | 0 | 1 | 0 | 1 | 1 | 2 | 0 | 0 | 3 | 4 | 9 | 5 | 1 | 19 |
| 9 | 81.65 | 0 | 0 | 2 | 20 | 16 | 40 | 78 | 17 | 1 | 4 | 14 | 36 | 16 | 18 | 12 | 10 | 56 | 4 | 8 | 4 | 0 | 16 |
| 10 | 95 | 0 | 0 | 8 | 20 | 71 | 10 | 109 | 2 | 2 | 3 | 0 | 7 | 28 | 44 | 18 | 1 | 91 | 4 | 9 | 5 | 1 | 19 |
| 11 | 95.67 | 0 | 8 | 10 | 14 | 54 | 14 | 100 | 0 | 0 | 1 | 0 | 1 | 1 | 2 | 0 | 0 | 3 | 4 | 9 | 5 | 1 | 19 |
| 12 | 95.22 | 8 | 17 | 22 | 9 | 34 | 25 | 115 | 0 | 0 | 1 | 0 | 1 | 1 | 2 | 0 | 0 | 3 | 4 | 9 | 5 | 1 | 19 |
| 13 | 91.45 | 0 | 4 | 44 | 35 | 57 | 92 | 232 | 11 | 9 | 3 | 6 | 29 | 19 | 31 | 12 | 3 | 65 | 4 | 8 | 5 | 0 | 17 |
| 14 | 87.83 | 0 | 0 | 32 | 21 | 46 | 27 | 126 | 21 | 0 | 9 | 10 | 40 | 9 | 70 | 12 | 9 | 91 | 4 | 8 | 4 | 0 | 16 |
| 15 | 96.37 | 6 | 0 | 9 | 19 | 57 | 75 | 166 | 6 | 2 | 1 | 5 | 14 | 16 | 43 | 18 | 0 | 77 | 4 | 9 | 5 | 0 | 18 |
| 16 | 99.27 | 2 | 3 | 11 | 37 | 26 | 101 | 180 | 7 | 4 | 0 | 28 | 39 | 40 | 45 | 12 | 35 | 132 | 4 | 7 | 5 | 0 | 16 |
| 17 | 97.68 | 0 | 2 | 31 | 30 | 64 | 191 | 318 | 2 | 1 | 1 | 15 | 19 | 16 | 67 | 12 | 11 | 106 | 4 | 8 | 5 | 0 | 7 |
| 18 | 98.42 | 1 | 5 | 12 | 24 | 41 | 46 | 129 | 31 | 1 | 12 | 18 | 62 | 63 | 31 | 18 | 0 | 112 | 4 | 8 | 5 | 0 | 17 |
| 19 | 98.64 | 0 | 43 | 16 | 19 | 75 | 53 | 206 | 19 | 0 | 0 | 42 | 61 | 10 | 87 | 36 | 4 | 137 | 4 | 8 | 5 | 0 | 17 |
| 20 | 95.18 | 3 | 0 | 44 | 29 | 42 | 30 | 148 | 21 | 9 | 9 | 14 | 53 | 67 | 40 | 12 | 22 | 141 | 4 | 8 | 5 | 0 | 17 |
| 21 | 93.87 | 7 | 0 | 8 | 16 | 34 | 10 | 75 | 0 | 0 | 0 | 1 | 1 | 1 | 2 | 0 | 0 | 3 | 4 | 9 | 5 | 1 | 19 |
| 22 | 95.17 | 6 | 5 | 9 | 12 | 60 | 470 | 562 | 13 | 14 | 6 | 6 | 39 | 39 | 60 | 18 | 40 | 157 | 4 | 8 | 4 | 1 | 17 |
| 23 | 94.75 | 5 | 15 | 5 | 10 | 23 | 60 | 118 | 3 | 5 | 1 | 4 | 13 | 4 | 8 | 12 | 17 | 41 | 4 | 9 | 5 | 0 | 18 |
| 24 | 93.12 | 1 | 0 | 11 | 37 | 56 | 100 | 205 | 9 | 6 | 5 | 11 | 31 | 44 | 51 | 24 | 0 | 119 | 4 | 8 | 4 | 0 | 16 |
| 25 | 85.84 | 3 | 23 | 26 | 21 | 51 | 435 | 559 | 3 | 1 | 1 | 40 | 45 | 37 | 21 | 18 | 38 | 114 | 4 | 7 | 5 | 0 | 16 |
| 26 | 89.34 | 2 | 0 | 3 | 18 | 45 | 20 | 88 | 4 | 2 | 3 | 6 | 15 | 31 | 26 | 12 | 6 | 75 | 4 | 9 | 4 | 0 | 17 |
| 27 | 100 | 7 | 7 | 16 | 16 | 11 | 0 | 57 | 4 | 2 | 1 | 36 | 43 | 15 | 13 | 6 | 0 | 34 | 4 | 8 | 5 | 1 | 18 |
| 28 | 99.47 | 0 | 0 | 7 | 25 | 92 | 60 | 184 | 1 | 2 | 5 | 1 | 9 | 48 | 57 | 12 | 0 | 117 | 4 | 9 | 4 | 1 | 18 |
| 29 | 94.5 | 3 | 5 | 18 | 22 | 60 | 6 | 114 | 8 | 0 | 3 | 6 | 17 | 26 | 42 | 12 | 0 | 80 | 4 | 8 | 5 | 0 | 17 |
| 30 | 97.36 | 10 | 10 | 19 | 25 | 242 | 772 | 1078 | 14 | 25 | 0 | 20 | 59 | 47 | 82 | 18 | 133 | 280 | 4 | 8 | 5 | 0 | 17 |
| 31 | 94.77 | 8 | 11 | 42 | 49 | 92 | 68 | 270 | 11 | 1 | 1 | 10 | 23 | 88 | 66 | 12 | 0 | 166 | 4 | 8 | 5 | 0 | 17 |
| 32 | 94.08 | 1 | 2 | 36 | 10 | 66 | 13 | 128 | 13 | 3 | 2 | 7 | 25 | 8 | 52 | 18 | 0 | 78 | 4 | 8 | 4 | 0 | 16 |
| 33 | 95.41 | 1 | 0 | 12 | 36 | 74 | 99 | 222 | 5 | 14 | 2 | 20 | 41 | 53 | 48 | 18 | 0 | 119 | 4 | 9 | 4 | 0 | 17 |
| 34 | 95.72 | 2 | 1 | 37 | 19 | 59 | 83 | 201 | 8 | 2 | 2 | 13 | 25 | 26 | 48 | 24 | 13 | 111 | 4 | 7 | 4 | 0 | 15 |
| 35 | 89.98 | 1 | 6 | 7 | 17 | 67 | 71 | 169 | 10 | 12 | 0 | 14 | 26 | 28 | 59 | 12 | 2 | 101 | 4 | 8 | 5 | 0 | 17 |
| 36 | 78.97 | 9 | 5 | 12 | 7 | 12 | 46 | 91 | 17 | 0 | 6 | 17 | 40 | 25 | 277 | 6 | 0 | 308 | 4 | 9 | 4 | 0 | 17 |
| 37 | 80.6 | 0 | 0 | 21 | 10 | 83 | 56 | 170 | 16 | 18 | 6 | 35 | 75 | 18 | 72 | 6 | 0 | 96 | 4 | 9 | 5 | 0 | 18 |
| 38 | 96.56 | 0 | 15 | 6 | 27 | 48 | 67 | 163 | 7 | 3 | 0 | 25 | 35 | 23 | 32 | 12 | 7 | 74 | 3 | 8 | 5 | 0 | 16 |
| 39 | 93.24 | 2 | 1 | 14 | 31 | 44 | 87 | 179 | 10 | 6 | 4 | 7 | 27 | 75 | 45 | 18 | 16 | 154 | 4 | 8 | 5 | 0 | 17 |
| 40 | 81.8 | 2 | 16 | 61 | 6 | 31 | 1 | 117 | 5 | 0 | 3 | 3 | 11 | 18 | 26 | 6 | 2 | 52 | 4 | 9 | 4 | 0 | 17 |
| 41 | 98.03 | 0 | 1 | 14 | 31 | 37 | 0 | 83 | 7 | 2 | 7 | 0 | 16 | 43 | 35 | 12 | 0 | 90 | 4 | 7 | 5 | 0 | 16 |
| 42 | 75.51 | 31 | 23 | 14 | 14 | 41 | 3 | 126 | 31 | 8 | 13 | 21 | 73 | 22 | 29 | 54 | 4 | 109 | 4 | 8 | 4 | 0 | 16 |
| 43 | 91.22 | 14 | 2 | 15 | 26 | 59 | 12 | 128 | 24 | 7 | 4 | 10 | 45 | 35 | 59 | 18 | 0 | 112 | 4 | 8 | 4 | 0 | 16 |
| 44 | 98.07 | 5 | 30 | 78 | 15 | 160 | 2 | 290 | 24 | 7 | 4 | 10 | 45 | 35 | 59 | 18 | 0 | 112 | 4 | 8 | 4 | 0 | 16 |
| 45 | 95.38 | 5 | 0 | 34 | 66 | 57 | 30 | 192 | 22 | 4 | 2 | 19 | 47 | 18 | 90 | 12 | 4 | 124 | 4 | 8 | 5 | 0 | 17 |
| 46 | 96.95 | 0 | 9 | 3 | 16 | 69 | 68 | 165 | 4 | 1 | 4 | 17 | 26 | 21 | 24 | 12 | 7 | 64 | 4 | 9 | 4 | 0 | 17 |
| 47 | 95.35 | 10 | 2 | 38 | 32 | 53 | 76 | 211 | 14 | 13 | 2 | 13 | 42 | 50 | 61 | 12 | 15 | 138 | 4 | 7 | 5 | 0 | 16 |
| 48 | 99.98 | 0 | 0 | 12 | 34 | 68 | 21 | 135 | 11 | 8 | 0 | 4 | 23 | 48 | 91 | 6 | 14 | 159 | 4 | 6 | 5 | 0 | 15 |
| 49 | 76.8 | 9 | 3 | 57 | 32 | 126 | 0 | 227 | 27 | 1 | 3 | 13 | 44 | 49 | 113 | 12 | 71 | 245 | 4 | 8 | 5 | 0 | 17 |
| 50 | 92.07 | 5 | 2 | 13 | 43 | 94 | 12 | 169 | 19 | 13 | 6 | 9 | 47 | 208 | 77 | 18 | 11 | 314 | 4 | 8 | 5 | 0 | 17 |
| 51 | 91.23 | 6 | 5 | 24 | 22 | 80 | 144 | 281 | 17 | 12 | 5 | 10 | 44 | 37 | 79 | 18 | 2 | 136 | 4 | 7 | 4 | 0 | 15 |
| 52 | 90.39 | 0 | 25 | 28 | 56 | 79 | 347 | 535 | 13 | 10 | 4 | 128 | 155 | 73 | 63 | 12 | 0 | 148 | 4 | 8 | 4 | 0 | 16 |
| 53 | 87.41 | 3 | 9 | 37 | 49 | 54 | 130 | 282 | 6 | 5 | 4 | 35 | 50 | 86 | 45 | 18 | 2 | 151 | 4 | 8 | 4 | 0 | 16 |
| 54 | 89.08 | 6 | 1 | 21 | 40 | 57 | 10 | 135 | 9 | 9 | 5 | 5 | 28 | 42 | 17 | 18 | 0 | 77 | 4 | 9 | 4 | 0 | 17 |
| 55 | 88.92 | 17 | 1 | 21 | 39 | 125 | 87 | 290 | 19 | 1 | 4 | 33 | 57 | 22 | 76 | 24 | 3 | 125 | 4 | 8 | 4 | 0 | 16 |
| 56 | 95.06 | 8 | 2 | 19 | 32 | 89 | 519 | 669 | 8 | 9 | 2 | 5 | 24 | 34 | 57 | 30 | 1 | 122 | 4 | 8 | 4 | 0 | 16 |
| 57 | 95.79 | 1 | 0 | 14 | 14 | 38 | 91 | 158 | 11 | 4 | 3 | 9 | 27 | 15 | 32 | 18 | 6 | 71 | 4 | 8 | 4 | 0 | 16 |
| 58 | server error | 5 | 0 | 28 | 45 | 358 | 90 | 526 | 39 | 9 | 6 | 18 | 72 | 64 | 401 | 12 | 22 | 499 | 4 | 8 | 5 | 0 | 17 |
| 59 | 95.58 | 1 | 5 | 18 | 26 | 38 | 30 | 118 | 10 | 0 | 3 | 12 | 25 | 51 | 39 | 0 | 36 | 126 | 4 | 8 | 5 | 0 | 17 |
| 60 | 96.15 | 0 | 1 | 8 | 29 | 48 | 55 | 141 | 4 | 7 | 1 | 3 | 15 | 70 | 43 | 12 | 0 | 125 | 4 | 8 | 5 | 0 | 17 |
| 61 | 92.92 | 7 | 13 | 30 | 26 | 48 | 91 | 215 | 3 | 18 | 4 | 15 | 40 | 31 | 56 | 18 | 0 | 105 | 4 | 8 | 4 | 0 | 16 |
| 62 | 94.18 | 1 | 4 | 24 | 38 | 46 | 65 | 178 | 10 | 10 | 4 | 2 | 26 | 32 | 38 | 18 | 10 | 98 | 4 | 9 | 4 | 0 | 17 |
| 63 | 98.92 | 2 | 13 | 78 | 46 | 99 | 187 | 425 | 31 | 0 | 4 | 13 | 48 | 64 | 67 | 18 | 5 | 154 | 4 | 9 | 5 | 1 | 19 |
| 64 | 84.1 | 13 | 17 | 12 | 19 | 78 | 5 | 144 | 15 | 11 | 6 | 22 | 54 | 47 | 50 | 6 | 37 | 140 | 4 | 7 | 4 | 0 | 15 |
| 65 | 99.29 | 1 | 0 | 61 | 39 | 46 | 44 | 191 | 2 | 0 | 1 | 4 | 6 | 51 | 24 | 6 | 3 | 84 | 4 | 8 | 5 | 0 | 17 |
| 66 | 95.17 | 1 | 23 | 25 | 24 | 122 | 113 | 308 | 7 | 13 | 1 | 59 | 80 | 36 | 46 | 18 | 2 | 102 | 4 | 8 | 4 | 0 | 16 |
Author’s Note
This article is the original work. I am submitting this work for the first publication in the Journal. It is not being considered for publication elsewhere and has not already been published elsewhere
Declaration of Conflicting Interests
The author declared no potential conflicts of interest with respect to the research, authorship, and/or publication of this article.
Funding
The author received no financial support for the research, authorship, and/or publication of this article.