
Abstract
Improving energy efficiency is widely identified as shifting energy usage to an optimal status in order to ultimately strengthen a country’s competitiveness and development, and indeed this is of particular relevance to the Association of Southeast Asian Nations plus Six’ (ASEAN+6). The traditional data envelopment analysis (DEA) approach has extensively been employed for estimating energy efficiency, but it does not properly utilize the weight in the DEA model to probe the behavior change of a decision making unit (DMU). This research therefore applies a progressive time-weighted dynamic efficiency model (PTDEM) to estimate the energy efficiency of ASEAN+6 and discusses the issues concerning their energy decoupling rates and decarbonization. The proposed model herein fully considers a DMU’s behavior change by estimating its energy efficiency. Empirical results reveal that: (i) improvements in energy efficiency within ASEAN are greater than in the other six countries; (ii) members of ASEAN still have more room for improvement than the other six countries with regard to achieving the standard ratio of the energy decoupling rate; and (iii) there is no evidence of convergence to decarbonization within ASEAN+6.
Introduction
Energy is not only an indispensable resource, but also a major driving force behind national development, but an undesirable side effect of fossil fuel energy usage is the production of greenhouse gas (GHG) emissions. Odugbesan and Rjoub (2020) mentioned that developing an energy conservation policy will enhance the potential growth of their economy. Over the past two decades, the Association of Southeast Asian Nations (ASEAN) have enjoyed excellent economic efficiency performance, but unfortunately resulted in increased GHG emissions in which most increased emissions are attributable to fossil-fuel combustion (World Resources Institute, 2011). Despite the current level of energy consumption, with per capita energy consumption in the region being lower than the average value in developed countries, the expected increase in population and increased urbanization and industrialization within the region will no doubt lead to significant increases in energy demand. According to a 2019 IEA report, with a forecasted average annual growth rate of 2.3% between 2018 and 2040, GHG emissions in ASEAN is expected to grow seven times as fast as the global annual average over the same period. While the region’s share of global emissions is relatively small (4.3% in 2018), it looks to increase by more than half to 6.5% by 2040 (International Energy Agency, 2019).
With its rapid economic growth, ASEAN should pay more attention to the performance of energy use. Given that government policy is an essential element in improving energy efficiency, several energy efficiency improvement policies have been introduced over the past decade and a half, with some exceptional results. Specifically, 30% of all final energy demand was covered by these energy efficiency policies by 2015, or a rise of 11% from 2000, with these policies resulting in significant energy savings. Energy efficiency improvement policies also bring other benefits, such as reduced GHG emissions and improved air quality, and indeed IEA has reported that policies aimed at enhancing energy efficiency and further decarbonization of the energy supply will be the major drivers leading to reductions in global GHG emissions.
In order to achieve the international climate agreement requirement to lower GHG emissions, ASEAN members need to design effective climate policies that fully consider national economic growth, population growth, and environmental protection. Furthermore, ASEAN members are closely related to their neighboring developed countries (such as China, Japan, South Korea, Australia, and New Zealand), both in terms of economic growth and environmental protection. For example, Luukkanen and Kaivo-oja (2002) indicated that the industrialization phase among ASEAN+6 including 10 ASEAN countries, Australia, China, India, Japan, Korea, and New Zealand increases their energy intensity, which may raise fossil fuel demand and eventually spur the growth of CO2 emissions even further. In fact, energy usage performance plays an important role in sustainable development. With the rapid economic expansion under the industrialization phase, it is important to have a firm understanding of energy usage performance in ASEAN+6 in order to design appropriate energy policies capable of facing up to the future challenges of climate change.
Based on our best knowledge, past studies have tried to evaluate the performance of energy use by using data envelopment analysis (DEA), especially for the framework of total-factor energy efficiency proposed by Hu and Wang (2006). Comparing with traditional DEA, many studies mentioned that the weight-restricted DEA model often imposes additional constraints on the weights of the input and/or output variables, which are used to judge overall efficiency, and enhances the discrimination of efficiency ranking (Allen et al., 1997; Dyson & Thanassoulis, 1988; Oikonomou et al., 2016; Podinovski & Bouzdine-Chameeva, 2016; Wong & Beasley, 1990). However, past research discussing energy efficiency of ASEAN members still has not investigated the dynamic situation under the weight-restricted DEA, and hence our study creates a weight-restricted dynamic DEA model to estimate energy efficiency for ASEAN+6.
This study also involves the idea of progressive time weighted into the DEA model since traditional DEA basically sets the same weight on each period’s data. We assert that DMUs’ behaviors will change over time, and hence there will be a higher weight on the current data and lesser weight on the early data. Therefore, this study mainly estimates the total-factor energy efficiency of ASEAN+6 using a progressive time-weighted dynamic efficiency model (PTDEM) and discusses issues concerning their energy decoupling rates and decarbonization during the sampling period. The remainder of the paper is organized as follows. Section 2 briefly provides the related literature. Section 3 is the empirical methodology. Section 4 is the empirical results and policy implications. Section 5 provides concluding remarks.
Literature Review
How does one evaluate the performance of energy use? The energy intensity index has invariably been used in prior studies to estimate energy efficiency (Herrerias et al., 2016; Rafiq et al., 2016; Timma et al., 2016), but Hu and Wang (2006) and Honma and Hu (2009) argued that this index may result in misleading estimates from partial factor perspective. Accordingly, the energy intensity index was recently replaced by the energy efficiency index, which considers all input factors when assessing energy efficiency, with the application of this new index having been reported in several related works (Ang, 2006; Hu & Wang, 2006; Pasurka, 2006; Wei et al., 2007; Zhang, 2003; Zhang & Choi, 2013). Analysis of the total amount of energy consumption often involves the application of decomposition analysis of the energy efficiency index, along with an indicator of comprehensive energy intensity (Ang, 2004; Choi & Ang, 2012; Lescaroux, 2008) The initial application of energy efficiency estimations using the data envelopment analysis (DEA) approach began with Hu and Wang (2006) who used it to construct the total-factor energy efficiency (TFEE) index within which this index is defined as the ratio of target energy input to actual energy input, with no reduction in outputs. Hence, the TFEE index differs significantly from single-factor energy efficiency indices.
The DEA approach has since been used in numerous empirical studies on energy efficiency. For example, Wei et al. (2007) extended the TFEE index by using a DEA-Malmquist index to measure the changes in energy efficiency within the steel industry in China. Other examples include Hu and Kao (2007), Honma and Hu (2008), Zhou et al. (2008), and Lu et al. (2013). Chang and Hu (2010) proposed the total-factor energy productivity index (TFEPI) to investigate changes in energy productivity within various regions of China, while Shi et al. (2010) and Wang et al. (2012) discussed energy efficiency within China industries under the consideration of the existence of undesirable outputs caused by energy consumption, such as carbon dioxide and sulfur dioxide. Wu et al. (2012) and Zhang and Choi (2013) used an environmental DEA model to measure environmental energy efficiency in various Chinese provinces. Zhao et al. (2014) provided an input-output framework based on a DEA window to explore TFEE in 30 administrative regions and six areas across China. Pang et al. (2015) evaluated the effects of clean energy use by the framework of total-factor efficiency.
Recent studies have mainly focused on investigating the energy efficiency for China or EU countries. Liu et al. (2017) and Yang et al. (2018) examined the TFEE issue in regards to the thermal power industry and China’s agricultural sector. Chen and Yang (2020) provided the measurement and structural factors influencing China’s provincial total-factor energy efficiency (TFEE) under resource and environmental constraints. Chang (2020) conducted empirical analysis of total-factor energy efficiency on 28 member countries in the European Union (EU). Several studies have targeted the issue of energy usage for members of ASEAN. Sandu et al. (2019) analyzed the growth of energy-related CO2 emissions in ASEAN and further identified its trends and drivers. Lu et al. (2020) assessed energy efficiency and public health in ASEAN+3, which Setyawan et al. (2020) discussed factors affecting the changes of energy intensity in Indonesia and five selected members of ASEAN. Setyawan (2020) used a comprehensive decomposition method to investigate the energy intensity performance in Indonesia to other Southeast Asia countries. Lopez et al. (2021) executed decomposition analysis to examine energy use in ASEAN from both production- and consumption-based perspectives. Hu et al. (2021) utilized traditional slack-based measure data envelopment analysis to compute the energy efficiency of ASEAN members and found that the main source of productivity change is due to efficiency score changes by the Malmquist productivity index. Since few studies have focused on investigating dynamic energy efficiency, energy decoupling rate, and decarbonization for ASEAN+6, it would appear to be worthwhile to gain a more comprehensive and complete understanding of this issue.
Although significant effort has been placed into gaining an understanding of energy efficiency, we argue that additional effort is required for three main reasons. First, many of the current measures of energy efficiency take energy savings as the solitary goal, while largely ignoring the demands of economic growth. However, for a developing country, economic performance remains a major concern; hence, the measurement of energy efficiency should include comprehensive consideration of both energy savings and economic growth. Second, too much attention has been paid to the measurement of short-term energy efficiency, with insufficient focus having been placed on long-term observations of energy efficiency. The emphasis in the present study is therefore placed on the importance of long-term measurement of energy efficiency by developing a new index that integrates energy conservation and economic growth based upon a dynamic DEA framework, which few studies have done beforehand. Third, most existing studies have evaluated the energy efficiency of ASEAN under the assumption of traditional DEA, but with completely flexible weights it may cause the biased problem of the DMU’s efficiency value incurring undesirable consequences, such as unreasonably low or high weight values. Existing studies evaluating the energy efficiency of ASEAN members have still not imposed additional constraints on the weights of input and/or output variables by using the weight-restricted DEA model, which can help judge overall efficiency and enhance the discrimination of efficiency ranking. Therefore, this study looks to construct a progressive time-weighted dynamic efficiency model (PTDEM) and then apply this model to the analysis of dynamic total-factor energy efficiency and further energy issues among ASEAN+6.
Empirical Methodology
A non-parametric approach (such as DEA) has invariably been adopted within prior studies on energy efficiency, as opposed to a parametric approach (such as stochastic frontier analysis, SFA). Coelli et al. (2005) provided a detailed comparative discussion on the advantages and disadvantages of DEA and SFA. In the present study we follow the approach of Kao (2013) to use a dynamic model as the measure of dynamic energy efficiency in ASEAN+6 under a DEA framework with consideration of progressive time weighting on the input and output data.
The DEA approach enables us to take multiple inputs and outputs into consideration in our analysis, with particular focus within the model on the consideration of undesirable outputs, such as CO2 emissions. It is important to note that the evaluation of energy efficiency with no consideration within the modeling framework of any of the undesirable outputs may lead to biased energy efficiency values (Mandal, 2010; Zhou & Ang, 2008).
Progressive Time-Weighted Dynamic Efficiency Model (PTDEM)
In order to measure dynamic energy efficiency, we assume that N decision making units (DMUs) are observed over T periods, with each DMU employing a types of common inputs (X), b types of energy inputs (E), and c types of carry-over inputs (L) to produce f types of desirable outputs (Q), and g types of undesirable outputs (U). The carry-over inputs play critical roles in the dynamic DEA model since the model considers consecutive time periods through a linkage between these carry-over inputs.
The dynamic energy efficiency system is illustrated in Figure 1. Here, Qtrh denotes the amount of the rth desirable outputs produced by DMU h at period t, where r = 1, 2,. . ., f; Utsh is the amount of the sth undesirable outputs produced by DMU h at period t, where s = 1, 2,. . ., g; Xtih refers to the amount of the ith common inputs used by DMU h at period t, where t = 1, 2,. . ., T, i = 1, 2,. . ., a, and h = 1, 2,. . ., n,. . ., N; Etjh denotes the amount of the jth energy inputs used by DMU h at period t, where j = 1, 2,. . ., b; and Ltkh defines the amount of the kth carry-over inputs used by DMU h at period t, where k = 1, 2,. . ., c. It should notice that externality may exist when a real variable of specific country depends on the behavior of other countries, and the impact of their behavior on this country is not considered in the decision-making process of other countries (Baumol & Oates, 1988). Fortunately, the production framework in this study currently does not need to consider this issue.

Dynamic energy efficiency system.
How does one evaluate the dynamic energy efficiency scores? In general, DMUs’ behaviors will change over time, and hence there will be a higher weight on the current data and lesser weight on the early data, especially in energy policy-making. Daraio and Simar (2007) proposed the conditional frontier approach to describe that the explanation of productivity differentials is very important for identifying the economic conditions that create inefficiency and to improve managerial performance. They also mentioned that economic conditions are only considered as external-environmental variables, which are neither inputs nor outputs under the control of the producer. However, this study applies the dynamic DEA model of Kao (2013) and follows the energy efficiency estimation model such as Wang et al. (2014). Moreover, this study evaluates progressive time-weighted dynamic energy efficiency by using the progressive time-weighted mean approach in which recent data are highlighted to reflect the new information, and the old data only have a light weight to reflect the out-of-date information (Kumar & Vincent, 2011). Different from Daraio and Simar (2007), the progressive time-weighted dynamic energy efficiency model considers time weights as internal variables, in which inputs and outputs are combined with a time weight as new inputs and outputs to reflect the importance of information for DMUs.
The progressive time-weighted dynamic energy efficiency model is as follows:
min θ′tn

As an example, the energy efficiency score for DMU n can be obtained by calculating the objective function θ′tn for DMU n at period t, where θ′tn ∈ [0, 1]. Here, λth is the weight of DMU h in period t, which is used to connect the inputs and outputs based upon a linear combination of each DMU. Given the amounts of the undesirable outputs, if a lower amount of energy inputs can create a large amount of outputs, then the constraints in equation (1) will result in the associated DMU having a higher energy efficiency score. Undesirable outputs, such as environmental pollution, are treated by using the reciprocal of the undesirable output as a positive environmental variable, u. The difference between equation (1) in this study and the approach of Kao (2013) is that equation (1) is an input-oriented dynamic energy efficiency model, whereas Kao (2013) employed an output-oriented dynamic DEA model.
The results obtained from equation (1) are further used in this study to estimate the energy efficiency change (EEC) from period t to period t + 1, which is expressed as:

If the EEC value is greater than, equal to, or less than 1, then the respective time-revealed energy efficiency scores reveal progress, no change, or regression from period t to period t + 1. The EEC results show that inefficient DMUs are approaching the best frontier when the EEC score is greater than 1 (i.e., the catch-up effect) and regressing from the best frontier when the EEC score is less than 1 (i.e., the fall-behind effect). An EEC score of 1 indicates no change from the previous position.
Group Energy Efficiency and Decoupling Rate for Energy Use
Based on the results obtained from equation (1), the optimal jth energy usage for DMU n at time t is expressed as:

We can further estimate group energy efficiency (GEE) in this study based upon the panel data of the members of ASEAN and the other six countries. The GEE levels of these two groups are estimated using the following equation:

We also make an attempt in this study to investigate the relationship between economic driving forces (desirable outputs) and environmental pressures (undesirable outputs). According to the decoupling factor index created by OECD (2002), the energy decoupling rate (EDR) index is set up as follows:

The maximum value of the decoupling rate is 1, which is the result of energy usage at period t + 1 being equal to 0 (i.e., et+1jn = 0). When the value of the decoupling rate is between 1 and 0, this indicates that energy usage is partially decoupling, while a zero value for the decoupling rate shows total absence of any decoupling in energy usage. Given that decoupling energy usage from economic growth (i.e., achieving low energy intensity) is one of the resource strategies adopted by the EU, and that targeting low energy intensity is also common around the world (Mudgal et al., 2010), we can construct the target energy decoupling rate (TEDR) by combining equations (3) and (5), as follows:

The estimation equation for the achievement standard ratio of the energy decoupling rate (ASREDR) index is finally expressed as follows:

where the value of ASREDR is between 0 and 1, and ε is a very small number so as to avoid a meaningless value for ASREDR.
The Estimation Index of Decarbonization and Carbonization
In addition to gaining an understanding of energy usage efficiency, we also need to determine whether there is any link between energy usage and CO2 emissions. The term decarbonization refers to the decoupling of CO2 emissions from energy usage while the term carbonization indicates that CO2 emissions still strongly correlate with energy usage. Mielnik and Goldemberg (1999) used the estimation index to test for both decarbonization and carbonization. The estimation equation for the decarbonization and carbonization index can be expressed as follows:

where Δ(CO2/E) is the change in the carbonization index. Here, η < 0 (η > 0) indicates the occurrence of decarbonization (carbonization) in the economy as it switches away from (toward) high carbon; where η = 0. This indicates that there are no occurrences of either decarbonization or carbonization within the economy, such that it remains constant over time.
Empirical Results
Our analysis begins with an examination of the 2000 to 2013 dataset on ASEAN+6 to investigate the dynamic energy efficiency and the energy efficiency change under PTDEM. We then go on to discuss the energy decoupling rate, the achievement standard ratio of the energy decoupling rate, and decarbonization for ASEAN+6.
Data Description
The dataset on ASEAN+6 provides the total amount of real GDP (a desirable output) and the total amount of CO2 emissions (an undesirable output) of each country. The three inputs are real capital formation, the amount of labor, and the amount of energy usage, where real capital formation is regarded in this study as a carry-over factor since it exhibits a time continuity characteristic. This combination of input and output variables relating to the environment and energy is in common usage within many prior studies (Choi et al., 2012; Guo et al., 2011; Wu et al., 2012).
The source of the data used in this study is the website of the World Development Indicators (WDI) produced by the World Bank, with the sampling period running from 2000 to 2013. The descriptive statistics on the data covering the 14 countries of ASEAN+6 are presented in Table 1. Since the data cover a time span of 14 years, all variables in monetary units have been transformed into real variables in terms of US$ dollar millions in the year 2010. Although some of the data on Myanmar and Lao PDR are unavailable, the 14 countries provide a complete panel dataset of input and output variables during the period from 2000 to 2013.
Descriptive Statistics of All Variables for ASEAN+6.

Represents that the variable is collected from World Develop Indicators, World Bank.
Represents that the variable is collected from World Governance Indicators, World Bank.
Represents that the variable is collected from Penn World Table.
The correlation matrix of the input and output variables is presented in Table 2 where positive correlations are found to exist between the inputs and outputs, thereby satisfying the property of isotonicity, such that an output does not decrease with an increase in an input. The respective correlation coefficients between energy usage and the two outputs (GDP and CO2) are 0.7626 and 0.9938. The other two inputs are found to have a significantly positive correlation with the two outputs—the CO2 emissions in particular. These results confirm the existence of isotonicity between the inputs and outputs in the linear programing model. Moreover, based on the results of the significance test from Table 2, this input-output framework is meaningful when analyzing the dynamic energy efficiency of ASEAN+6. It shows that using more resources such as energy, labor, and capital will increase desirable and undesirable outcomes such as GDP and CO2.
Correlation Matrix of Inputs and Outputs.

Note. The measures of the variables on the x and y axes are as follows. 1: Real GDP (US$ bn); 2: CO2 (1,000 Kt); 3: Energy Usage (1,000 Kt of oil equivalent); 4: Labor (×1,000 persons); 5: Real Capital Formation (US$ bn).
Indicates significance at the 1% level.
Results of Energy Efficiency and Energy Efficiency Change
We determine the trends in group energy efficiency for ASEAN and the other six countries not in ASEAN, and although an energy efficiency gap is found to exist between the two groups, the energy efficiency trends of both groups are found to be similar, with the one exception of 2011 to 2012. Hu et al. (2021) also indicated that the patterns of energy efficiency in members of ASEAN and other countries not in ASEAN are similar. As illustrated in Figure 2, the energy efficiency of ASEAN members has consistently exhibited greater improvement than that of the other six countries, which is a finding similar to that of Chang (2015) who noted that for countries experiencing rapid economic growth, the potential for improvements in energy intensity is always going to be greater than that in the more developed countries.

Group energy efficiency trend in ASEAN and the other six countries.
An important question arising from our analysis relates to which of these countries have greater energy efficiency. Hence, Table 3 reports the energy efficiency scores between 2000 and 2013 for the 14 ASEAN+6. Although Australia and Japan are found to have achieved the best energy efficiency scores among all ASEAN+6 during our sampling periods, the non-members of ASEAN are typically found to have better energy efficiency scores than those of ASEAN.
Energy Efficiency in PTW-DEEM for ASEAN+6.
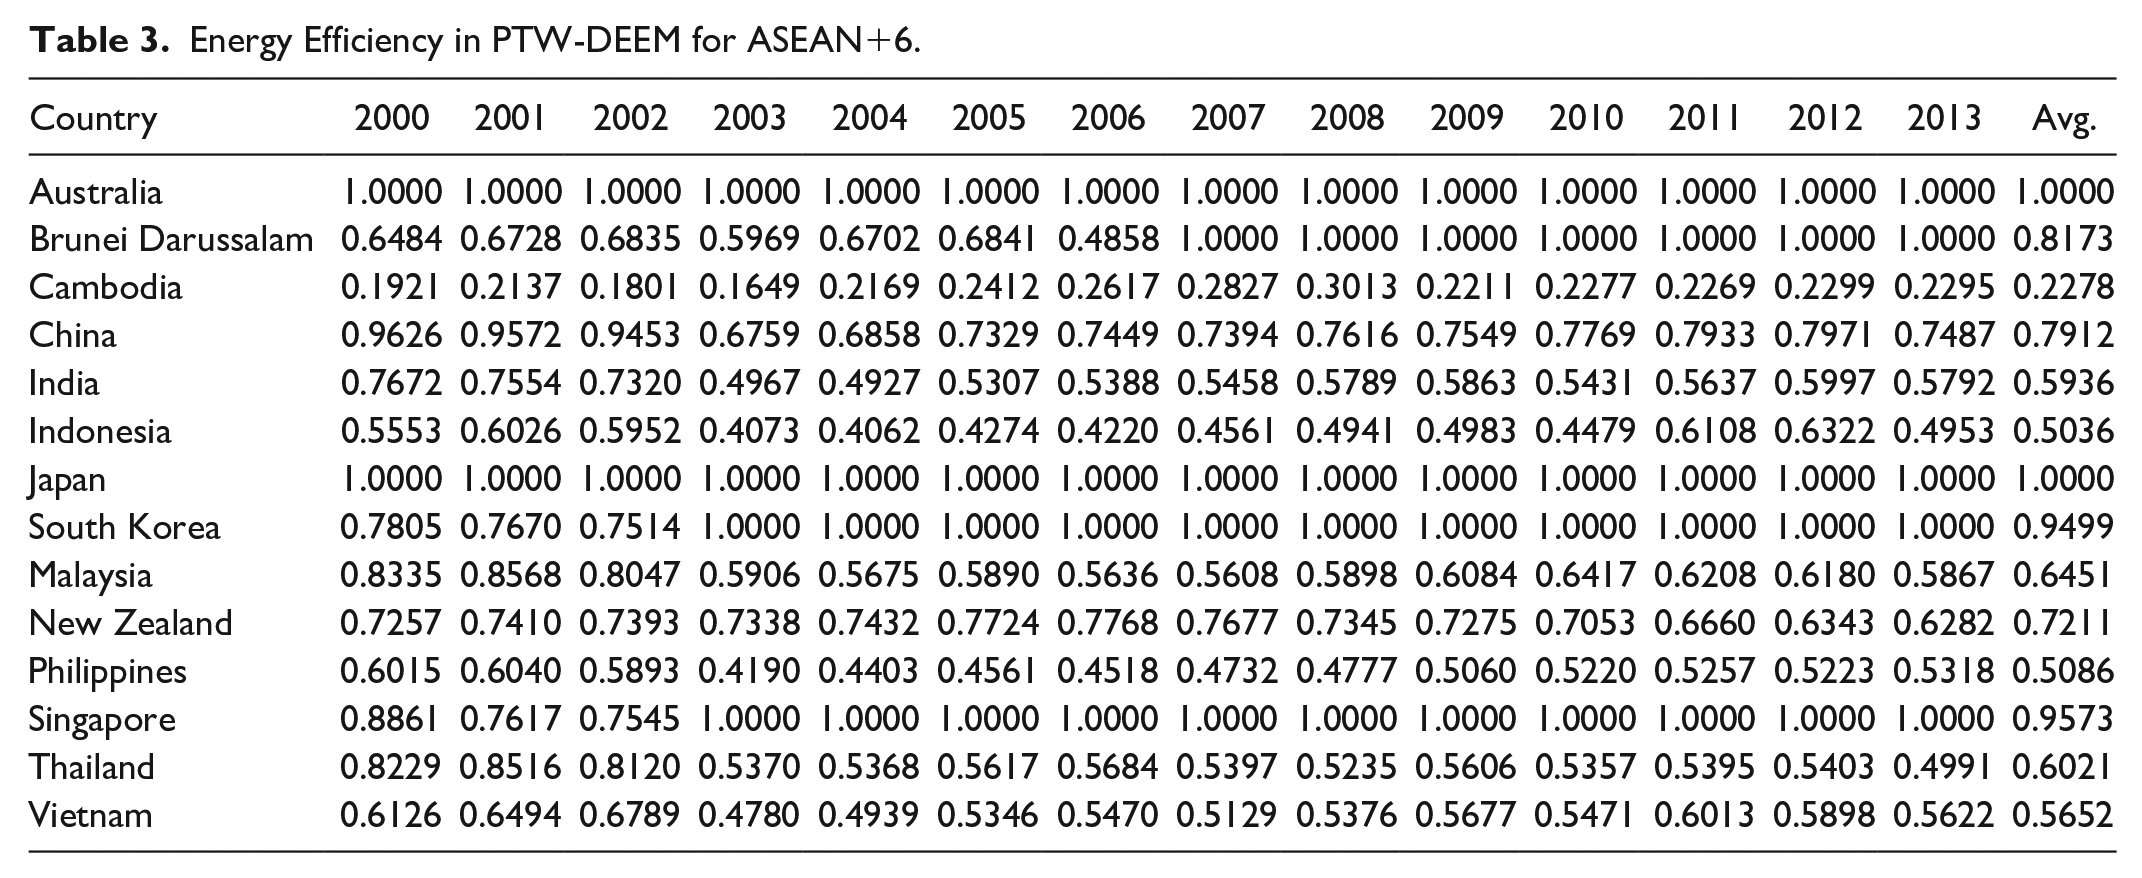
Almost all of the countries under examination here are found to have higher energy efficiency scores from the start of our sample period, with continual improvements in energy efficiency over time. These findings confirm that energy usage performance within ASEAN+6 is an issue worthy of greater attention. The application of progressive time weighting into the dynamic efficiency system could also help to identify any changes in behavior within the DMUs with regard to energy usage, particularly over recent years, at a time when the issue of energy usage has been gaining greater attention.
In regards to energy usage performance within members of ASEAN, Singapore is found to have superior energy efficiency scores versus all other members. Singapore launched a voluntary energy labeling program in 2002 and followed this with mandatory energy labeling as a means of improving energy efficiency. The 2007 Energy for Growth-National Energy Policy Report subsequently pointed out that improving energy efficiency is one of five most important strategies for energy growth. Singapore also set up an Energy Efficiency Program Office (E2PO) and developed a national energy efficiency program (Energy Efficient Singapore, E2Singapore) aimed at helping to achieve its energy policy goals.
Throughout the sampling periods of this study, Cambodia by contrast is consistently found to have lower energy efficiency scores. The country’s lowest energy efficiency score, which occurred in 2003, was 0.1649—a result which would appear to be associated with the Kingdom of Cambodia Investment Law Amendment, since the importance of energy usage performance is often overlooked when trying to attract increased investment in the pursuit of economic growth.
This study also identifies the group energy efficiency changes for ASEAN members and the other six non-members of ASEAN. Although the energy efficiency scores for members of ASEAN are consistently found to fall behind those of the other six countries, Figure 3 shows that, with the one exception of the 2009 to 2012 period, the trends in energy efficiency changes for the two groups are quite similar. The energy efficiency regression after 2001 may be attributable to the effects of the international market, particularly for ASEAN, including the recession in the U.S., the deepening recession in Japan, and the slowdown win the EU economy.

Group energy efficiency change trend in ASEAN and the other six countries.
Although the two groups show less progress in energy efficiency after 2005 (when the Kyoto Protocol came into force), the 2008 financial crisis led to ASEAN exhibiting regressions in energy efficiency, which were much deeper than those of the other six non-members of ASEAN. Interestingly, Figure 3 shows that ASEAN members exhibit greater progress in energy efficiency during the 2010 to 2011 period, a period which saw the comprehensive establishment of the China-ASEAN Free Trade Area (CAFTA).
The individual energy efficiency changes within ASEAN+6 are presented in Table 4, which shows that Australia and Japan have consistently exhibited no change in their energy efficiency throughout the sampling periods. Among ASEAN, Brunei Darussalam, Cambodia, Indonesia, and Singapore all reveal a catch-up effect, which implies that the energy efficiency levels within these countries are approaching the best frontier. Although the energy efficiency levels in the Philippines and Vietnam are generally shown to be regressing, both countries exhibit a catch-up effect in at least half of the sample periods. These outcomes reveal that ASEAN members continue to strive to achieve improvements in their energy efficiency performance.
Energy Efficiency Change for ASEAN+6.
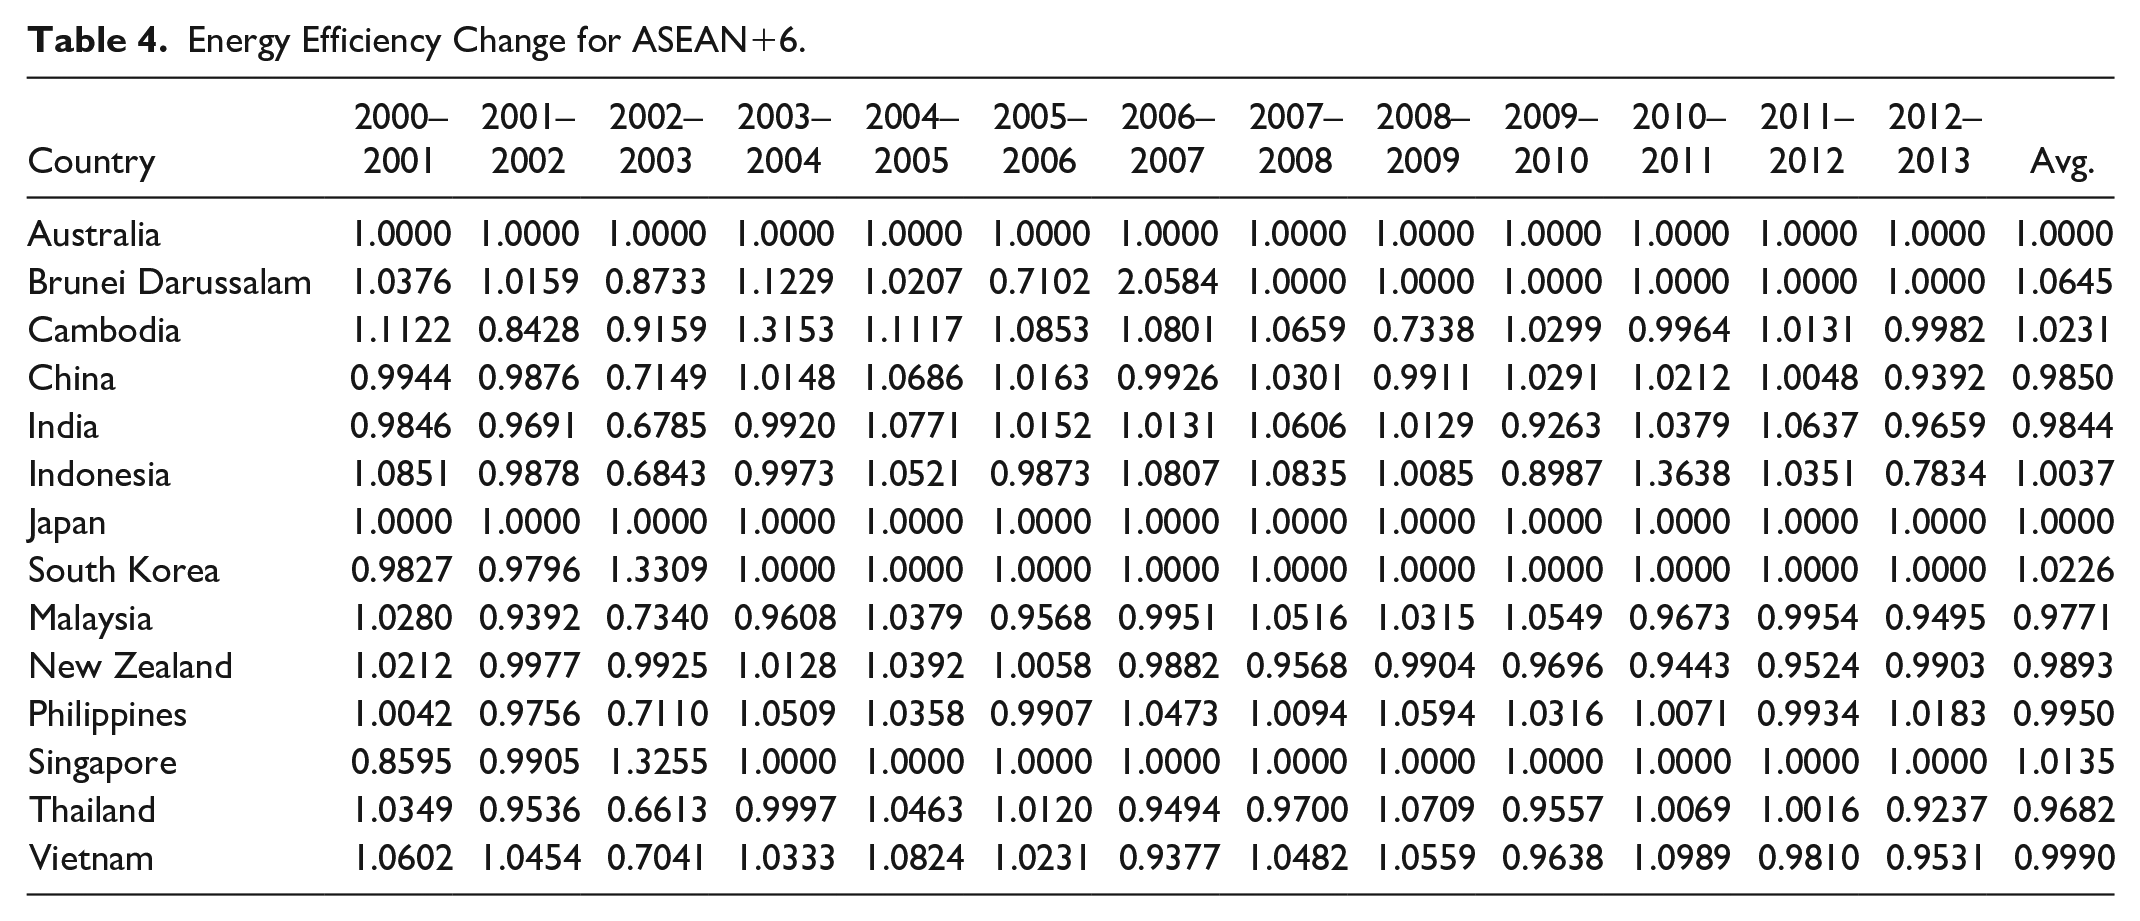
Environmental protection regulations may have also played an important role in the overall improvements in energy efficiency. Although the 1997 Kyoto Protocol focused on the issue of climate change mitigation through a reduction in greenhouse gas (GHG) emissions, the protocol did not actually come into force until 2005. Nevertheless, as we can see from Table 4, during the 2004 to 2005 period most of ASEAN, with the one exception of Singapore, exhibited progress in their energy efficiency performance, which implies that the protocol already had indirect influences on energy efficiency improvements.
Another important issue is the energy efficiency action plan proposed by the ASEAN Center for Energy (ACE), which included a national energy efficiency action plan for each member of ASEAN. The results of this plan were released in 2011. These results, reported in Table 4, reveal that while the Philippines, Indonesia, Thailand, and Vietnam exhibited energy efficiency improvements during the 2010 to 2011 period, this plan appears to have had very limited effects on energy efficiency improvements after 2011. However, energy efficiency in most of the countries examined is found to have improved during the 2007 to 2008 period, although the 2008 financial crisis resulted in energy efficiency regressing in three of the countries during the 2008 to 2009 period, particularly Cambodia. The energy efficiency improvements achieved in Indonesia, Malaysia, the Philippines, Thailand, and Vietnam are generally found to exhibit a gradual reduction after the 2008 to 2009 period. The results clearly indicate that the economic climate has strong influences on energy efficiency and energy efficiency changes, as higher (lower) economic growth development creates more (less) GDP that helps improve (weaken) energy efficiency under a low demand elasticity of energy.
Results of the Energy Decoupling Rate
The energy decoupling rate, the target energy decoupling rate, and the achievement standard ratio of the energy decoupling rate for the 14 members of ASEAN+6 are respectively estimated using equations (4)–(6). In general, the lower the energy decoupling rate is, the greater is the energy usage, year on year. Our empirical results reveal that the energy decoupling rates are lower in most members of ASEAN, as compared to the other six countries not in ASEAN. Furthermore, as illustrated in Figure 4, the target energy decoupling rates in ASEAN members are also found to be higher than those of the other six countries not in ASEAN.

Group target energy decoupling rate trend in ASEAN and the other six countries.
The finding of a significant gap between the energy decoupling rate and the target energy decoupling rate is more obvious in ASEAN members than in the other six countries, which results in the achievement standard ratios of the energy decoupling rate for ASEAN members being lower than those of the other six countries. Thus, these empirical findings indicate that ASEAN needs to place greater focus on improvements in energy usage throughout any continuing economic growth. The individual results on the energy decoupling rate, the target energy decoupling rate, and the achievement standard ratio of the energy decoupling rate for the 14 countries of ASEAN+6 are reported in Table 5, which shows that Brunei Darussalam and Singapore have slightly higher energy decoupling rates than those of the other countries in ASEAN.
Energy Decoupling and Target Energy Decoupling Rates, and Energy Decoupling Rate Achievement Standard Ratio for ASEAN+6. Unit: %.

The energy decoupling rates of Indonesia, Malaysia, Thailand, and Vietnam are consistently found to have remained at 0% throughout the sample periods. Furthermore, the target energy decoupling rates of these four countries are found to be much higher than those of the other ASEAN members, thus indicating that the achievement standard ratios of the energy decoupling rate for these four countries are consistently 0%.
A similar result is found for China and India whose energy decoupling rates are again 0% throughout the sampling periods. However, their target energy decoupling rates are much higher than the other six non-ASEAN countries, once again indicating that the achievement standard ratios of the energy decoupling rate for these two countries consistently remain at 0%.
These results are consistent with the findings of Tu et al. (2016) who found that Brazil, Russia, India, China, and South Africa had lower achievement standard ratios of the energy decoupling rate. It therefore seems clear that even non-members of ASEAN, particularly those experiencing relatively rapid economic growth, need to pay more attention to improving their energy usage. It should be noted that the achievement standard ratios of the energy decoupling rate in Australia and Japan are consistently found to be 100% throughout the sample periods.
It is also worth noting that Japan had the highest energy decoupling rate in 2011 at 7%, along with a 100% achievement standard ratio of the energy decoupling rate, which raises the question of how this might have occurred. The most obvious cause was the major damage suffered by the Fukushima Nuclear Power Plant, which occurred on March 11, 2011 as a result of the magnitude 9.0 earthquake, and the resultant devastating tsunami. Following the Fukushima disaster, both solar energy and wind energy began providing major power sources in Japan to supplement the electricity shortage as a result of the nuclear plants halting operation for 13 months due to regulatory requirements and protective maintenance. Such active development of renewable energy usage clearly reduced dependence on conventional energy.
Results of Decarbonization/Carbonization
The estimation results of decarbonization or carbonization for ASEAN and the other six countries are illustrated in Figure 5. For most of the sample periods, ASEAN+6 exhibited a carbonization situation, as the whole group still had not reached a higher income level, relative to other developed countries in the world. This phenomenon is close to the assumption of the Environmental Kuznets Curve (EKC) that environmental quality deteriorates when a country is at the early stages of economic growth under critical income levels. We also see from Figure 5 that the index of the members of ASEAN reveals greater fluctuations than the index of the other six non-members, showing that when economic growth in a country is more stable, the authorities are more likely to switch the economy away from high carbon energy usage.

Carbonization/decarbonization in ASEAN and the other six countries.
When considering the Kyoto Protocol, which came into force in 2005, as well as the 2008 financial crisis, which had enormous financial impacts throughout the world, it is hardly surprising that ASEAN generally had higher scores than the other six non-members of ASEAN, since these six countries faced a much heavier burden than ASEAN in terms of implementing the CO2 emission reduction requirements under the Kyoto Protocol framework. The 2008 financial crisis gave rise to a severely depressed economy, albeit with the unexpected benefit of lower CO2 emissions and lower energy usage, thereby promoting a decline in carbonization in ASEAN+6. However, on the whole, there is no evidence of convergence to decarbonization within ASEAN+6.
Based on what is mentioned above in equation (8), this study not only evaluates the average level of decarbonization or carbonization for two groups, but also investigates the results of decarbonization or carbonization for each member. With regard to the difference of each country, Figures 6 and 7 illustrate the results of decarbonization or carbonization for the two groups. Most members of ASEAN still remain in the status of carbonization, but each country has a different level of it. Countries with similar trends to the average of ASEAN include Indonesia, Malaysia, Thailand, and Vietnam. Countries with large fluctuations in the trend include Brunei Darussalam, Cambodia, and Singapore. More specifically, with the rapid economic development of Indonesia, Malaysia, Vietnam, and Thailand, we find that these four countries will play a major role for controlling the decoupling of CO2 emissions from energy usage among ASEAN. On the other hand, if the target is to effectively reach the decoupling of CO2 emissions from energy usage for ASEAN, then the performance of the other three countries will need to be paid more attention, especially for Singapore.

Carbonization/decarbonization in each member of ASEAN.

Carbonization/decarbonization in the other six countries.
Most of the other six countries have the status of carbonization, but each country has a different level of it, as seen in Figure 7. We first find that Australia and New Zealand relative to other countries represent the decoupling of CO2 emissions from energy use. China, India, Japan, and South Korea represent similar trends to the average of these six countries. In particular, China and India show obvious evidence for the status of carbonization in most of the sampling periods. Japan has a large fluctuation in the trend after 2008, representing that CO2 emissions and energy use cannot be decoupled. In 2003, the higher status of carbonization mainly appears for China and South Korea, but the trend of decoupling is more convergent.
The Determinants of Dynamic Energy Inefficiency for ASEAN+6
To investigate the determinants of dynamic energy inefficiency, we use the panel Tobit regression since the inefficiency value of each country from equation (1) is both left and right censored with the range [0, 1]. We propose the panel Tobit regression in this study as follows:

where inDEE denotes the dynamic energy inefficiency score of country i in year t;
As for
Table 6 presents empirical results of the panel Tobit regressions for all countries, ASEAN, and the other six countries. The estimated coefficients of the natural logarithm of GDP per capita and its squared term are significantly positive and negative for all sampling countries and the other six countries. However, the estimated coefficients of these two variables for ASEAN member are expected, but insignificant. These results confirm the EKC relationship among ASEAN+6, but it is less obvious for ASEAN than for other the six countries.
Panel Tobit Regression Results of Dynamic Energy Inefficiency for ASEAN+6.

Note. The panel-level and overall components of the error term are labeled
**, and * respectively represent p < .01, p < .05, and p < .1.
The estimated coefficients of the industry ratio have significantly negative impacts among ASEAN+6. In addition, the estimated coefficients of the fossil fuel ratio of electricity production are significantly positive and negative for members of ASEAN and the other six countries, respectively. Indeed, initial industrialization for members of ASEAN will cause energy inefficiency and pollution emissions, but mature industrialization such as the other six countries will improve the inefficiency of energy use while the level of energy usage technology progresses.
The estimated coefficient of regulation quality is significantly negative for ASEAN members, implying that regulation quality plays a critical role in reducing energy inefficiency than the other six countries. The estimated coefficient of education is significantly negative for the other six countries, showing that higher human capital leads to an improvement in energy efficiency. ASEAN members still need to continue their efforts to improve the level of human capital.
Policy Implications for ASEAN+6
Based on the above empirical results, we provide the following policy implications for ASEAN+6. First, energy efficiency improvements can be regarded as short-term goals for all of them in order to reduce their overall energy consumption levels, while CO2 emission reductions and climate change mitigation should be seen as long-term goals. Second, since the traditional industry structure of ASEAN may encourage higher energy consumption and CO2 emissions, increased investment in energy and environmental technology aimed at upgrading and adapting energy-saving technology should be seen as appropriate and important for optimizing the industry structure.
Third, from the Clean Development Mechanism (CDM), which is defined in Article 10 of the Kyoto Protocol, Tu et al. (2016) indicated that the environmental and energy technologies of developed countries should be made readily transferrable to developing countries. Therefore, we suggest that ASEAN+6 should adopt advanced technology/equipment from developed countries in order to reduce their production costs, which will indirectly increase their wealth and lead to further improvements in environmental quality.
Fourth, ever since the Paris Agreement took effect in 2016, member countries have not compulsorily set emission reduction targets for individual countries. However, in order to achieve the agreement’s emission reduction level, the short-term strategy of members of ASEAN should pay attention to avoid the reduction of forest area caused by over-development. Hu et al. (2021) also mentioned that decreases in the fossil fuel ratio of net electricity generation enhance energy efficiency for ASEAN. In the medium term and long term, we suggest that the governments of ASEAN+6 should not only improve energy efficiency by attracting foreign-funded energy service companies (ESCOs) through policy subsidies or investment promotion, but also cooperate with academic institutions to jointly develop renewable energy resources to reduce the level of fossil fuel energy use.
Concluding Remarks
Energy usage performance plays an important role in economic growth and environmental sustainability. While members of ASEAN have enjoyed good economic performance over the past two decades, despite having lower levels of energy consumption and energy consumption per capita than the average for developed countries, expected population increases based upon urbanization and industrialization within this region will no doubt lead to significant increases in energy demand.
Members of ASEAN obviously closely relate to neighboring developed countries in Asia, such as China, Japan, South Korea, India, Australia, and New Zealand, in terms of both economic growth and environmental protection. Indeed, from the experiences of these countries, it has become widely recognized that improving energy efficiency is an important path for reducing production costs and fossil energy usage if a country is to strengthen its competitiveness and development. This is particularly so for ASEAN+6.
Although energy intensity is a simple, traditional method, such focus may result in misleading estimations and incomplete evaluation of energy usage performance. Related studies have invariably adopted the TFEE index (Hu & Wang, 2006) to evaluate energy usage performance, whereas in this study we estimate energy efficiency among ASEAN+6 using a progressive time-weighted dynamic efficiency model (PTDEM) and discuss issues concerning the energy decoupling rate and decarbonization over the 2000 to 2013 period. In contrast to the traditional DEA approaches, we take a long-term perspective and impose additional constraints on the input/output variable weightings in order to emphasize the inter-temporal activities of decision making units (DMUs) over two consecutive time periods.
Our empirical results show that, first, since energy efficiency improvements in members of ASEAN are consistently greater than in the other six countries, the rapidly developing countries clearly have more room for improvement in their energy usage performance than their well-developed counterparts. However, the results of the energy efficiency changes also show that ASEAN members are continually striving to achieve further energy efficiency improvements.
Second, the energy decoupling rates in most members of ASEAN are found to be lower than in the other six non-member countries, while the target energy decoupling rates of ASEAN are also found to be higher than in the other six non-members. Clearly, in terms of achieving the standard ratio of the energy decoupling rate, the members of ASEAN have more room for improvement than the other six countries.
Third, there is no evidence of convergence to decarbonization within ASEAN+6 since the countries are found to be in a carbonization situation over most of our sample periods. The index of members of ASEAN also exhibits larger fluctuations than the index of the other six non-member countries, clearly indicating that countries with more stable economic growth will invariably try to switch their economy away from high carbon energy usage.
We conclude by offering some recommendations for future research. First, there are different socio-economic levels within ASEAN such as Singapore and Cambodia. If the number of members of ASEAN is enough, then it is worth it to distinguish sub-groups with different socio-economic levels to evaluate the dynamic energy efficiency within ASEAN. In addition, it is an interesting issue to evaluate the energy performance among members of ASEAN by taking cross-sectional dependence and spillover into account.
Second, our study has focused on evaluating dynamic energy efficiency for ASEAN+6. Comparing them to other economies such as the European Union, African Union, Union of South American Nations, or other economic organizations may be an interesting topic by using the metafrontier DEA approach for recognizing the energy-use performance of ASEAN+6 in the world.
Third, the energy efficiency of individual sectors is also undoubtedly worth examining. A cross-national comparison of energy efficiency in the individual sectors of the countries making up ASEAN+6 may also shed some light on their determinants, which may assist policymakers in their design of appropriate energy policies.
Lastly, future research can look into energy efficiency within individual sectors of a country. This can be done by taking into account the congestion effect, which could also provide more insightful implications for a national energy policy.
Footnotes
Declaration of Conflicting Interests
The author(s) declared no potential conflicts of interest with respect to the research, authorship, and/or publication of this article.
Funding
The author(s) received no financial support for the research, authorship, and/or publication of this article.