
Abstract
This study analyses the impact of working in the public sector on job satisfaction in Europe (19) through the European Working Condition Survey (EWCS). A grouping of countries is proposed based on the perception of workers regarding the functioning of the labor market. Econometric estimates show that public sector workers, at an aggregate level, are more satisfied than those in the private sector. The highest job satisfaction corresponds to permanent contract public sector workers, followed by temporary contract public sector employees, the permanent contract private sector, and the temporary contract private sector workers. The results confirm that in those countries with a higher proportion of individuals who consider losing their job a probability, public sector job satisfaction is higher. In addition, those countries where the proportion of individuals with low confidence in finding a new job with similar characteristics to the one they have, public sector job satisfaction is also higher.
Introduction
In recent decades, economic literature has emphasized the impact of job satisfaction on both individual and organizational performance, and well-being. For this reason, numerous investigations have studied both differences and determinants in job satisfaction in different sectors and groups of workers. One of the topics of greatest interest has been job satisfaction disparity between public and private sector workers. Most studies agree that timetable, holidays, flexibility, remuneration and promotion policies, and the activities (content and nature) carried out by workers (all of them job satisfaction determinants) differ considerably between public and private sector organizations (Fottler, 1981; Johnson et al., 2017; Kjeldsen & Hansen, 2018; Meyer, 1982; Paine et al., 1966; Perry & Hondeghem, 2008; Perry & Porter, 1982; Perry & Rainey, 1988; Porter & Mitchell, 1967; Rainey et al., 1976; Rhinehart et al., 1969; Solomon, 1986; Stimson & Johnson, 1977; Taylor & Westover, 2011; Whorton & Worthley, 1981). However, there is no agreement on whether these differences lead to greater job satisfaction for private, or public, employees (Baarspul & Wilderom, 2011).
Perceptions of working conditions are also determined by a country’s sociologica, economic and political framework (Li, 2017), so comparisons of job satisfaction levels between public and private sector workers are expected to be different among regions. In this sense, the economic conditions and the functioning of the labor market in each country are expected to influence individual job satisfaction and well-being (Giorgi et al., 2015), as well as their job perception. It is precisely this issue we aim to focus our attention on. We will examine how worker perception of the labor market alters job satisfaction.
In recent decades, and especially since the 2008 financial crisis, important changes in working relationships have been observed (Matilla-Santander et al., 2019). The probability of unemployment has increased together with the difficulty of finding a new job (Bell & Blanchflower, 2019). These two factors could provoke a sense of work-related instability among workers and condition their job satisfaction.
This issue acquires special relevance among public sector workers as it is, in theory, a less volatile sector. As such, adverse labor market conditions could affect public sector worker job satisfaction positively, rather than negatively. We hypothesize that public sector workers will display greater job satisfaction in work environments with more adverse labor market perception. The study does not focus, therefore, on how job characteristics affect job satisfaction, but on how it is altered by perception of the labor market as a whole. To date, literature studying job satisfaction determinants has focused more on job characteristics and less on global perception of the labor market.
Other public sector groupings could be made in Europe based on the organizational, operational, and legal structure that would enrich analysis and justify differences in public sector employee job satisfaction, although it was not the object of our analysis (see Thijs et al. (2017) for an overview of public administration characteristics and performance in Europe or the overview report corresponding to the European Working Condition Survey [EWCS]).
Our study aims specifically to fill this void by using the 2015 EWCS for European Monetary Union countries (Eurofond, 2015). The objectives are as follows: (a) verifying whether job satisfaction of public sector employees is indeed superior to that of private sector workers; (b) examine whether the proportion of temporary job contracts to permanent contracts justifies public and private sector differences in job satisfaction; (c) studying whether significant differences between countries regarding public sector job satisfaction exist; and (d) showing any possible relation between countries based on individual labor market perception (probabilities of losing a job and finding another with similar characteristics) which would justify the differences in public sector employee job satisfaction.
The work is structured in the following way. In the second section, we present a brief review of the literature regarding job satisfaction in the public or private sectors. We also highlight those works that focus their attention on the impact of job insecurity on job satisfaction. The data, the estimated theoretical model, and the econometric procedure are described in the third section. Descriptive and econometric results are presented in the fourth section. Estimates are first focused on employees in the public and the private sectors in aggregate, and then the temporary or permanent nature of contracts is examined for both sectors. This procedure allows us to identify where differences reported by public and private sector employees are exclusively attributable to contract stability or by other factors. Likewise, a grouping of countries based on labor market perception (the probability of losing a job and probability of reemployment) is formulated. Once these groups have been created, the impact of public sector employment on total job satisfaction is studied separately. It is therefore possible to verify whether job satisfaction in the public sector is superior in more adverse labor markets. Finally, some policy recommendations and brief conclusions are presented.
Literature
The study of job satisfaction has generated great interest in recent decades. The reason is none other than the importance of this variable as a determinant of worker performance (Appelbaum & Kamal, 2001; Hackman & Oldham, 1975; Iaffaldano & Muchinsky, 1985; Judge et al., 2001; Lee, 2017; Tietjen & Myers, 1998), absenteeism (Hausknecht et al., 2008; Lee, 1998), turnover (Hom & Griffeth, 1995), and the performance of the organization as a whole (Garrido et al., 2005; Harter et al., 2002; Ostroff, 1992; Ryan et al., 1996). Both utilitarian and humanitarian concerns justify the study of job satisfaction, given its impact on physical and psychological well-being (Ellickson & Logsdon, 2001). That is why, numerous works have tried to identify the determinants and differences in worker job satisfaction by gender, educational level, or sector, as key factors in organizational human resources policy.
Many studies have been developed to identify differences in job satisfaction in varied types of organizations, specifically considering differences in job satisfaction among public and private sector workers. There exists a debate regarding the nature of differences between both sectors; however, there is general consensus that differences do exist (Fottler, 1981; Johnson et al., 2017; Meyer, 1982; Perry & Porter, 1982; Perry & Rainey, 1988; Rainey et al., 1976; Whorton & Worthley, 1981).
Public sector work may offer greater possibilities to satisfy altruistic or personal needs and lead to greater workforce motivation and job satisfaction (Perry & Hondeghem, 2008). However, the structure of public organizations, often strongly bureaucratic and, in some cases, conflictive, could undermine the possibility to reach goals (Steijn & Voet, 2017). At the same time, public sector organizations often lack specific organizational goals, which may have a negative influence on job satisfaction (Kjeldsen & Hansen, 2018).
Public sector employees typically work in a highly politicized environment faced to relatively rigid accountability mechanisms, and intense media scrutiny, compared with those of the private sector (Taylor & Westover, 2011). These factors could reduce the range of activities carried out by workers, the flexibility to perform them, and remuneration. As a result, workers would experience more tedium and lower job satisfaction as the range of tasks, work challenges, and skills they applied at work are smaller (Stimson & Johnson, 1977).
In addition, fulfillment of self-esteem, autonomy, and self-actualization of public sector employees could be smaller than those of their private sector counterparts (Paine et al., 1966; Porter & Mitchell, 1967; Rhinehart et al., 1969; Solomon, 1986). Finally, public sector wages are usually less responsive to changes in worker productivity than those of the private sector (Blackaby et al., 2017; Murphy et al., 2020) which could lead to lower job satisfaction (Fernández & Sánchez-Sánchez, 2020).
Although the differences between the public and the private sector are evident, there is no agreement on how public employee job satisfaction compares with that of private sector employees (Baarspul & Wilderom, 2011). At an aggregate level, Steel and Warner (1990), Maidani (1991), DeSantis and Durst (1996), and Sánchez-Sánchez and Fernández (2020) show public sector employees to be generally more satisfied than those in the private sector. Lewis (1991), Emmert and Taher (1992), and Gabris and Simo (1995) consider that differences are nonexistent. Finally, Buchanan (1974) and Bogg and Cooper (1995), among others, conclude that private sector employees are more satisfied than public sector workers (these last two studies are focused exclusively on managers).
Employment precarity could also cause a change in employee job perception. From this perspective, many individuals, including those with higher qualifications and employment opportunities in the private sector, would prefer jobs in the public sector, giving up higher remuneration in exchange for greater job stability or security in unfavorable economic contexts (Ortiz, 2010; Sánchez-Sánchez & Fernández, 2014). It must be pointed out that the nature of public sector activity frequently reduces job instability, even though there are temporary workers in this sector.
Economic literature identifies job insecurity, generally measured through unemployment, as a key determinant of individual well-being and job satisfaction (Carsten et al., 1987; Chirumbolo & Hellgren, 2003; Clark & Oswald, 1994; Dawson et al., 2017; Grün et al., 2010; Klug, 2017; Luechinger et al., 2008; Pirani & Salvini, 2015; Robone et al., 2011; Schumann & Kuchinke, 2019; Van Aerden et al., 2016; Winkelmann & Winkelmann, 1997; Witte & Näswall, 2003; Zeytinoglu et al., 2013). This factor, as pointed out by Borra and Gómez-García (2016), would have an important effect on workers’ subjective sense of well-being during an economic crisis as expectations of finding another job are lower (Knabe & Rätzel, 2010).
Job turnover, linked to a higher probability of unemployment (regardless of whether another position will be found relatively quickly) would mean job insecurity leads to lower satisfaction (Booth et al., 2002; Dawson et al.; 2017). In addition, low-wage employment, with worse working conditions (Booth et al., 2002), monotonous tasks, and reduced autonomy (Letourneux, 1998), is more common in environments with very high labor turnover.
Sources and Theoretical Model
Our study is based on the sixth EWCS of 2015. This survey has been performed every 5 years since 1990 by the European Foundation for the Improvement of Living and Working Conditions. This sixth cross-sectional survey interviewed nearly 44,000 workers in 35 countries. Its findings provide detailed information on a broad range of issues, including exposure to physical and psychosocial risks, work organization, work–life balance, and health and well-being.
In our study, we have considered, for the sake of homogeneity, the 19 countries of the European Monetary Union. The total number of observations in the survey is 31,570. We have removed unemployed and inactive individuals and those who did not answer the question related to our dependent variable. Therefore, the number of observations is 20,531.
The survey includes workers’ self-reported perceptions, in addition to other information on relevant worker and job characteristics. The survey, however, is not a panel, and therefore, we are unable to reflect the factors that affect the transitions in satisfaction levels or to control for fixed individual effects.
The EWCS includes several questions related to worker job satisfaction. We have chosen the following: “How often do you feel this way—I am enthusiastic about my job?” The five possible response categories, based entirely on their individual perception, range from “always” (Value 1) to “never” (Value 5). The reported values may be used as a cardinal measure of satisfaction, as respondents considered the response numbers (1–5) as cardinal measures of their satisfaction.
Our study begins with simple “averages” of the responses. This index offers a measure of satisfaction that is comparable by year or group if linearity across response categories is assumed.
We have adopted the terms used by Clark and Oswald (1996) to define the theoretical model. The individual work utility function for each worker is expressed as:

where x includes variables related to the worker’s individual characteristics and j includes those related to job characteristics. As individual characteristics, we have included the following in this work: gender, age range, and educational level, as well as variables related to the family (having a partner and children, and household income). The ability to balance life and work, and the individuals’ reported health status are also included. Some of these variables, as noted by Mottaz (1984, 1987), Glisson and Durick (1988), Ting (1997), Reiner and Zhao (1999), Ellickson (2002), and Steijn (2004), appear to be insufficient to justify the variations in total job satisfaction, that is why we have included other variables related to job characteristics, mainly intrinsic factors (see Herzberg’s (1966) two-factor theory): working in the public or private sector, wages, and work hours. These last variables could capture two of the main differences between the public and the private sector. We have also considered the occupation, the nature of the contract (temporary or permanent), and the size of the company. We have also included both the lack, and excess, of capacity required to perform the job and the desire to work longer hours.
Regarding the variables associated with labor market precarity, two dummy variables have been created to observe whether individuals have the possibility of losing their job in the coming 6 months (instability) and whether it would be easy for them to find a job of similar salary (facility) were they to lose or quit their job. We have also generated a dummy variable that demonstrates whether a worker’s enterprise is generating employment (genemployment).
Initially, use of official Eurostat data of unemployment and temporality to capture labor market precarity was proposed, but several drawbacks were considered: first, the simultaneous use of sample and extra sample data, and second, the negative relationship that arises in many countries between temporary employment and unemployment. In fact, in those environments affected by economic crisis, there is frequently a reduction in temporary employment, associated not with greater stability in hiring, but with greater destruction of employment. Finally, in economically depressed settings, unemployment rates are relatively low as many individuals choose not to participate in the job market, given the poor chances of finding a job.
In Appendix Table A1, the set of variables, their definition, measurement methodology, their average, and standard deviation are shown.
To estimate the model, it is assumed that job satisfaction can be used as a proxy of individual work utility, so the following model is proposed:

Job satisfaction (hereafter JS*) is a latent variable that reflects the possibility of an individual being satisfied at work. As the variable is unobservable, we use the individual ordinal assessment for its measure. The connection between the latent variable and our dependent variable is defined in the following manner:
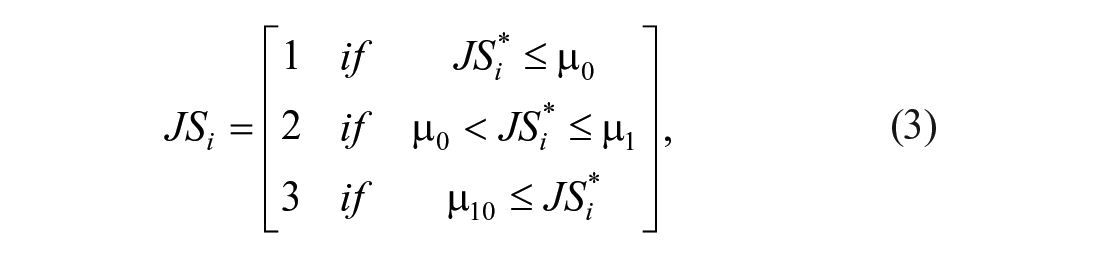
where μ represents values of latent job satisfaction, which define the observed job satisfaction intervals. It is assumed
The five values provided by respondents have been divided into two groups: satisfied (Values 1 and 2) and not satisfied (values 3, 4 and 5). Through this procedure, we partially eliminate the subjective component when the worker assigns a specific value to job satisfaction. In addition, results are easier to interpret and estimate. The estimates are carried out using a probit model (the estimates in tables show the marginal effects). Sample weights are used to weigh data.
Second, we have tried to assess whether significant differences in public sector job satisfaction exist between European countries based on the perception of labor market conditions. We have considered two different groupings, the first based on the instability of the labor market and the second on the capacity to find a new job. We have defined countries in which the percentage of individuals who consider they will lose their job in the next 6 months exceeds 10% of the total as “labour-unstable” (the opposite for stable countries). Likewise, countries in which less than 20% of individuals consider it feasible to find another job with similar characteristics in the event of losing their job have been defined as “difficult” (the opposite for “easy” countries). The choice of these thresholds was made according to the average of the 19 countries, and the difference between averages was found to be statistically significant. Once estimates have been made, the impact of the variable associated with the public sector is studied in each group.
Results
Average job satisfaction and the distribution of workers by sector (public or private) are reported in Table 1. As can be observed, 71.6% of the sample corresponds to private sector workers and 28.4% to public sector workers. This last proportion ranges between 38.5% in Luxembourg and 18.8% in Germany.
Job Satisfaction in the Public and Private Sector.
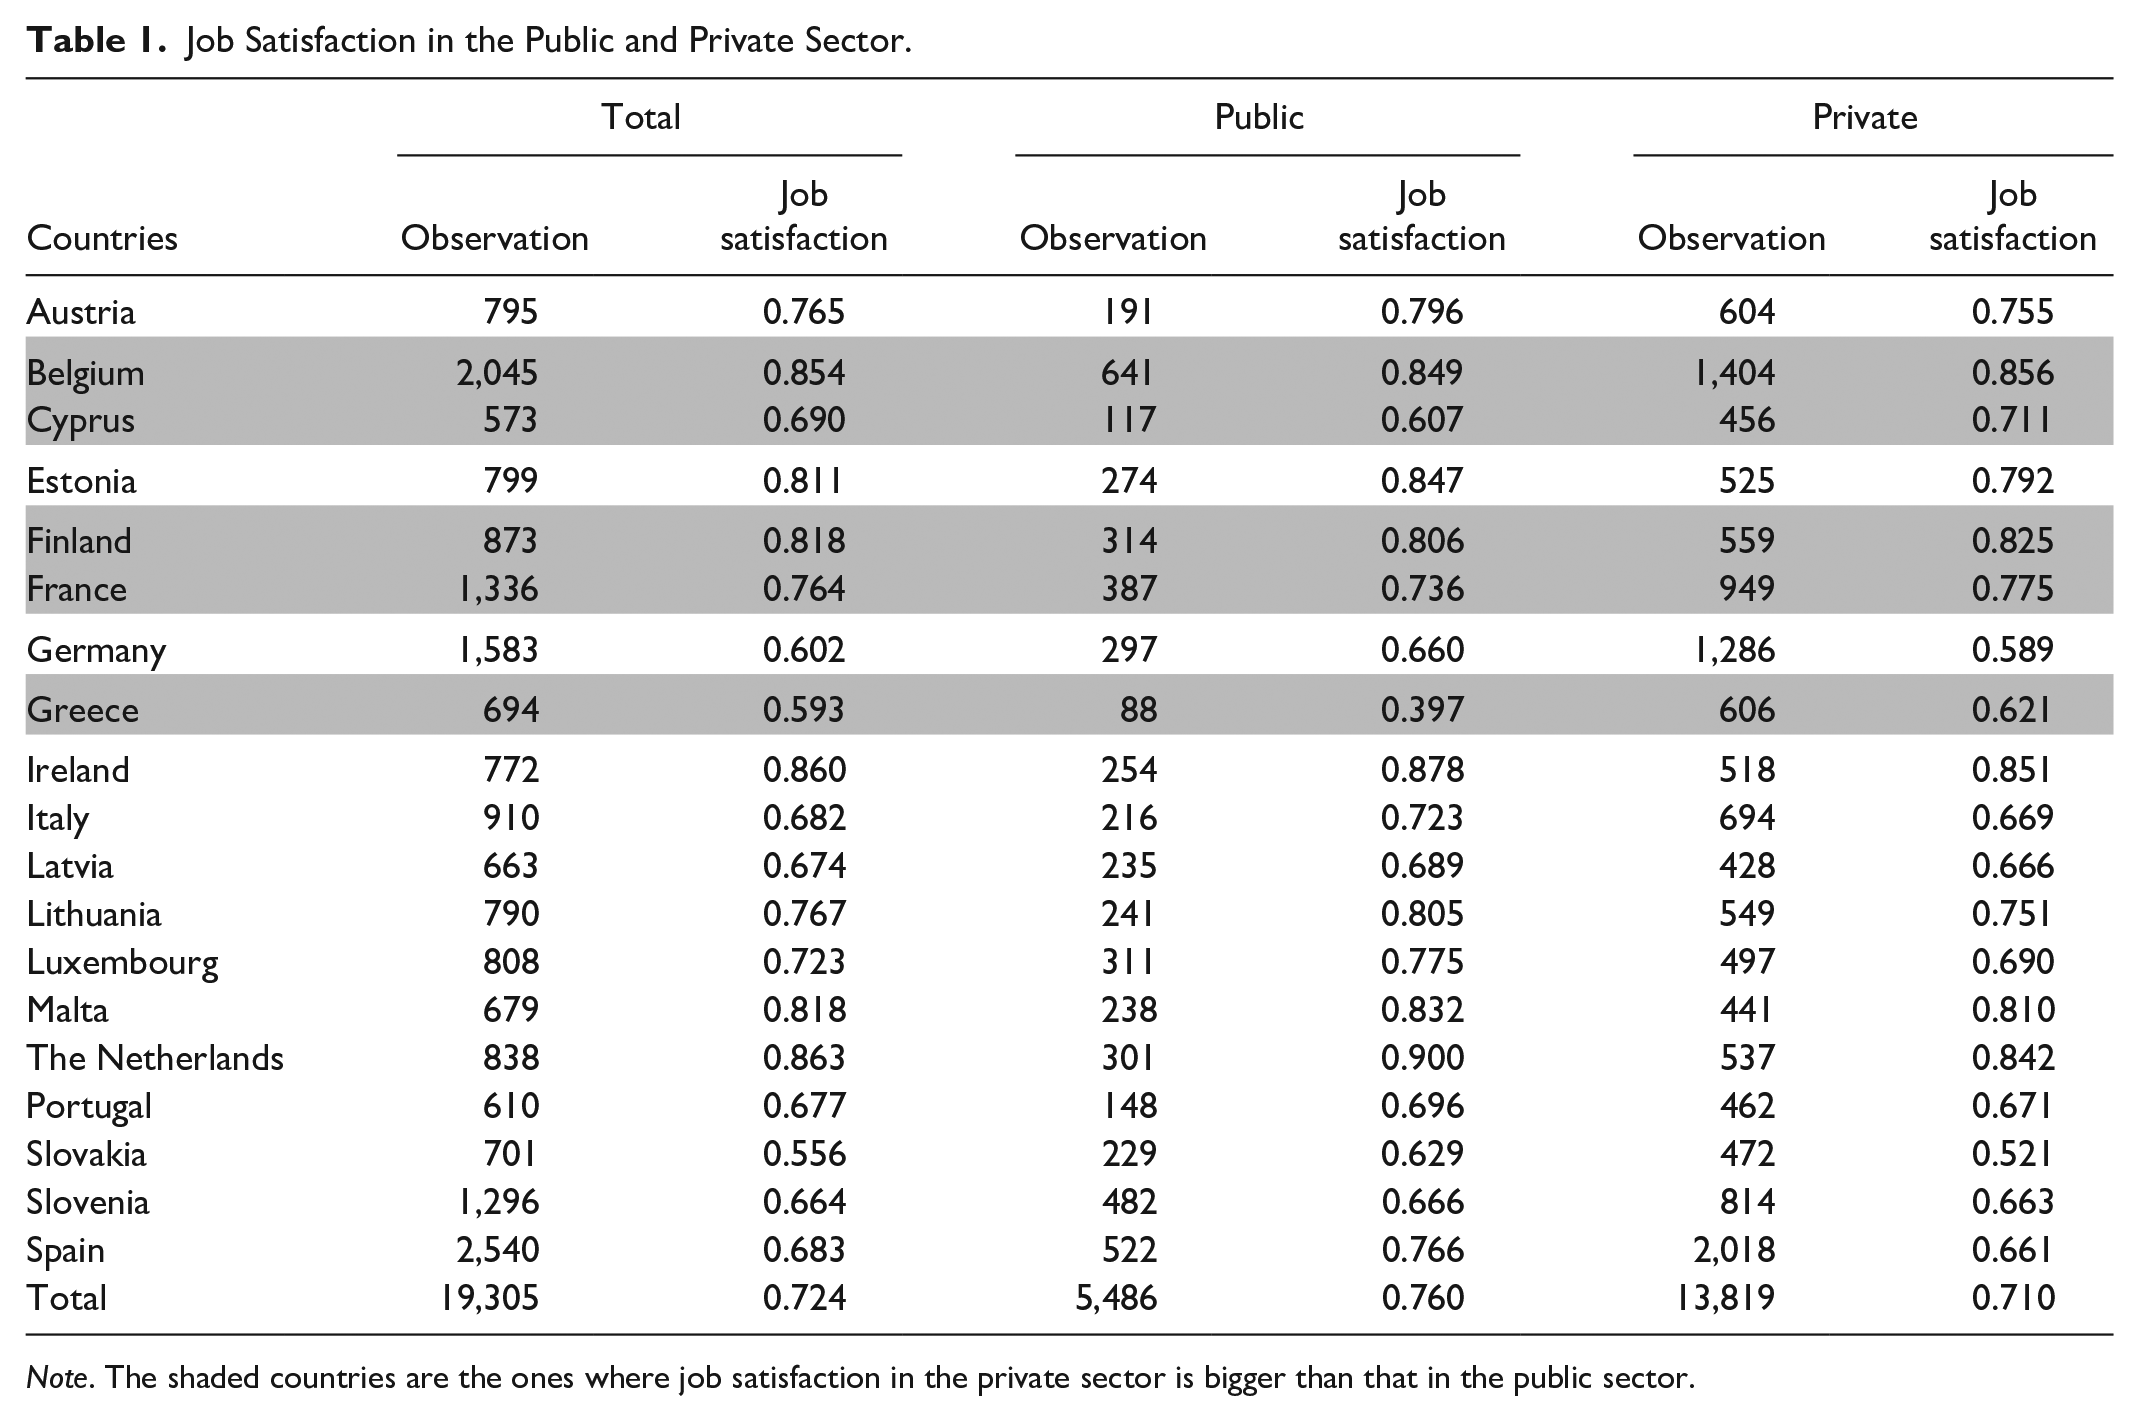
Note. The shaded countries are the ones where job satisfaction in the private sector is bigger than that in the public sector.
It is not possible to compare these percentages with real data as the limits of the government sector vary across member states, for example, jobs in education or health represent government employment in some countries though not in others. According to the European commission, and depending on the different definitions, the proportion of public sector workers ranges between 25% and 32%.
At an aggregate level, public sector employee job satisfaction is higher than in the private sector; however, this characteristic is not observed in all countries. In fact, in Belgium, Finland, Greece, France, and Cyprus (shaded countries), the average satisfaction of private sector workers is higher than in the public sector. The case of Greece is particularly striking, given that public sector workers have gone from a privileged work position prior to the economic crisis to a situation where the wages were reduced by around 25% to 30%, which has undoubtedly caused a drop in job satisfaction. Spain, Slovakia, Luxembourg, and Germany are among countries with the highest public sector worker job satisfaction. In Table A2 (Annex), it is possible to observe the participation of the public sector employment and the percentage of permanent and temporary contracts.
Table 2 shows econometric estimates using marginal effects to study the effect of working in the public sector on job satisfaction. Before we focus our attention on the variables, let us discuss other interesting results. The impact of the variable female is positive and statistically significant, which implies that women enjoy a higher probability of job satisfaction. This result is quite surprising as women’s working conditions in terms of job segregation and salary are often worse than their male counterparts’. In any case, numerous studies have reported this result (Clark, 1997; Kim, 2005; Long, 2005; Sánchez-Sánchez & Fernández, 2019; Sloane & Williams, 2000; Sousa-Poza & Sousa-Poza, 2000, 2007).
Estimation Results on Job Satisfaction.

As age range increases, so does the probability of job satisfaction. Thus, workers with the least probability of job satisfaction are those younger than 30 years, and those with the highest probability are aged between 65 and 75 years.
The probability of job satisfaction increases as self-reported health status ameliorates, as reported by Ahn and García (2004) and Satuf et al. (2018). Thus, workers who report their health is bad or very bad are less likely to be satisfied than those who consider it is fair, good, and very good health, respectively. Household income influences job satisfaction positively and significantly. Workers with higher education show higher probabilities of satisfaction than those corresponding to primary education (reference category), but the degree of significance is very low.
Regarding family-related variables, the impact of having a partner on job satisfaction is not significant, but that of having children is positive. Likewise, the difficulties to balance life and work have a negative and significant impact on the probability of satisfaction. Being an immigrant has a negative effect on the probability of satisfaction, though without statistical significance.
With regard to type of occupation, professionals, technicians, and associate professionals are more likely to be satisfied. Plant and machine operators, assemblers, and elementary occupations are the least likely to be satisfied.
Five variables have been selected to reflect workplace security or stability: temporary or a part-time contract, the possibility of losing the job in the next 6 months (instability), the ease of finding a new job with similar wage in case of current job loss (facility) and, finally, the prospects of the company of creating more employment (genemployment). These last three variables are reported by the worker and, consequently, subjective.
The estimates effectively corroborate the hypothesis that having a temporary contract has a negative impact on job satisfaction; however, the coefficient is not significant. These results differ from those obtained by Letourneux (1998) and Booth et al. (2002). In any case, the results could be partly biased due to other present variables that could reflect more accurately job insecurity. In the case of workers with part-time contracts, a negative impact on job satisfaction is observed. The explanation could be that individuals who perform a part-time job do so involuntarily, forced by the inability to find a full-time one. In any case, the variable that captures the desire of individuals to work longer hours is not significant. The effect of this variable is probably captured by part-time contracts.
Regarding the effect of the instability variable, results show a significant decrease in job satisfaction as the possibility of job loss increases. The variable facility, as we expected, has a positive impact. If workers consider that finding another job in the event of job loss will be relatively easy, probability of job satisfaction is higher. The same occurs when workers perceive that the company has good economic prospects and finds itself in a phase of job creation.
Our variable under study—working in the public sector—has a positive and significant influence on job satisfaction, in line with our initial hypothesis and the works of Steel and Warner (1990), Maidani (1991), DeSantis and Durst (1996), Demoussis and Giannakopoulos (2007), and Sánchez-Sánchez and Fernández (2020). The coefficient is positive even when variables associated with job instability are included, which implies that there are other factors that justify greater satisfaction in the public sector.
All the variables corresponding to countries are statistically significant except the Netherlands. The coefficients are negative, as the reference country is Belgium, where job satisfaction is very high. The ranking (from the highest to the lowest probability of job satisfaction) is as follows: the Netherlands, France, Germany, Malta, Spain, Finland, Latvia, Austria, Luxembourg, Cyprus, Greece, Ireland, Lithuania, Slovenia, Estonia, Italy, Portugal, and Slovakia.
To reach a deeper understanding of public sector job satisfaction, permanent and temporary contracts have been considered separately and introduced into the estimate (the referenced excluded variable is temporary private workers). The results are shown in Table 3 and Table A3 in the Annex.
Estimation Results on Job Satisfaction (Permanent and Temporal Contracts).

Note. Complete results are in Annex 2.
The highest degree of job satisfaction corresponds to that of public sector workers with permanent contracts (0.08), followed by the public sector workers with temporary contracts (0.05), private sector workers with permanent contracts (0.02), and the private sector employees with temporary contracts. These results again support the idea that it is not only contract permanence but also other elements that justify the higher degree of public sector employee job satisfaction. In fact, in some countries, the percentage of temporary contracts in the public sector is bigger than that of the public sector.
The sample has then been disaggregated considering workers in the public sector and those in the private sector (Table 4 and A4 in the Annex). First, it is worth noting that the variable instability is no longer relevant in the case of public sector workers. Likewise, the variable facility has a higher impact on private sector worker job satisfaction. In short, the possibility of losing a job does not seem to alter the perception of public sector workers, while the possibility of finding a new job with similar wage seems to have less impact than on the private sector. It is also very interesting that the variable linked with job creation perception, genemployment, does not affect public sector employee job satisfaction, whereas it does have an effect in the case of private sector workers. These facts seem to reinforce the idea that workers in the public sector feel safer than those in the private sector.
Estimation Results on Job Satisfaction in the Public and the Private Sector.

Note. Complete results in Annex 3.
Regarding the ranking of countries, the Netherlands displays the highest probability of job satisfaction, followed by Germany (this coefficient is not statistically significant), France, Malta, Estonia, Finland, Latvia, Austria, Luxembourg, Greece, Lithuania, Ireland, Slovakia, Spain, Cyprus, Slovenia, Portugal, and Italy.
Apart from the results corresponding to job satisfaction by country, there are others that should be highlighted. Women and workers with children experience greater probability of job satisfaction in the public sector, as pointed out by Sánchez-Sánchez and Fernández (2019). Intuitively, this result could be justified by the increased possibility to balance work and personal life. Given that women are still responsible for child care and dependent relatives in many countries, we may assume that the impact of the female variable was greater. In addition, the impact of being an immigrant is negative and significant in the public sector, but not in the private sector, though we have not found a priori any intuitive explanation for this differential result.
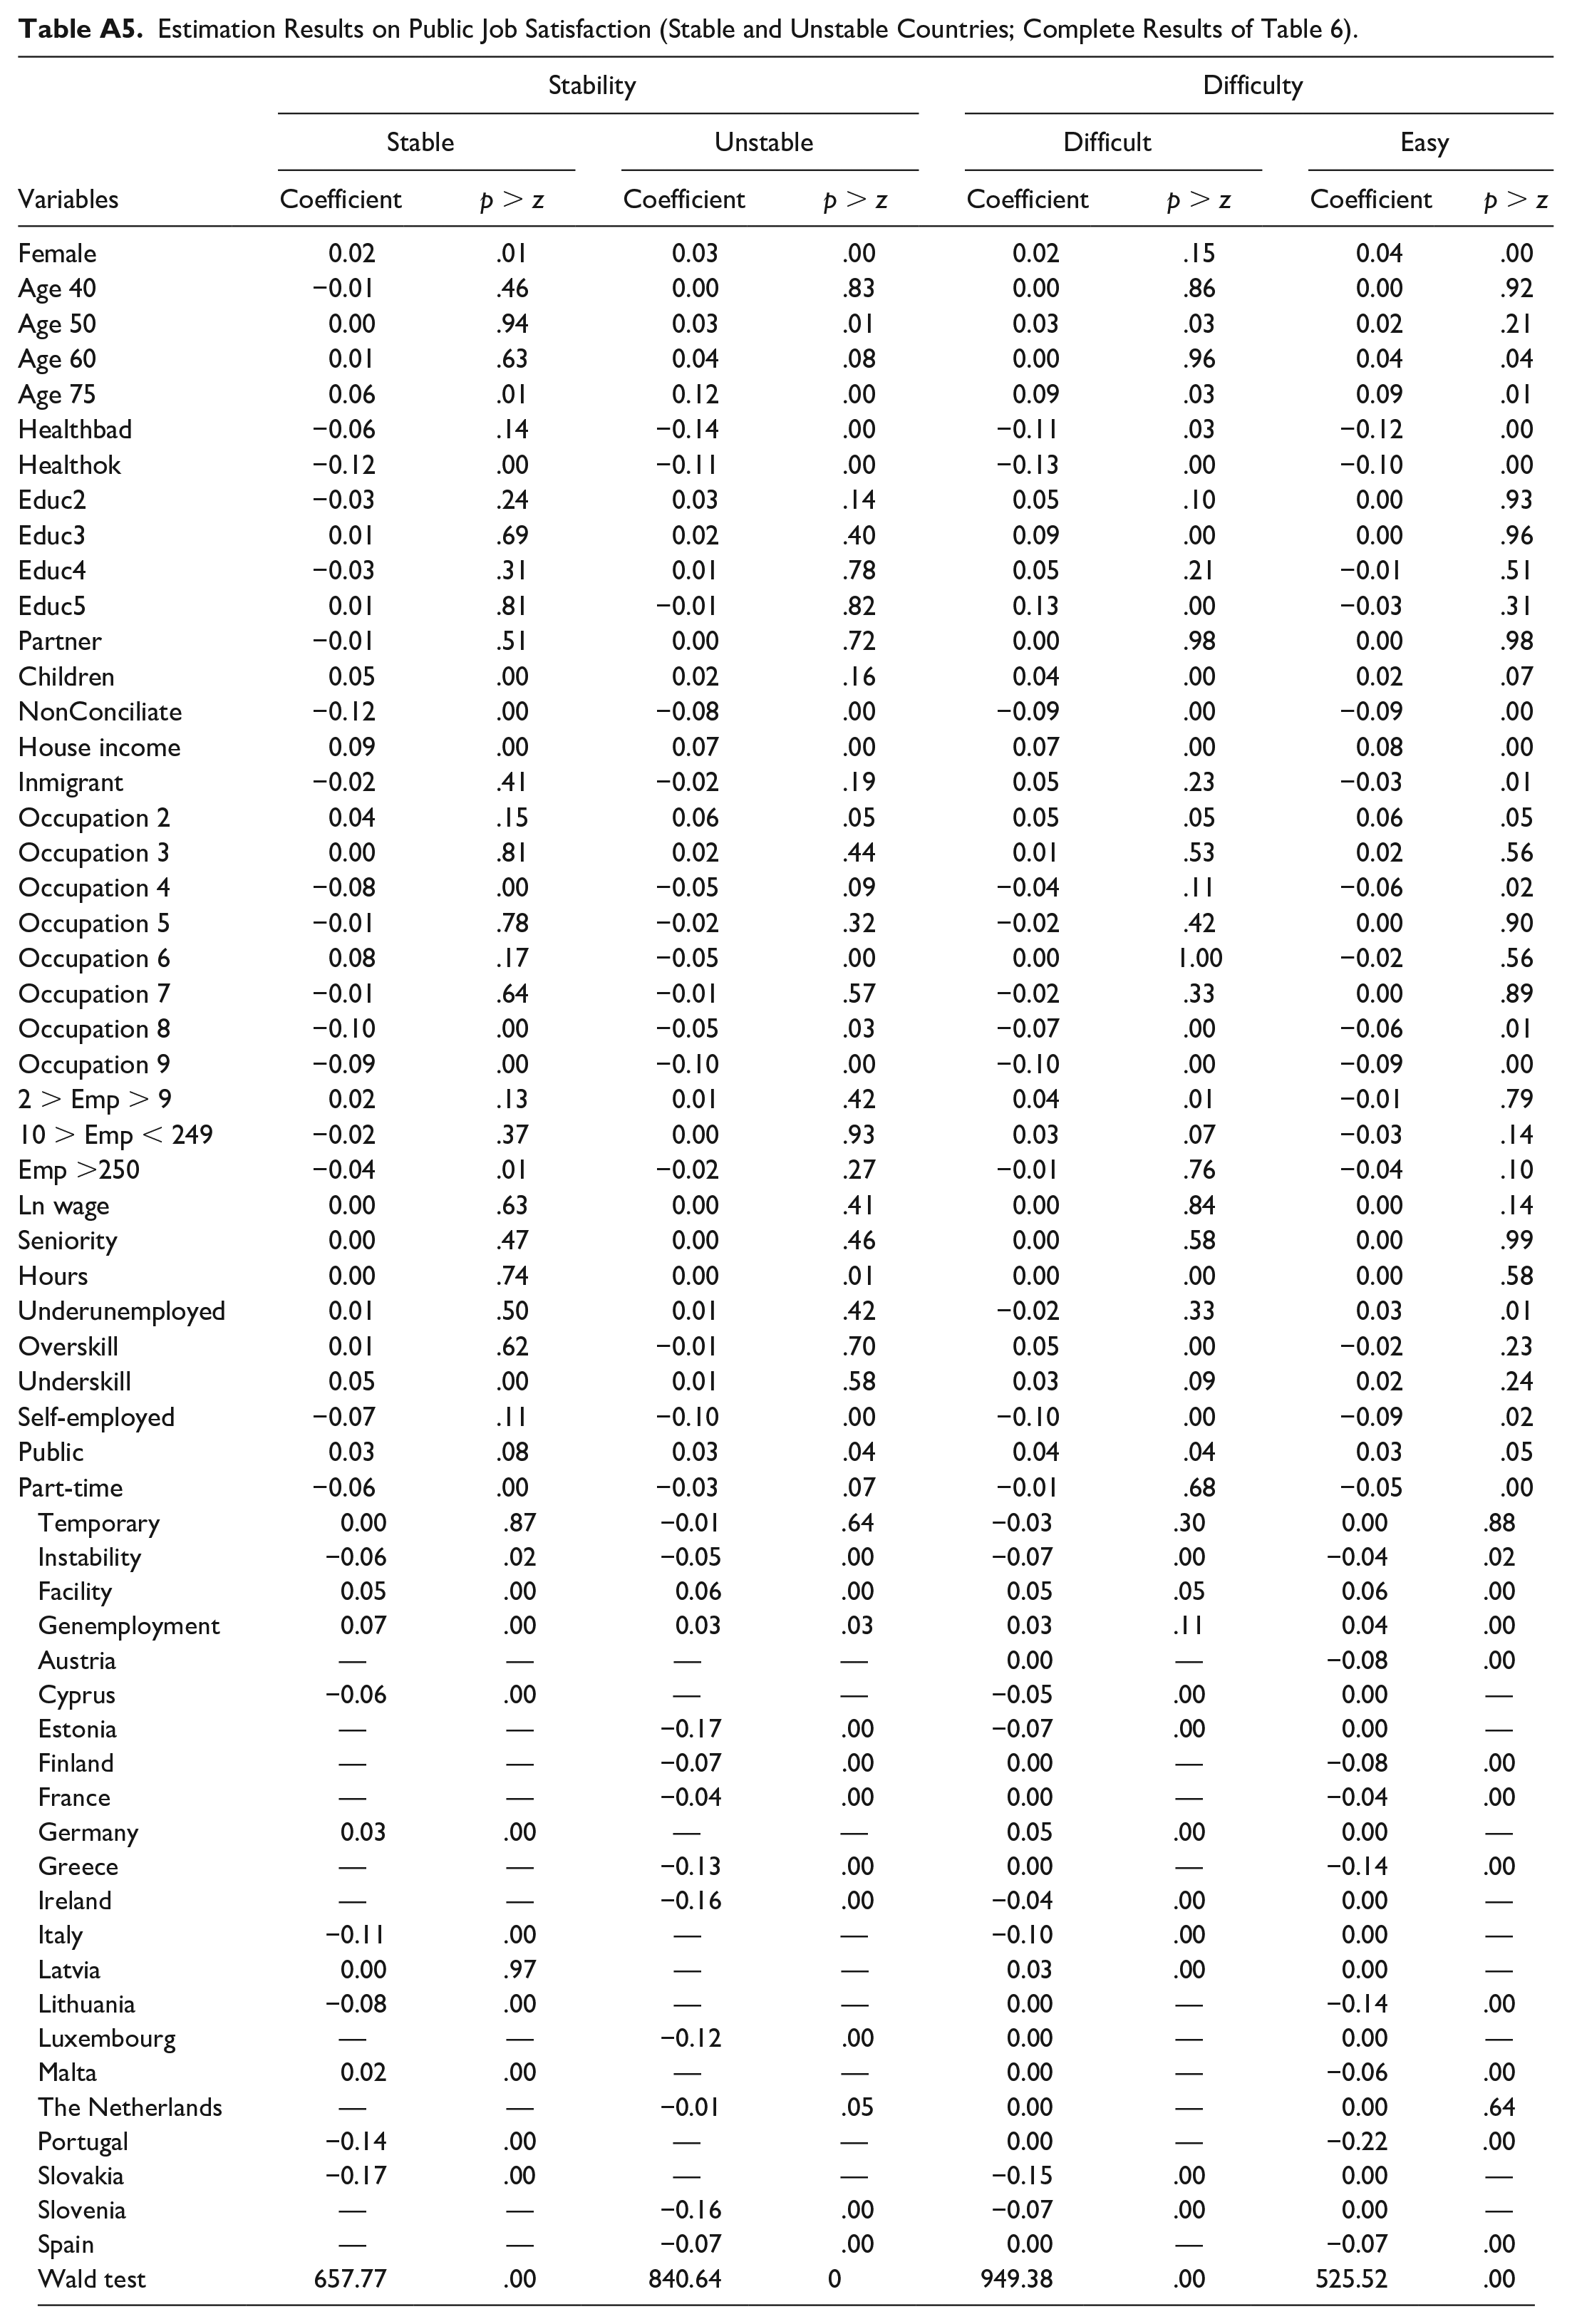
All the variables analyzed so far, including those corresponding to temporality and stability, refer to individual characteristics or individual perceptions. Our objective, however, is to observe how global perception of the labor market could alter job satisfaction and whether, specifically, a more negative perception of stability and the labor market could lead to greater satisfaction in the public sector, as suggested by Ortiz (2010). To contribute to this goal, a grouping of countries has been defined according to the variables associated with labor market perception. The estimates have been repeated, paying special attention to the coefficient associated with the public sector. First, we rank countries based on the perception of job stability (see Table 5 and Table A5 in the annex). As can be observed, we consider countries where more than 10% of individuals think they will lose their job in the next 6 months as labor unstable (shaded areas).
Instability and Difficulty to Find a Job (Percentage Over Sample).

Note. The countries with shaded areas are those that are considered unstable and/or with difficulties in finding employment.
The estimates show that the variable public is only significant in those countries considered unstable, labor markets in which the perception of workers regarding the continuity of their job position is low (Table 6 and Annex A4). Working in the public sector contributes to higher job satisfaction in more volatile work environments.
Estimation Results on Public Job Satisfaction (Stable and Unstable Countries; in brackets p > z).

Note. Complete results are in Annex 4.
Second, the countries are classified according to the difficulty in finding employment for workers who lose their job. Countries where less than 20% of individuals who lose a job consider it feasible to find another with similar characteristics are defined as difficult (shaded areas in Columns 3 and 4 of Table 5). As observed in Table 6 and Annex A4, the public sector coefficient associated is higher in countries defined as difficult. Again, increased precarity in the labor market leads to greater satisfaction among public sector workers.
The results endorse the view that public sector employee job satisfaction is higher than for those in the private sector, that the temporary nature of contracts is not the only variable that justifies this difference, and that workers’ perception of the labor market alters their job satisfaction. Specifically, we have identified that greater precarity in the labor market increases public sector employee job satisfaction.
It should be noted that the coefficients corresponding to the countries, with few exceptions, are statistically significant and high in both the former and latter estimates. Another type of groupings considering the public sector organizational, operational, and legal structure could enrich the analysis and justify differences in public sector employee job satisfaction.
Conclusion
This study analyses the impact of working in the Eurozone public sector on job satisfaction through the European Working Conditions Survey (2015). The differential impacts of each country on this variable and on public sector job satisfaction are analyzed. The article creates a grouping of countries based on the worker perception of labor market performance, specifically the perceived probability of losing their job in the near future and the probability of finding a new job with a similar salary.
We begin with a descriptive analysis, and then, econometric estimations are carried out using a probit model that includes worker and job characteristics. We focus our attention on the coefficients linked to the different countries and that associated with the public sector. In addition, we distinguish between temporary and permanent contracts in the private and the public sector.
The descriptive analysis shows that aggregated job satisfaction reported by public sector employees is higher than that of private sector employees. Nevertheless, this is not true of all countries. In fact, in Belgium, Finland, Greece, France, and Cyprus, average satisfaction of workers in the private sector is higher than that of public sector workers.
Econometric estimates show that public sector workers are likely to be more satisfied than those in the private sector. At a disaggregated level, the highest job satisfaction corresponds to public sector workers with permanent contracts, followed by public sector employees with temporary contracts, private sector workers with permanent contracts, and private sector with temporary contracts. This implies that it is not just the duration of the contract but other elements that justify the higher job satisfaction of public sector employees. Second, the variables linked to the countries have significant influence when analyzing differences in public sector job satisfaction.
The grouping of countries by labor market perception shows public sector job satisfaction is higher in countries with a greater number of individuals who consider it more probably they will lose their job. In addition, public sector job satisfaction is also higher in those countries where individuals are less confident of finding a new job with similar characteristics to the one they have. Definitively, greater perceived precarity in the labor market increases public sector employee job satisfaction.
From the point of view of policy implications, our analysis emphasizes the interest of studying macro variables corresponding to the labor market to identify the determinants of job satisfaction and not just those related to the worker’s job conditions (occupation, wage, seniority, number of hours worked, among others). In fact, instability and volatility in the labor market, variables that are beyond organizational human resources policies, could alter the workers’ consideration of their own job, increasing job satisfaction in some cases while decreasing it in others, and should be considered.
Finally, and regarding the limitations of the analysis, we were not able to study individual fixed effects as our cross-sectional survey is not a panel. Likewise, other public sector groupings could be made in Europe based on organizational, operational, and legal structures that could complete the analysis and justify differences in public sector employee job satisfaction. Future research should be focused on this field.
Footnotes
Appendix
Estimation Results on Public Job Satisfaction (Stable and Unstable Countries; Complete Results of Table 6).
| Stability | Difficulty | |||||||
|---|---|---|---|---|---|---|---|---|
| Stable | Unstable | Difficult | Easy | |||||
| Variables | Coefficient | p > z | Coefficient | p > z | Coefficient | p > z | Coefficient | p > z |
| Female | 0.02 | .01 | 0.03 | .00 | 0.02 | .15 | 0.04 | .00 |
| Age 40 | −0.01 | .46 | 0.00 | .83 | 0.00 | .86 | 0.00 | .92 |
| Age 50 | 0.00 | .94 | 0.03 | .01 | 0.03 | .03 | 0.02 | .21 |
| Age 60 | 0.01 | .63 | 0.04 | .08 | 0.00 | .96 | 0.04 | .04 |
| Age 75 | 0.06 | .01 | 0.12 | .00 | 0.09 | .03 | 0.09 | .01 |
| Healthbad | −0.06 | .14 | −0.14 | .00 | −0.11 | .03 | −0.12 | .00 |
| Healthok | −0.12 | .00 | −0.11 | .00 | −0.13 | .00 | −0.10 | .00 |
| Educ2 | −0.03 | .24 | 0.03 | .14 | 0.05 | .10 | 0.00 | .93 |
| Educ3 | 0.01 | .69 | 0.02 | .40 | 0.09 | .00 | 0.00 | .96 |
| Educ4 | −0.03 | .31 | 0.01 | .78 | 0.05 | .21 | −0.01 | .51 |
| Educ5 | 0.01 | .81 | −0.01 | .82 | 0.13 | .00 | −0.03 | .31 |
| Partner | −0.01 | .51 | 0.00 | .72 | 0.00 | .98 | 0.00 | .98 |
| Children | 0.05 | .00 | 0.02 | .16 | 0.04 | .00 | 0.02 | .07 |
| NonConciliate | −0.12 | .00 | −0.08 | .00 | −0.09 | .00 | −0.09 | .00 |
| House income | 0.09 | .00 | 0.07 | .00 | 0.07 | .00 | 0.08 | .00 |
| Inmigrant | −0.02 | .41 | −0.02 | .19 | 0.05 | .23 | −0.03 | .01 |
| Occupation 2 | 0.04 | .15 | 0.06 | .05 | 0.05 | .05 | 0.06 | .05 |
| Occupation 3 | 0.00 | .81 | 0.02 | .44 | 0.01 | .53 | 0.02 | .56 |
| Occupation 4 | −0.08 | .00 | −0.05 | .09 | −0.04 | .11 | −0.06 | .02 |
| Occupation 5 | −0.01 | .78 | −0.02 | .32 | −0.02 | .42 | 0.00 | .90 |
| Occupation 6 | 0.08 | .17 | −0.05 | .00 | 0.00 | 1.00 | −0.02 | .56 |
| Occupation 7 | −0.01 | .64 | −0.01 | .57 | −0.02 | .33 | 0.00 | .89 |
| Occupation 8 | −0.10 | .00 | −0.05 | .03 | −0.07 | .00 | −0.06 | .01 |
| Occupation 9 | −0.09 | .00 | −0.10 | .00 | −0.10 | .00 | −0.09 | .00 |
| 2 > Emp > 9 | 0.02 | .13 | 0.01 | .42 | 0.04 | .01 | −0.01 | .79 |
| 10 > Emp < 249 | −0.02 | .37 | 0.00 | .93 | 0.03 | .07 | −0.03 | .14 |
| Emp >250 | −0.04 | .01 | −0.02 | .27 | −0.01 | .76 | −0.04 | .10 |
| Ln wage | 0.00 | .63 | 0.00 | .41 | 0.00 | .84 | 0.00 | .14 |
| Seniority | 0.00 | .47 | 0.00 | .46 | 0.00 | .58 | 0.00 | .99 |
| Hours | 0.00 | .74 | 0.00 | .01 | 0.00 | .00 | 0.00 | .58 |
| Underunemployed | 0.01 | .50 | 0.01 | .42 | −0.02 | .33 | 0.03 | .01 |
| Overskill | 0.01 | .62 | −0.01 | .70 | 0.05 | .00 | −0.02 | .23 |
| Underskill | 0.05 | .00 | 0.01 | .58 | 0.03 | .09 | 0.02 | .24 |
| Self-employed | −0.07 | .11 | −0.10 | .00 | −0.10 | .00 | −0.09 | .02 |
| Public | 0.03 | .08 | 0.03 | .04 | 0.04 | .04 | 0.03 | .05 |
| Part-time | −0.06 | .00 | −0.03 | .07 | −0.01 | .68 | −0.05 | .00 |
| Temporary | 0.00 | .87 | −0.01 | .64 | −0.03 | .30 | 0.00 | .88 |
| Instability | −0.06 | .02 | −0.05 | .00 | −0.07 | .00 | −0.04 | .02 |
| Facility | 0.05 | .00 | 0.06 | .00 | 0.05 | .05 | 0.06 | .00 |
| Genemployment | 0.07 | .00 | 0.03 | .03 | 0.03 | .11 | 0.04 | .00 |
| Austria | — | — | — | — | 0.00 | — | −0.08 | .00 |
| Cyprus | −0.06 | .00 | — | — | −0.05 | .00 | 0.00 | — |
| Estonia | — | — | −0.17 | .00 | −0.07 | .00 | 0.00 | — |
| Finland | — | — | −0.07 | .00 | 0.00 | — | −0.08 | .00 |
| France | — | — | −0.04 | .00 | 0.00 | — | −0.04 | .00 |
| Germany | 0.03 | .00 | — | — | 0.05 | .00 | 0.00 | — |
| Greece | — | — | −0.13 | .00 | 0.00 | — | −0.14 | .00 |
| Ireland | — | — | −0.16 | .00 | −0.04 | .00 | 0.00 | — |
| Italy | −0.11 | .00 | — | — | −0.10 | .00 | 0.00 | — |
| Latvia | 0.00 | .97 | — | — | 0.03 | .00 | 0.00 | — |
| Lithuania | −0.08 | .00 | — | — | 0.00 | — | −0.14 | .00 |
| Luxembourg | — | — | −0.12 | .00 | 0.00 | — | 0.00 | — |
| Malta | 0.02 | .00 | — | — | 0.00 | — | −0.06 | .00 |
| The Netherlands | — | — | −0.01 | .05 | 0.00 | — | 0.00 | .64 |
| Portugal | −0.14 | .00 | — | — | 0.00 | — | −0.22 | .00 |
| Slovakia | −0.17 | .00 | — | — | −0.15 | .00 | 0.00 | — |
| Slovenia | — | — | −0.16 | .00 | −0.07 | .00 | 0.00 | — |
| Spain | — | — | −0.07 | .00 | 0.00 | — | −0.07 | .00 |
| Wald test | 657.77 | .00 | 840.64 | 0 | 949.38 | .00 | 525.52 | .00 |
Declaration of Conflicting Interests
The author(s) declared no potential conflicts of interest with respect to the research, authorship, and/or publication of this article.
Funding
The author(s) received no financial support for the research, authorship, and/or publication of this article.