
Abstract
One of the targets in the Sustainable Development Goals (SDGs), which is Target 6.2, aims to achieve access to adequate and equitable sanitation. The Government of Indonesia targets universal access to improved sanitation in 2019. However, almost two out of five households in Indonesia are without access to improved sanitation. Moreover, access to improved sanitation is lower in rural areas than that in urban areas. Studies examining the drivers of the disparity in Indonesia are also limited. Therefore, this study was aimed at assessing the characteristics associated with the rural–urban disparity in access to improved sanitation facilities among households in Indonesia. We employed data from the 2016 Indonesian National Socio-Economic Survey (SUSENAS) comprising 290,848 households. The analysis was twofold. First, we fitted multivariate probit regression models using average marginal effects as the measure of association. We then conducted a detailed non-linear decomposition of the rural–urban disparity attributable to all the explanatory variables. The multivariate regression analysis suggested that households living in rural areas were 11.35% (95% confidence interval = [10.97, 11.72]) less likely to have access to improved sanitation facilities than those residing in urban areas. The decomposition analysis suggested that 48.78% are attributable to spatial, demographic, housing, and socio-economic factors, which meant that almost half of the inequalities could be reduced by equalizing these factors. The results provide a decomposition of factors amenable to curtail urban–rural inequalities. Hence, equity-oriented approaches to increasing access to improved sanitation should be prioritized to achieve universal access in 2030 in line with SDG Target 6.2.
Keywords
Introduction
Water, sanitation, and hygiene (WaSH) are paramount for human development, as without them there will be health and social implications. Improved sanitation facility, alongside with improved drinking water supply and handwashing facility, is pivotal in preventing humans from acquiring infectious diseases and helping children reach their fifth birthday (Mara et al., 2010; Prüss-Ustün et al., 2014, 2019; Wolf et al., 2018, 2019). An estimated 297,000 deaths among under-5 children in 2016 were attributable to lack of WaSH (Prüss-Ustün et al., 2019). Moreover, poor sanitation is associated with lower cognitive skill (Spears & Lamba, 2016), impaired physical development (Headey & Palloni, 2019; Spears et al., 2013), impaired cognitive development and school absenteeism (G. D. Sclar et al., 2017), and lower mental and social well-being (G. D. Sclar et al., 2018). Furthermore, sanitation, in particularly menstrual hygiene, has important implications for gender equality and dignity (Burt et al., 2016; Langford et al., 2017). These studies show that lack of WaSH has extensive adverse health and social implications.
Globally, however, there are 2.3 billion people who still lack access to even a basic sanitation service in 2015 (World Health Organization/United Nations Children’s Fund Joint Monitoring Program [WHO/UNICEF JMP], 2017). Moreover, the progress on sanitation is lagging behind that of drinking water (Cumming et al., 2014). The Sustainable Development Goals (SDGs) target 6.2 aims to “by 2030, achieve access to adequate and equitable sanitation and hygiene for all and end open defecation, paying special attention to the needs of women and girls and those in vulnerable situations” (United Nations, 2016). In relation to achieving this target, addressing geographical disparities in access to improved sanitation is one of the ways to increase sanitation coverage.
Access to sanitation has received ample attention worldwide. The extant studies mainly are on the determinants of access to improved sanitation facilities (Abubakar, 2017; Adams et al., 2016; Adewara et al., 2018; Armah et al., 2018; Gazzeh & Abubakar, 2018; Mulenga et al., 2017; Njuguna, 2019; Park et al., 2016; Tiwari & Nayak, 2013; Tumwine et al., 2003). These studies indicate spatial inequalities with relation to region of residence and rural–urban inequality. Other studies focus on access in the rural areas (Akpakli et al., 2018; De, 2018; Grady et al., 2018).
Access to sanitation in Indonesia has received considerable attention. Prasetyoputra and Irianti (2013) analyzed the 2007 Indonesia Family Life Survey (IFLS) to investigate the spatial and socio-economic factors associated with households’ access to improved sanitation facilities. They found there were regional and socio-economic inequalities among households. Households residing in rural areas were lagging behind their urban counterparts. Moreover, Patunru (2015) addressed the progress in access to improved water and sanitation and their relationship with diarrhea. However, he did not investigate the determinants of sanitation access. Then in 2018, Afifah and colleagues (2018) went deeper and analyzed the 2015 Indonesian National Socio-Economic Survey (Survei Sosial Ekonomi Nasional, henceforth SUSENAS) at the district level. They presented several measures of inequalities with regard to access to improved drinking water sources and sanitation. Although such information is useful, they are only descriptive statistics. These studies, however, have not quantified the determinants of the rural–urban inequality in access to improved sanitation facilities. This research gap begs the question as to what are the underlying factors behind these inequalities.
Therefore, this study was aimed at assessing the characteristics associated with the rural–urban disparity in access to improved sanitation facilities among households in Indonesia. Our study’s contribution is twofold. First, to the best of our knowledge, no study has investigated the determinants of improved sanitation with a large-sampled nationally representative data. Second, we provided extra information by decomposing the rural–urban inequality in access to sanitation. The rest of the article is organized as follows. The next section outlines the data and methods used in this study. The section afterward presents the main empirical findings. The final section then discusses the results and concludes.
Materials and Methods
Data Source
We employed data from the 2016 SUSENAS conducted by Statistics Indonesia (BPS RI, 2016). It is one of the oldest nationally representative surveys that cover the entire archipelago. The SUSENAS was initiated in 1963–1964, and since 1993, the survey covers a nationally representative survey (RAND, 2020).
The SUSENAS has two kinds of instruments, namely, a core questionnaire and a module questionnaire. The present study used the core questionnaire, which collects information on education, jobs, smoking behavior, health care utilization, immunization, and reproductive health of individuals. It also contains information on housing conditions and social protection.
Ethics Statement
The present study is a secondary analysis of the 2016 SUSENAS which have been de-identified by Statistics Indonesia to preserve anonymity. Hence, no additional ethical clearance is needed.
Study Population and Sample Size
The core component of the 2016 SUSENAS consists of 1,109,749 individuals from 291,414 households. For the purpose of the article, we conducted the analysis at the household level.
Outcome Variable
The main outcome of interest was the household’s access to an improved sanitation facility—facilities that are not shared between households and hygienically prevent exposure to human excreta (WHO/UNICEF JMP, 2003, 2006). This was constructed from the responses obtained from the following three questions addressed in the 2016 SUSENAS:
Does the household own a sanitation facility, and who uses it?
What kind of toilet facility/latrine do members of your household usually use?
Where is the final disposal site of excreta?
In the outcome variable construction process, we adhered to WHO/UNICEF JMP (2006) classification of improved sanitation facility in 2006. The reason that we used the old categorization instead of the new one (safely managed sanitation) is that the latter requires additional information on the availability of handwashing facilities with soap in the household. The 2016 SUSENAS core questionnaire, however, does not provide this information.
Explanatory Variables
The explanatory variables in the study were selected based on extant literature and exploratory analysis (results are not shown in the article for the sake of brevity). We then categorized the explanatory variables in the present study into four main groups, namely, spatial, demographic, housing-related, and socio-economic variables.
Extant studies show evidence of spatial inequalities worldwide (Abubakar, 2017; Adams et al., 2016; Kumar, 2017) and in Indonesia (Prasetyoputra & Irianti, 2013). Therefore, we included the region of residence (Java, Bali & Nusa Tenggara, Kalimantan, Sulawesi, Maluku & Papua) and place of residence (rural area vs. urban area) as the spatial variables.
With respect to demographic variables, past studies observed that age of household head (Adewara et al., 2018; Akpakli et al., 2018), sex of household (Adams et al., 2016; Akpakli et al., 2018; De, 2018; Mulenga et al., 2017), and marital status of household head (Akpakli et al., 2018) influence the probability of having improved sanitation facilities. The demographic variables in this study comprise civil registration of household head (no, yes), gender of household head (male, female), age of household head (in years), marital status of household head (not married, married, divorced/separated, widowed/widower), number of families living in the dwelling (one, two, three or more), number of household members (in persons), and number of under-5 children (none, one, two or more).
Furthermore, studies have shown that housing variables significantly influence the likelihood of a household having access to adequate sanitation (Adams et al., 2016; De, 2018; Grady et al., 2018). In this study, the housing-related variables are drinking water ladder (unimproved source, improved source, piped water), the energy source for lighting (Electricity from the State company, electricity not from the State company, not from electricity), and housing tenure (Other tenures, self-owned).
Finally, studies have also observed the relation between socio-economic status (SES) and access to sanitation (Abubakar, 2017; Akpakli et al., 2018). In this study, the SES variables include housing tenure (self-owned, other tenure), education of household head (none, elementary, junior high, senior high, college or higher), employment of household head (unemployed, self-employed, employed, other employment), per capita household expenditure (in logarithmic form), and quintiles of wealth index. The wealth index was constructed using polychoric principal components analysis (PCA) of the following set of variables: ownership of assets, the material of roof, the material of wall, the material of floor, and the main source of cooking energy (Kolenikov & Angeles, 2009).
Econometric Analysis
Our objective is to address the factors associated with the rural–urban inequality in access to improved sanitation. The conventional logit or probit regression model (Hosmer et al., 2013), however, does not suffice the objective. Therefore, we go further and decompose the rural–urban gap.
Our analysis is composed of three main components. First, we explored the processed and cleaned 2016 SUSENAS dataset for potential explanatory variables. Second, we fitted three probit regression models to the data: (a) sample of urban households, (b) sample of rural households, and (c) complete sample. This step is necessary to find out whether the rural–urban inequality in sanitation access is evident in the data (shown by statistical significance in the place of residence variable). We then continued by providing a decomposition of the rural–urban gap in access to sanitation using the generalized Blinder–Oaxaca decomposition for categorical outcome variable models. This procedure was performed using the “MVDCMP” command in STATA (Powers et al., 2011). This command has been used before in many previous studies (Ariho et al., 2018; Levanon et al., 2019; Liu & Lu, 2018; Popham et al., 2012).
One advantage of using the command is that it gives detailed decomposition results and standard errors for both characteristics and coefficient components for various models (Powers et al., 2011). This user-written command enables us to examine the relative impact of each explanatory variable on the differential in access to improved sanitation between rural and urban households. The command is also useful as it accommodates the use of dummy variables in the regression models. We conducted all of the econometric analyses using STATA version 13.1 (StataCorp, 2013).
Results
Sample Characteristics
The initial sample of 291,414 households was reduced to 290,233 households (equals to 99.59%) in the complete case analysis when cases with missing data were excluded (Dong & Peng, 2013). The result shows that 58.10% (95% confidence interval [CI] = [57.92, 58.28]) reported having access to an improved sanitation facility (Figure 1).

Access to improved sanitation by place of residence in Indonesia.
Regression Results
Table 1 presents the results of the multivariable probit regression. There are three regression models, namely, the “urban sample,” the “rural sample,” and the “complete sample.” The average marginal effects (AMEs) were multiplied by 100 to ease the interpretation of the probabilities. The “complete sample” probit regression model was statistically significant with McFadden R2 of 16.20%. Likewise, the two sub-group regression models, urban and rural samples, were also significant with values of McFadden R2 of 10.40% and 13.00%, respectively.
Average Marginal Effects for Access to Improved Sanitation Facility in Indonesia.
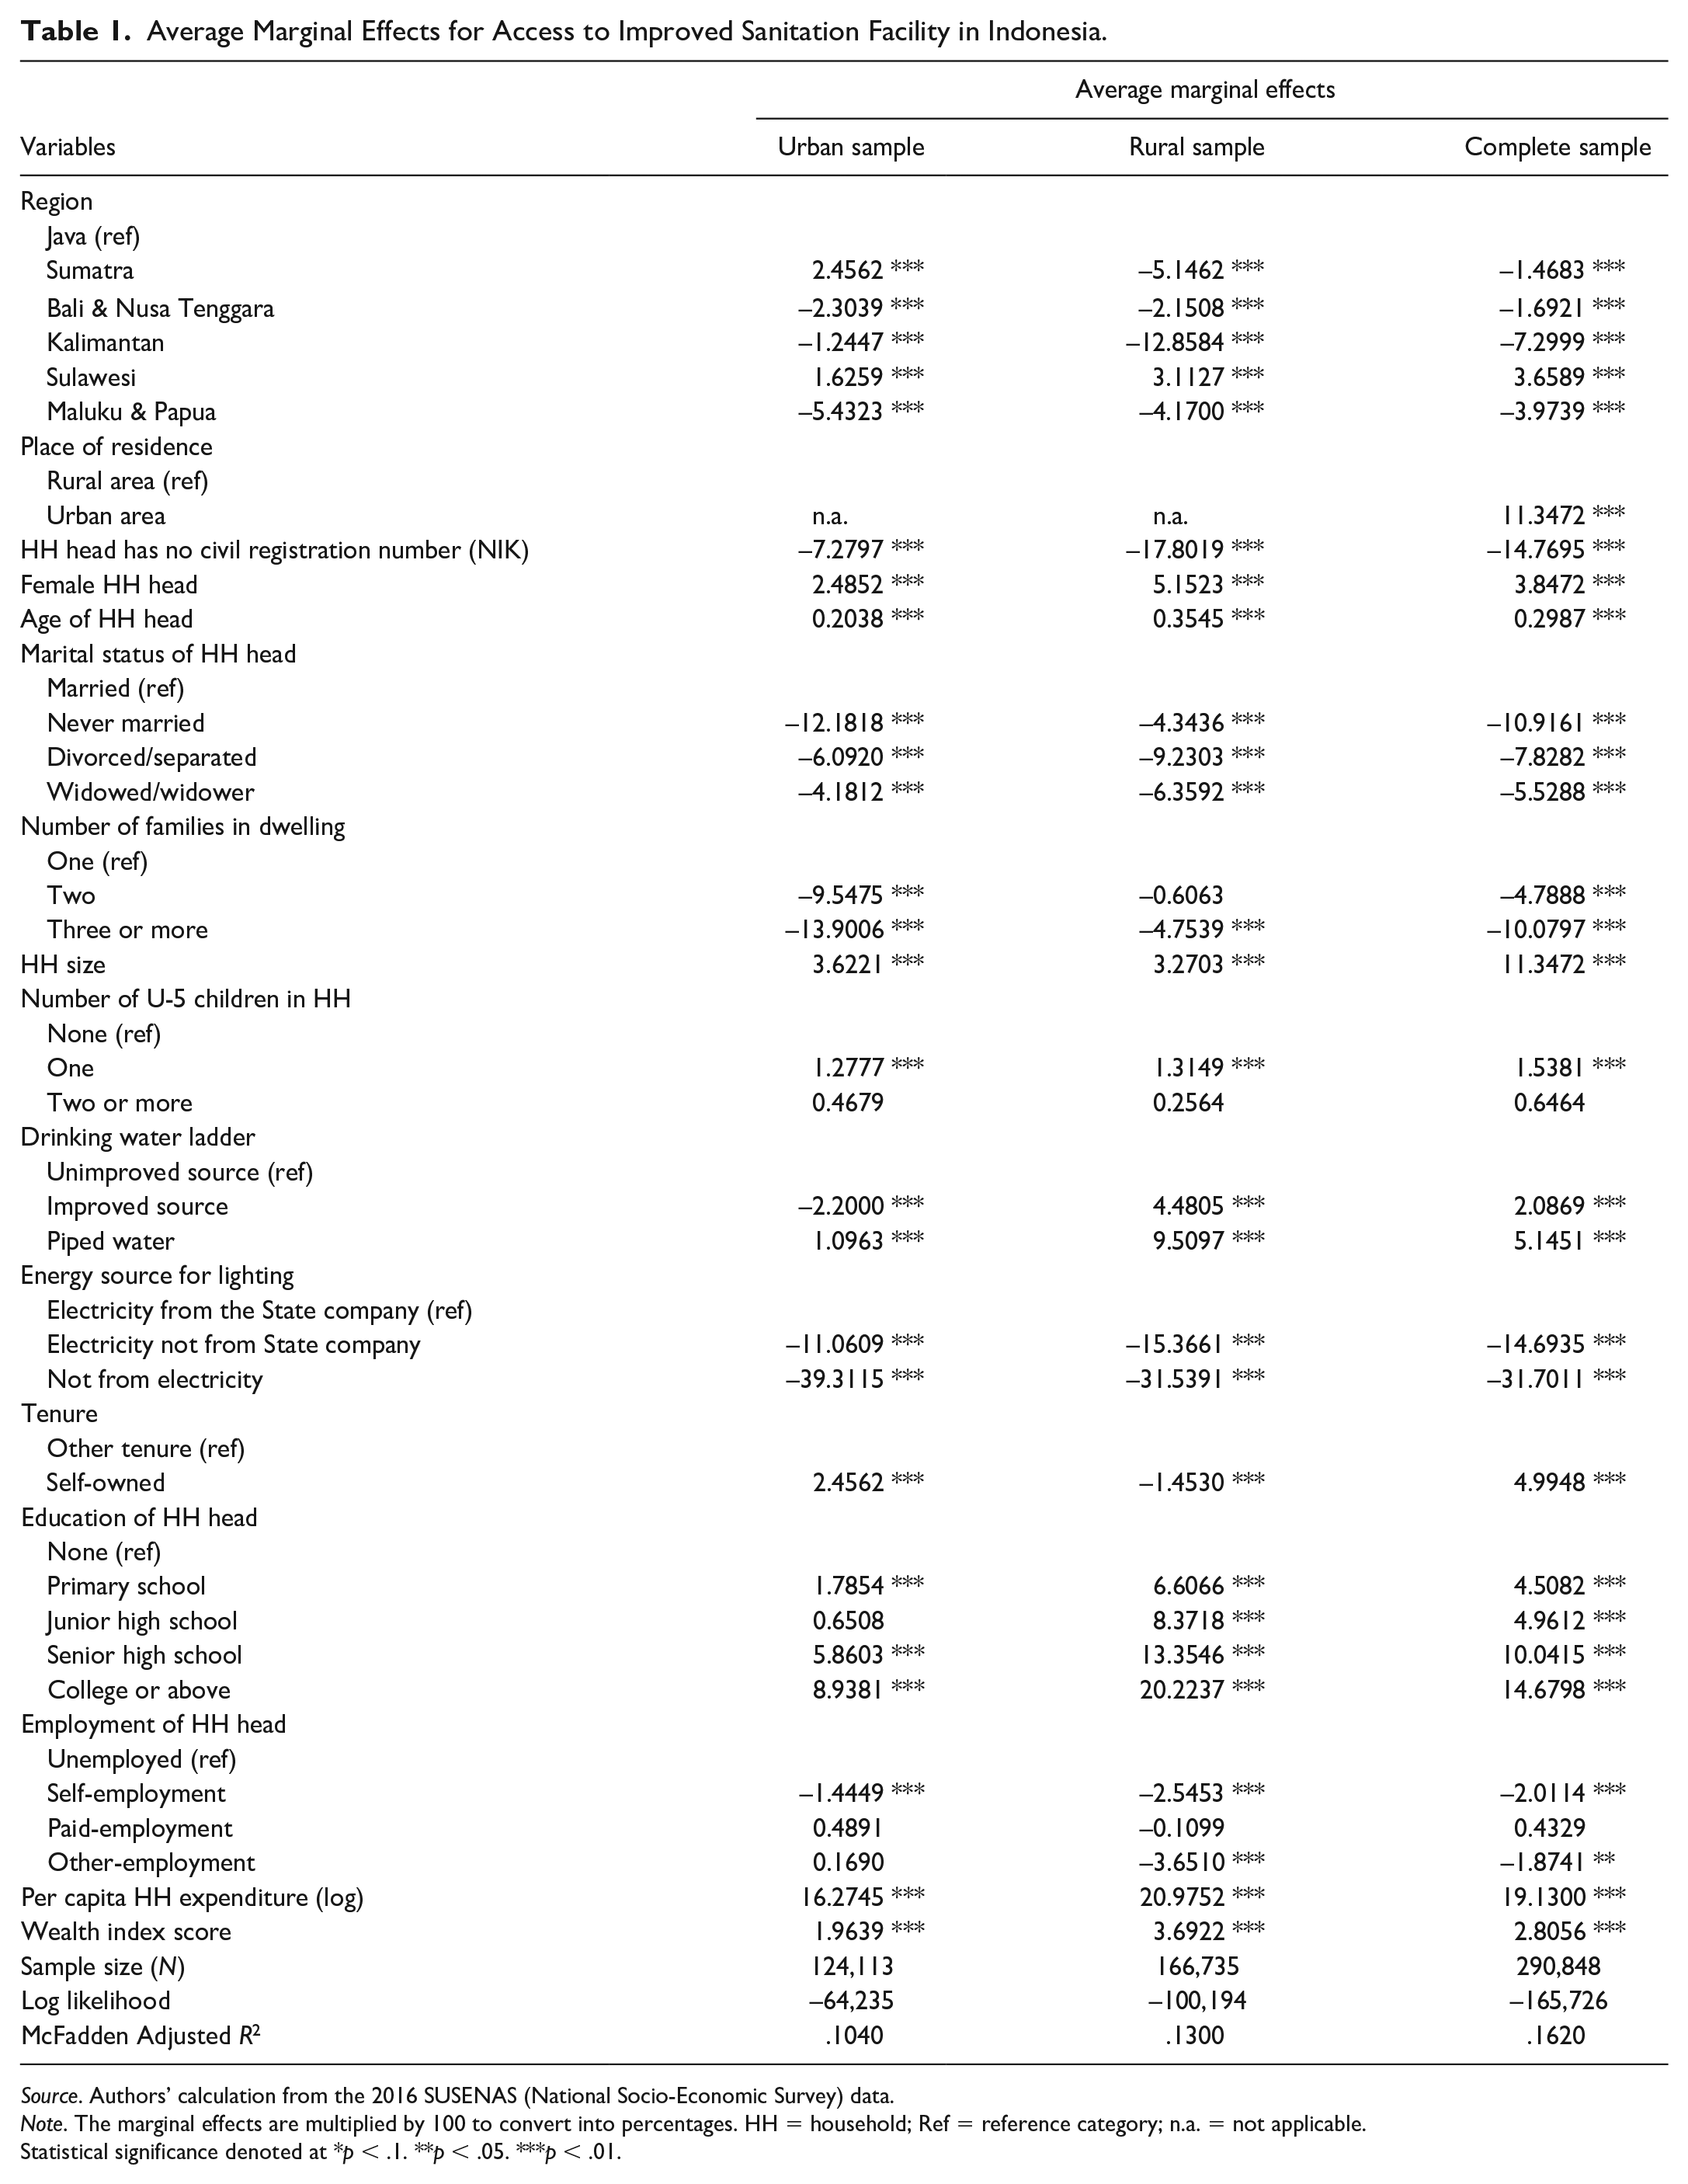
Source. Authors’ calculation from the 2016 SUSENAS (National Socio-Economic Survey) data.
Note. The marginal effects are multiplied by 100 to convert into percentages. HH = household; Ref = reference category; n.a. = not applicable.
Statistical significance denoted at *p < .1. **p < .05. ***p < .01.
The significant variables in the complete model are region, place of residence, civil registration of household head, sex of household head, age of household head, marital status of household head, number of families living in the dwelling, number of under-5 children, drinking water ladder, lighting energy source, housing tenure, education of household head, employment of household head, consumption expenditure, and household wealth.
Decomposition Results
Table 2 presents the results of the non-linear decomposition analysis, which is the overall contribution of characteristics and the explanatory variables on access to sanitation among Indonesian households. The explanatory variables can explain 48.78% of the rural–urban disparity. Put differently, if the characteristics of households related to the explanatory variables were leveled, almost half of the rural–urban inequality would be reduced. As for the results of the detailed decomposition, we present it in the appendix to preserve space.
Overall Decomposition of Rural–Urban Disparity in Access to Improved Sanitation.

Note. CI = confidence interval; E = component representing differences characteristics; C = component representing differences in access to improved sanitation.
p < .01.
Discussion
Using the nationally representative SUSENAS survey in Indonesia in 2016, we explored the factors associated with sanitation access, and decomposed the rural–urban disparity in sanitation. From the regression analyses, there are two salient findings. First, we observed spatial inequalities. Households living in rural areas were laggards compared with their urban counterparts in access to improved sanitation facilities, with as much as 11.35% lower probability. Moreover, there exist disparities at the regional level among both rural and urban households. These findings are consistent with similar previous studies in the context of Indonesia (Afifah et al., 2018; Patunru, 2015; Prasetyoputra & Irianti, 2013) and in other settings (Abubakar, 2017; Adams et al., 2016; Adewara et al., 2018; Armah et al., 2018; Gazzeh & Abubakar, 2018; Mulenga et al., 2017; Njuguna, 2019; Tiwari & Nayak, 2013; Tumwine et al., 2003).
Second, factors related to SES of households strongly determine access to improved sanitation facilities in both rural and urban households. These relationships are in line with that of previous studies (Abubakar, 2017; Adams et al., 2016; Prasetyoputra & Irianti, 2013). We further found the effect of SES variables is stronger in rural households than in urban households. Moreover, the decomposition analysis revealed that per capita consumption expenditure (23.45%), as a proxy of household income, was the dominant predictor of the rural–urban disparity in access to improved sanitation facilities, followed by access to electricity that constitutes 13.46% of the rural–urban variation gap. Having access to proper electricity means that the households are residing in better neighborhoods, which could also explain why they are more likely to have access to improved sanitation.
Moreover, the decomposition analysis revealed that almost half of the variation (48.78%) in the rural–urban gap in sanitation access is attributable to all the explanatory variables. A similar figure was also found by Adewara and colleagues (2018) who analyzed national data from Nigeria. They showed that if the socio-economic characteristics of the households were improved, the rural–urban inequality could be reduced by 43.18%.
The findings in this study have several important policy implications. The Government of Indonesia (GoI) realizes the need to overcome the rural–urban disparities in access to improved sanitation, considering there is a global commitment to achieve SDG six implying that the slogan of “no one left behind” cannot be met without addressing the rural problem of access to improved sanitation and it will eventually turn into safely managed sanitation. The government has provided program policy on Community-Led Total Sanitation (CLTS) as stated in the Ministerial Health Decree Number 852/2008 concerning the National Strategy for CLTS (Ministry of Health [MoH], 2008). The Decree was revised to become Number 3/2014 pertaining sanitation in a broader scope of five pillars not only to stop open defecation but also to include hand washing with soap, household drinking water and food sanitation, and solid waste and waste water management (MoH, 2014). The MoH should refocus the CLTS as an approach of behavior change in sanitation as to create demands on improved sanitation just like the original philosophy of CLTS created by Kar and Chambers (2008).
Improving the global urban health is one of the key contemporary challenges in development (Garau et al., 2004; E. D. Sclar et al., 2005). Inadequate sanitation has also suffered by slum inhabitants, as there is not enough space even for communal sanitation facilities and the high cost of sanitation construction. Insufficient funding for sanitation also undermines demands for better sanitation ladders in both areas as only 0.8% of gross domestic product (GDP) is allocated for the sanitation sector. To achieve further increase in the proportion of sanitation coverage, the Ministry of Finance launched a special fund for low-income households to install communal latrines. In addition, the Ministry of Public Works and Housing also supports local governments with reimbursement funds for improving septic tanks. All the efforts only constitute US$3 per capita for providing proper WASH, whereas, the minimum requirement for constructing a WASH facility per capita is about US$36. Therefore, gathering aids for WASH is of importance for gaining health benefits from WASH, particularly sanitation.
An institutional reform also contributes to the increasing effort for sanitation conditions in rural areas of Indonesia, such as the launch of the Ministry of Villages, Development of Disadvantaged Regions and transmigration in 2014. The Ministry has focused on the development of rural areas to catch up the achievement of urban areas including WASH sector through SDGs for Villages Program and provides significant funds. Nevertheless, the success of WASH sector depends on the effective collaboration of all stakeholders under the coordination of the Ministry of National Development/National Agency for Development Planning. Moreover, sustainable funding will also be important to maintain the progress of sanitation development.
Study Strength and Limitations
This article employed one of the rounds of the SUSENAS, which is a large-scale survey and have been used regularly by Statistics Indonesia to provide national-level indicators. The large sample implies large statistical power. Nonetheless, it does not mean that this article is without any limitations. The first drawback comes from the fact that it employed a secondary data, which means the scope of the analysis is confined to the variables collected in the SUSENAS. Thus, important factors related to sanitation access may not be covered by such survey. One example is culture, which may influence the behavior of households (Dwipayanti et al., 2019; Paul, 1958; White, 2011). Another limitation is the cross-sectional form of the 2016 SUSENAS that hinders the establishment of causality between the explanatory variables and the outcome variable. These limitations should be kept in mind when using the results of this article.
Conclusion
This article utilized a non-linear decomposition method to address the determinants of rural–urban disparities in access to improved sanitation facilities. The decomposition analysis provides richer useful information to policymakers in Indonesia. Our study argues that the SES of households remains pivotal in explaining rural–urban disparities of sanitation. As such, providing sufficient funding for cost-effective interventions to increase access to improved sanitation would have multiple health benefits in line with SDG target 6.2. Moreover, a concerted effort between ministries, public institutions, and the private sector is key to achieving the target. Finally, the underlying factors behind geographical inequalities in drinking water supply would be one urgent research agenda.
Footnotes
Appendix
Detailed Probit Decomposition of Access to Improved Sanitation.

| Variable | Due to differences in characteristics (E) |
Due to differences in coefficients (C) |
||
|---|---|---|---|---|
| Coefficient | % | Coefficient | % | |
| Region (Ref: Java) | ||||
| Sumatra | –0.1690 *** | –0.6284 | 2.5825 *** | 9.6009 |
| Bali & Nusa Tenggara | 0.0546 *** | 0.2029 | –0.0494 | –0.1838 |
| Kalimantan | 0.0164 *** | 0.0611 | 1.2203 *** | 4.5366 |
| Sulawesi | –0.1092*** | –0.4059 | –0.1986 * | –0.7382 |
| Maluku & Papua | 0.3048 *** | 1.1333 | –0.2305*** | –0.8567 |
| HH head has no civil registration number | 0.2162 *** | 0.8037 | 0.3286*** | 1.2216 |
| Female HH head | 0.0470 *** | 0.1749 | –0.3236 *** | –1.2030 |
| Age of HH head | 0.0012*** | –0.0045 | –5.7190 *** | –21.2610 |
| Marital status of HH head (Ref: married) | ||||
| Never married | –0.2273 *** | –0.8450 | –0.1587 *** | –0.5898 |
| Divorced/separated | –0.0382*** | –0.1422 | 0.0630* | 0.2343 |
| Widowed/widower | –0.0096 *** | –0.0357 | 0.1973* | 0.7335 |
| Number of families in dwelling (Ref: one) | ||||
| Two | –0.0391*** | –0.1452 | –1.3042*** | –4.8487 |
| Three or more | –0.1383 *** | –0.5143 | –0.2519 *** | –0.9364 |
| HH size | –0.0212 *** | –0.0789 | 3.8346 *** | 14.2560 |
| Number of U-5 children in HH (Ref: none) | ||||
| One | –0.0161 *** | –0.0600 | 0.0453 | 0.1684 |
| Two or more | –0.0005 *** | –0.0018 | 0.0113 | 0.0422 |
| Drinking water ladder (Ref: unimproved source) | ||||
| Improved source | 0.4629 *** | 1.7208 | –4.0940 *** | –15.2200 |
| Piped water | 0.1203 *** | 0.4472 | –0.4859 *** | –1.8063 |
| Energy source for lighting (Ref: Electricity from the State company) | ||||
| Electricity not from State company | 0.7480 *** | 2.7808 | 0.1859 * | 0.6909 |
| Not from electricity | 3.6214 *** | 13.4630 | –1.3931 *** | –5.1790 |
| House is self-owned | –0.0137*** | –5.0817 | 10.9880 *** | 40.8490 |
| Education of HH head (Ref: none) | ||||
| Primary school | –0.1307 *** | –0.4857 | –1.9700*** | –7.3236 |
| Junior high school | 0.0038 | 0.0141 | –0.4739*** | –1.7617 |
| Senior high school | 0.7610 *** | 2.8293 | –1.1738*** | –4.3637 |
| College or above | 0.1725*** | 0.6412 | –0.1056 *** | –0.3926 |
| Employment of HH head (Ref: unemployed) | ||||
| Self-employment | 0.3769 *** | 1.4011 | 0.5190 | 1.9296 |
| Paid-employment | 0.0923 | 0.3430 | 0.2094 | 0.7785 |
| Other-employment | –0.0002 | –0.0007 | 0.0512 ** | 0.1904 |
| Per capita HH expenditure (log) | 6.3065*** | 23.4450 | –25.7390*** | –95.6900 |
| Wealth index score | 2.0843*** | 7.7486 | 0.6220*** | 2.3123 |
Source. Authors’ calculation from the 2016 SUSENAS (National Socio-Economic Survey) data.
Note. The coefficients are multiplied by 100. HH = household; Ref = reference category.
Statistical significance denoted at *p < .1. **p < .05. ***p < .01.
Acknowledgements
We thank Statistics Indonesia for providing access to the 2016 SUSENAS datasets. An earlier version of this paper has been presented at the 2018 International Symposium of Public Health (ISOPH), Surabaya, Indonesia, on November 1, 2018.
Declaration of Conflicting Interests
The author(s) declared no potential conflicts of interest with respect to the research, authorship, and/or publication of this article.
Funding
The author(s) disclosed receipt of the following financial support for the research, authorship, and/or publication of this article: However, the National Institute of Health Research and Development (NIHRD) of the MoH, Republic of Indonesia, fully paid the article processing charge (APC) fee of this article.