
Abstract
The Expert Systems With Applications (ESWA) is a leading journal in the fields of computer science and engineering. Motivated by its outstanding performance, this paper seeks to develop a comprehensive overview of research activities in ESWA since its inception in 1990. In this regard, bibliometric techniques have been utilized to characterize the status quo, dynamics, and development trends of research patterns in ESWA. In doing so, the work used Scopus database as a source of data required. A data visualization software, visualization of similarities (VOS) viewer, was used to map the bibliographic material. The Scopus database yielded 12,254 documents published in ESWA from 105 countries with an average of 408 documents/year. The most productive country was Taiwan (2,069 documents; 17.0%). National Cheng Kung University, Taiwan, was the most productive institution (219 documents; 1.8%). The major topics which will continue to be active include genetic algorithms, data mining, neural networks, support vector machines, classification and machine learning, feature selection, particle swarm optimization, fuzzy logic, and clustering. The outcomes underline the significant growth of ESWA through time. The vitality of topics addressed in ESWA to solve real-world problems boosts the progress and advancements of knowledge in this journal.
Keywords
Introduction
The expert systems as reliable decision-making systems have a great potential in solving many problems that mostly entail a human expert. These systems are computational applications utilizing convenient logical reasoning with an intention of providing a subject-matter expertise to non-experts in a particular field (Roy et al., 2015). As a part of applied artificial intelligence, the expert systems have been developed in the mid of 1960s by the artificial intelligence community. The knowledge in expert systems are transferred from human experts to computers, stored and called upon by users for a particular advice (Shu-Hsien, 2005). The building of any expert system is based primarily on a deep knowledge of a specific subject area that can be acquired from specialties and experts in the subject area. The research in expert systems can be considered as one of the most flourishing areas of current research activities within artificial intelligence field (Wagner, 2017). Many applications of expert systems have been developed covering a vast range of complex problems domains (i.e., accounting, financial services, manufacturing, medicine, etc.) (Wagner, 2017). In association with the evolution of expert systems, many scientific journals have been emerged on this topic to report the developments and advancements in this regard.
The expert systems science and application community is increasing exponentially. This is evident by the large amount and high-quality research works on this topic. Many well-respected and influential journals are active in publishing relevant research. The Expert Systems With Applications (ESWA) journal published by Elsevier is one of the most prominent journals which are devoted to reporting the new research findings in the domain of expert systems and their applications. The scope of ESWA journal covers topics in relation to designing, development, testing, implementation, and/or management of expert and intelligent models and also to give executive guidelines to help in developing and managing these models (Elsevier, 2020). The main two subject areas covered by ESWA journal are computer science with artificial intelligence and computer science applications categories and engineering. In the field of artificial intelligence subject category, it is ranked in the 29th position, first quartile (Q1) of their subject categories as ordered by the SCImago Journal Rank (SJR, 2020b) indicator.
The ESWA journal is generally close to leading positions in most of the rankings in its domain. This is proved for a broad range of indicators comprising the article influence score, the five—year impact factor and the CiteScore. According to CiteScore rank offered by Scopus database, ESWA journal is ranked in the 5th position out of 275 sources in general engineering category (98th percentile), in the 31st position out of 567 sources in computer science applications category (94th percentile), and in the 14th position out of 190 sources in artificial intelligence category (92nd percentile) (Scopus, 2020). The impact factor of ESWA journal according to Journal Citation Reports 2020 issued by Thomson Reuters is 5.452. This factor, as a standard measure of the quality of journals, measures the average number of citations received in a particular year by papers published in the source during the two preceding years (Web of Science [WoS], 2020a). The ESWA journal was founded by Jay Liebowitz, University of Maryland University College in 1990. The current Editor in Chief is Binshan Lin, Louisiana State University in Shreveport.
Motivated by the evident impact of ESWA journal in the scientific community, this paper seeks to develop a bibliometric analysis of ESWA journal from the beginning of 1990 to the end of 2019. The objective is to characterize the major aspects of the journal in terms of most contributing countries, institutions, and authors to the knowledge in ESWA journal. Furthermore, to identify the most cited papers, sources that mostly cited works published in ESWA journal, the evolution of citation and the growth structure. A graphical visualization of the bibliographic items (i.e., bibliographic coupling, co-authorship, co-occurrence of keywords and co-citation analysis) is further presented. The tracking of the status and trends of research activities in ESWA journal will contribute to a better understanding of the scientific knowledge landscapes and their impacts in this influential journal. As a single journal study, this bibliometric study will develop a portrait of the examined journal. This will further indicate the productivity, quality, and maturity of the journal. Interested scholars will be able to recognize the orientation of research that the journal supports to disseminate (Kevin et al., 2017). As such, this type of studies conducted usually on journals regarded as important in its field. The assessment will track the impact, quality, ability of the journal being studied in diffusing knowledge, collaboration and authorship patterns, and its international standing (Kevin et al., 2017).
Materials and Methods
Bibliometric Methods
Bibliometric methods are quantitative and visual techniques or statistics used to characterize patterns of research (Niu et al., 2016). Furthermore, to summarize the status quo, dynamics, and development trends of a specific field of research, yielding consolidated ideas, directions, and guidance for future research activities. These methods can be applied over a wide range of contexts including research topics, sources, countries, and institutions (Merigó et al., 2017). In their nature, they are quantitative techniques but can be utilized to generate pronouncements related to qualitative characteristics (Wallin, 2005).
The focus of bibliometric methods is devoted to assess productivity and impact of research activities. These techniques are of high potential in providing valuable knowledgeable structures (Shukla et al., 2019). Bibliometric methods can be easily scaled from micro (i.e., institute level) to macro (i.e., world level) (Wallin, 2005). In the literature, many bibliometric studies have been used in a wide range of research areas including decision making (Shaher H. Zyoud & Fuchs-Hanusch, 2017a), clean production (L. Huang et al., 2020), medicine (Bokor-Billmann et al., 2020), climate change (Shaher H. Zyoud & Fuchs-Hanusch, 2020), environmental research (Sa’ed H. Zyoud et al., 2015; Shaher H. Zyoud et al., 2017; Shaher H. Zyoud & Zyoud, 2021), water and wastewater research (Shaher H. Zyoud et al., 2016; Shaher H. Zyoud & Fuchs-Hanusch, 2015, 2017b), and sustainable development (Prashar & Sunder, 2020).
There are several bibliometric studies conducted on journals that are close to the scope of ESWA journal including a bibliometric study to assess research activities in International Journal of Intelligent Systems (Merigó et al., 2017), a bibliometric analysis of publications and citations in Applied Soft Computing journal (Muhuri et al., 2018), a scientometric analysis of publications in International Journal of Neurocomputing (Janmaijaya et al., 2018), a bibliometric analysis of publications in Engineering Applications of Artificial Intelligence (Shukla et al., 2019), a bibliometric overview of the major publications and citation trends in Information Sciences journal (Merigó et al., 2018), a bibliometric analysis of publications in Knowledge-Based Systems journal (Cobo et al., 2015), a bibliometric overview of publications in European Journal of Operational Research (Laengle et al., 2017), and structure and citation landscapes of IEE Transactions on Fuzzy Systems journal (Yu et al., 2018).
The Strategy of Search and Incorporated Criteria
The Scopus database has been used to retrieve the documents of ESWA journal and all associated information required for this analysis. This database is among four well-known databases used commonly in conducting bibliometric analyses. These databases involve Google Scholar, WoS, PubMed, and Scopus (Falagas et al., 2008). The WoS and Scopus databases adopt specific guidelines in inclusion of selected sources (Martín-Martín et al., 2018). The major features that distinguish Scopus database from others include a higher flexibility with respect to awarding an inclusive overview over research scopes (Yataganbaba & Kurtbaş, 2016), and a robust functions that support further assessments over collected information.
As a prerequisite to source and compile the data required for this assessment, all subjects’ domains in Scopus database have been considered. This includes social, health, life, and physical sciences. The types of documents examined in this analysis were articles and reviews. The other types of documents (i.e., conference paper; erratum; editorial; note, letter, short survey; conference review, retracted and undefined) have been excluded. The timeframe of collected data was bounded by a period of 30 years extended from 1990 (the year of launching ESWA journal) to the end of 2019. Because of the continuous updating of Scopus database, the procedure of search and collection of all required data and relevant material has been done at once. The published works in ESWA journal beyond December 31, 2019, are excluded because of unlocking of this period for new works.
In the advanced search within Scopus database, the query string utilized in this analysis was as follows: SRCTITLE (“Expert Systems with applications”) AND PUBYEAR < 2020 AND (LIMIT-TO (EXACTSRCTITLE, “Expert Systems with Applications”)) AND (EXCLUDE (DOCTYPE,“cp”) OR EXCLUDE (DOCTYPE,“er”) OR EXCLUDE (DOCTYPE,“ed”) OR EXCLUDE (DOCTYPE,“sh”) OR EXCLUDE (DOCTYPE,“no”) OR EXCLUDE (DOCTYPE,“le”) OR EXCLUDE (DOCTYPE,“cr”) OR EXCLUDE (DOCTYPE,“tb”) OR EXCLUDE (DOCTYPE,“Undefined”)). The following codes in the query string (cp: conference paper; er: erratum; ed: editorial; sh: short survey; no: note; le: letter, cr: conference review) referred to skipped items. The search query was performed on January 1, 2020.
Extraction of Bibliometric Indicators and Statistical Analysis
All data drawn from Scopus database have been exported to Excel spreadsheets for further analyses. The major exported data comprise the name of the source, sources that mostly cited works from ESWA journal, fields of interest, contributed countries, institutions and authors, evolution of growth rates of publications, and the development of citation rates with time. The number of published documents has been used as an indicator of research productivity (quantitative indicator). This indicator has been assessed for countries, institutions, and authors. On the other hand, the impact of published works was assessed based on citation rates, their average, median, and interquartile ranges (qualitative indicators). The aforementioned descriptive statistics have been calculated using SPSS program. The SigmaPlot 14.5 software is used to model the evolution of publications in ESWA journal with time and to model the prediction and confidence bands.
The Hirsch index (h-index), as an indicator of qualifying the productivity of sources, authors, countries, institutions, and so on, has been used in this analysis. This indicator merges the productivity (quantity) and citation rates (quality) and can be interpreted as the number of research works produced by either countries, authors, sources, or institutions, which have a number of citations equal to or greater than h (Hirsch, 2005). The chief advantage of this indicator lies in its potential in identifying the significance and the broad impact of the cumulative research contributions. Furthermore, the assessment of performance of research from qualitative prospect (Meho & Rogers, 2008). To state its notion when it is applied over research works produced by a specific journal, it is right to say that this journal with an h-index of 100, if this is the case as an example, has 100 documents and every document has gathered at the time of the assessment at least 100 citations. The standard competition ranking (SCR) code was utilized in ranking the most productive authors, countries, institutions, and the top-cited works. These items have been ranked in descending order. In a case of identical ranking for two or more items, a gap is left for the following ranking numbers.
Several journal metrics are presented and discussed. These metrics are mainly used to assess journal ranking, importance, and impact. A variety of journal metrics have been created more recently, including CiteScore, Impact factor, Source Normalized Impact per Paper (SNIP), and SJR. CiteScore measures the average citations received per peer-reviewed documents published in a specific journal (Elsevier, 2020). The values of CiteScore are based on citation counts in arrange of 4 years to peer-reviewed documents published in the same 4 years, divided by the number of these documents in the same 4 years (Elsevier, 2020). The SNIP measures contextual citation impact by weighting citations based on the total number of citations in a subject field, while SJR is a prestige metrics. It is based on the idea that not all citations are the same (Elsevier, 2020).
Visualization Mapping, Clustering Techniques, and Analysis of Word Frequency
The visualization maps have been generated using VOSviewer software (van Eck & Waltman, 2010). This software utilizes clustering techniques and similarity mapping. The VOSviewer program can be used to establish bibliometric maps of authors or sources based on co-citation information. Moreover, it is possible to establish keywords maps (i.e., author keywords, index keywords or author and index keywords at a once time) based on co-occurrence of keywords (van Eck & Waltman, 2010).
In terms of research collaboration (i.e., collaboration between countries), the VOSviewer is able to create two-dimension distance-based maps. On these maps, the distance between two countries is an indicator to the strength of research collaboration between them (van Eck & Waltman, 2010). The closer the distance between the two countries, the more common research activities between them (Bornmann, 2016).
To assess the contents of published research in ESWA journal, an analysis of word frequency and co-occurrence keyword analysis is being proposed. This is due to the fact that the core words elucidate the hub of research activities and the core of the literature (L. Wang et al., 2017). For different research works, the co-occurrence of keywords analysis helps in recognizing the associations and links between the ideas and concepts of these works. Furthermore, the hot topics of research which will continue to be active in the future works can be identified. For research works published as a result of collaboration, co-citation, and co-occurrence analyses, a threshold was applied to right visualizing the networks (Aleixandre-Benavent et al., 2017).
Results and Discussion
This study seeks to derive and assess various bibliometric performance indicators in relation to research output of ESWA journal. To demonstrate a detailed assessment of knowledge landscapes in this journal from bibliometric overview, the following sections have been regarded as essential to realize the objectives of this assessment.
Evolution of Publications in ESWA Journal
The total number of research works retrieved from Scopus database and published in ESWA journal along a period of time of about 30 years (from the beginning of 1990 to the end of 2019) was 12,573 documents. These documents are distributed, in terms of their types, as follows: article (12,090; 96.2%), review (164; 1.3%), conference paper (133; 1.1%), Erratum (123; 1.0%), editorial (41; 0.3%), short survey (9; 0.07%), note (8; 0.06%), letter (2; 0.02%), conference review (1; 0.01%), retracted (1; 0.01%), and undefined (1; 0.01%). The center of interest of this work is concentrated on articles and reviews (12254 documents; 97.5%). The larger part of these works was articles followed by a large margin by reviews.
The average number of publications was 408 documents/year. The lowest productivity was in 1990, at the time of launching ESWA journal (37 documents), while the highest number of publications was recorded in 2011 (1692 documents). The ESWA journal experienced a breakthrough in the number of publications since 2008, where 87.0% of the total documents have been published (Figure 1A). The years 2009, 2010, 2011, and 2012 witnessed a remarkable increase in research activities in ESWA journal, but from then onward and up to the end of 2019, a stable productivity situation is predominant. The Sigmoidal model equation with five parameters (Figure 1B), in which the dependent variable was the accumulative annual number of documents and the independent variable was the year published, was used to assess the trends of growth of publications. The coefficient of determination (r2) of such model was 0.9958. The model displays different phases of growth (i.e., the first phase of slow growth extends from 1990 to 2007, the second phase of exponential growth extends from 2008 to 2012, while the stationary phase extends from 2013 to end of 2019). The model predicts a stable development in the number of publications to the end of the tested period; 2020–2025. The decline in the number of publications after 2012 could be linked to the following fact: publishing reasonable number of quality papers that could receive more citations will be of advantage in improving the impact factor of this journal. By reviewing the impact factor of ESWA with time, it is noticed that the impact factor during the phase of exponential growth was relatively low (i.e., IF 2011: 2.203, IF 2012: 1.854, IF 2013: 1.965) compared with its impact factor during the phase of stable and reasonable number of publications (i.e., IF 2016: 3.928, IF 2017: 3.768, IF 2018: 4.292, IF 2019: 5.452) (Bioxbio, 2020). This is because the impact factor is calculated based on the average number of citations received in a particular year by papers published in the journal during the two preceding years. Furthermore, the presence of different active expert systems journals recently contributed to distributing the related research in different sources. This has surely affected the portion of ESWA journal. The first research article in ESWA journal was titled “Decision-theoretic approach to a knowledge-based clinical system” (J. K. Kim et al., 1990). In this article, authors have developed a knowledge-based clinical system to consult disease treatment (J. K. Kim et al., 1990). The ESWA journal started with one volume of four issues in 1990 and reached 24 volumes for 2019 year.

(A) Evolution of publications in Expert Systems With Applications journal with time (from the beginning of 1990 to the end of 2019). (B) Accumulative publications and the predicted publications to the end of 2025.
Distribution of Publications in ESWA Journal by Regions and Countries Across the Globe
By examining the contributions of regions across the globe toward knowledge in ESWA journal, the most productive region was Asiatic region. This region has produced 6,530 documents by 18 countries. This figure represents 53.3% of total global research productivity. It is followed by Western Europe (3,310 documents from 19 countries; 27.0%), Northern America (1,735 documents from two countries; 14.2%), Middle East region (1,668 documents from 14 countries; 13.6%), Latin America (893 documents from 18 countries; 7.3%), Eastern Europe (518 documents from 20 countries; 4.2%), Pacific region (374 documents from 2 countries; 3.1%), and Africa region (136 documents from 12 countries; 1.1%).
There were 105 countries throughout the globe engaged in research activities in ESWA journal. The worldwide view of the research output of countries from the beginning of 1990 to the end of 2019 is displayed in Figure 2. The map shows countries that had distinguished, average and modest achievements. The analysis of the major bibliometric performance indicators for the most productive countries (the top twenty countries) is displayed in Table 1. The analyzed items for each country include the amount of publications, percentage of publications, total citations, median and average of collected citations, h-index associated with publications, the top collaborator country with each country, and the amount of publications from research collaboration.

Nation-level production in Expert Systems With Applications journal; Worldwide view of the research output of countries from the beginning of 1990 to the end of 2019.
Top Productive Countries That Have Outstanding Contributions in the Expert Systems With Applications Journal and Their Major Bibliometric Performance Indicators.

Note. SCR = Standard Competition Ranking; Q1–Q3 = lower quartile–upper quartile.
Equal countries have the same ranking number, and then a gap is left in the ranking numbers. bPercentage of documents/ country out of the total published research. cFor the small number of articles, the interquartile range was not available. dPercentage of documents with international authors out of the total number of documents for each country. ePercentage of documents with most collaborated country out of the total number of documents for each country.
Table 1 shows a marked achievement by Taiwan, at countries’ level, in terms of research productivity (2069 documents; 17.0% of total global productivity). It is followed by China (1,777 documents; 14.5%), United States (1,319 documents; 10.8%), and Spain (1,095 documents; 9.0%). In this list, seven countries out of 20 top productive countries were from Asiatic region (Taiwan, China, South Korea, India, Hong Kong, Malaysia and Singapore), six from Western Europe (Spain, United Kingdom, Italy, France, Greece and Belgium), two from Northern America (United States and Canada), two from Middle East (Turkey and Iran), two from Latin America (Brazil and Mexico), and one from Pacific region (Australia).
In terms of research impact, at time of data analysis, Taiwan recorded the highest h-index (113), followed by China (100), Turkey (99), United States (80), South Korea (79), and India (75). Taiwan, as well, collected the highest number of citations (79016). It is followed by China (58071), Turkey (40922), United States (34030), South Korea (31789), Spain (24247), and India (20863). Turkey recorded the highest average of citations (49), followed by Taiwan (38.2), Iran (38), Malaysia (37.8), and Greece (36). In terms of collaboration between countries, United Kingdom was the top collaborator as it had joined research activities with 59 countries. It is followed, respectively, by United States, Spain, China, and Canada.
The collaborated countries are shown in a space of two dimensions (Figure 3). Basically, the closer countries to each other in the space, the higher rates of research collaboration between them. The node size is an indicator of the contribution of countries in terms of co-authorship and collaboration (i.e., the larger the node is in association with the higher contribution). Moreover, countries with frequent collaboration are allocated to specific clusters. The minimum number of documents/country was set as 30 documents and 44 countries met this threshold. There are 437 links between the collaborated countries with a total strength of 2,964. The United States and United Kingdom had the highest number of links (38 links for each of them). They are followed by China with 33 links. The highest links strength was recorded for China (855), followed by United States (797). The strongest link strength was between United States and China (213), followed by the link strength between China and Hong Kong (164). According to “Nature Index” (2020), authors from China collaborated with authors from United States more often than in any other region. The 44 countries are categorized into five clusters with distinct colors. The first cluster, red color, includes 20 countries, the green cluster includes 14 countries, the blue cluster includes four countries, the yellow cluster includes four countries, and the purple cluster includes one country. The importance of international research collaboration stems from its powerful in yielding high impact research based on complementary expertise (Havemann et al., 2006).

Network visualization map for country collaboration.
The bibliographical coupling between countries is shown in Figure 4. For documents as a clarification, the bibliographical coupling represents a link between the documents which are citing the same publication. Accordingly, it is a combined association between any two identities (identities like countries, institutions, etc.). The map categorized countries into four clusters. The countries in each cluster have more joined works with each other. The red cluster includes 17 countries (Spain in the core of this cluster), and the strongest link is the one between Spain and United Kingdom (2451). The green cluster includes nine countries (Turkey in the core of this cluster), and the strongest link is the one between Canada and China (2221). The blue cluster includes four countries (Taiwan in the core of this cluster), and the strongest link is the one between China and United States (31235). The yellow cluster includes one country (Greece), and the strongest link is the one between Greece and United Kingdom (714). The core countries are ones with the largest number of documents in their clusters.

Network visualization map of bibliographical coupling between countries.
Distribution of Sources Which Mostly Cited Publications From ESWA Journal and Co-Citation Analysis
The ranking of top 20 sources that mostly cited documents from ESWA journal is displayed in Table 2. The ESWA journal itself is on the top of the list (20,599 documents). It is followed by Lecture Notes in Computer Science Including Subseries Lecture Notes in Artificial Intelligence and Lecture Notes in Bioinformatics (8,046 documents), Applied Soft Computing (4,663 documents), Advances in Intelligent Systems and Computing (3,777 documents), Knowledge-Based Systems (2,769 documents), and IEEE Access (2,677 documents). The majority of listed journals are having official impact factors as documented in Journal Citation Reports (JCR); 2020 edition released by Thomson and Reuters (twenty sources out of thirty have impact factors), and considered as prestigious sources in their fields of research. This reveals the importance of topics included in ESWA journal for the scientific community. Most of these journals are published by recognized publishers (i.e., Springer, Elsevier, etc.).
Top Sources That Mostly Cited Documents From Expert Systems With Applications Journal.
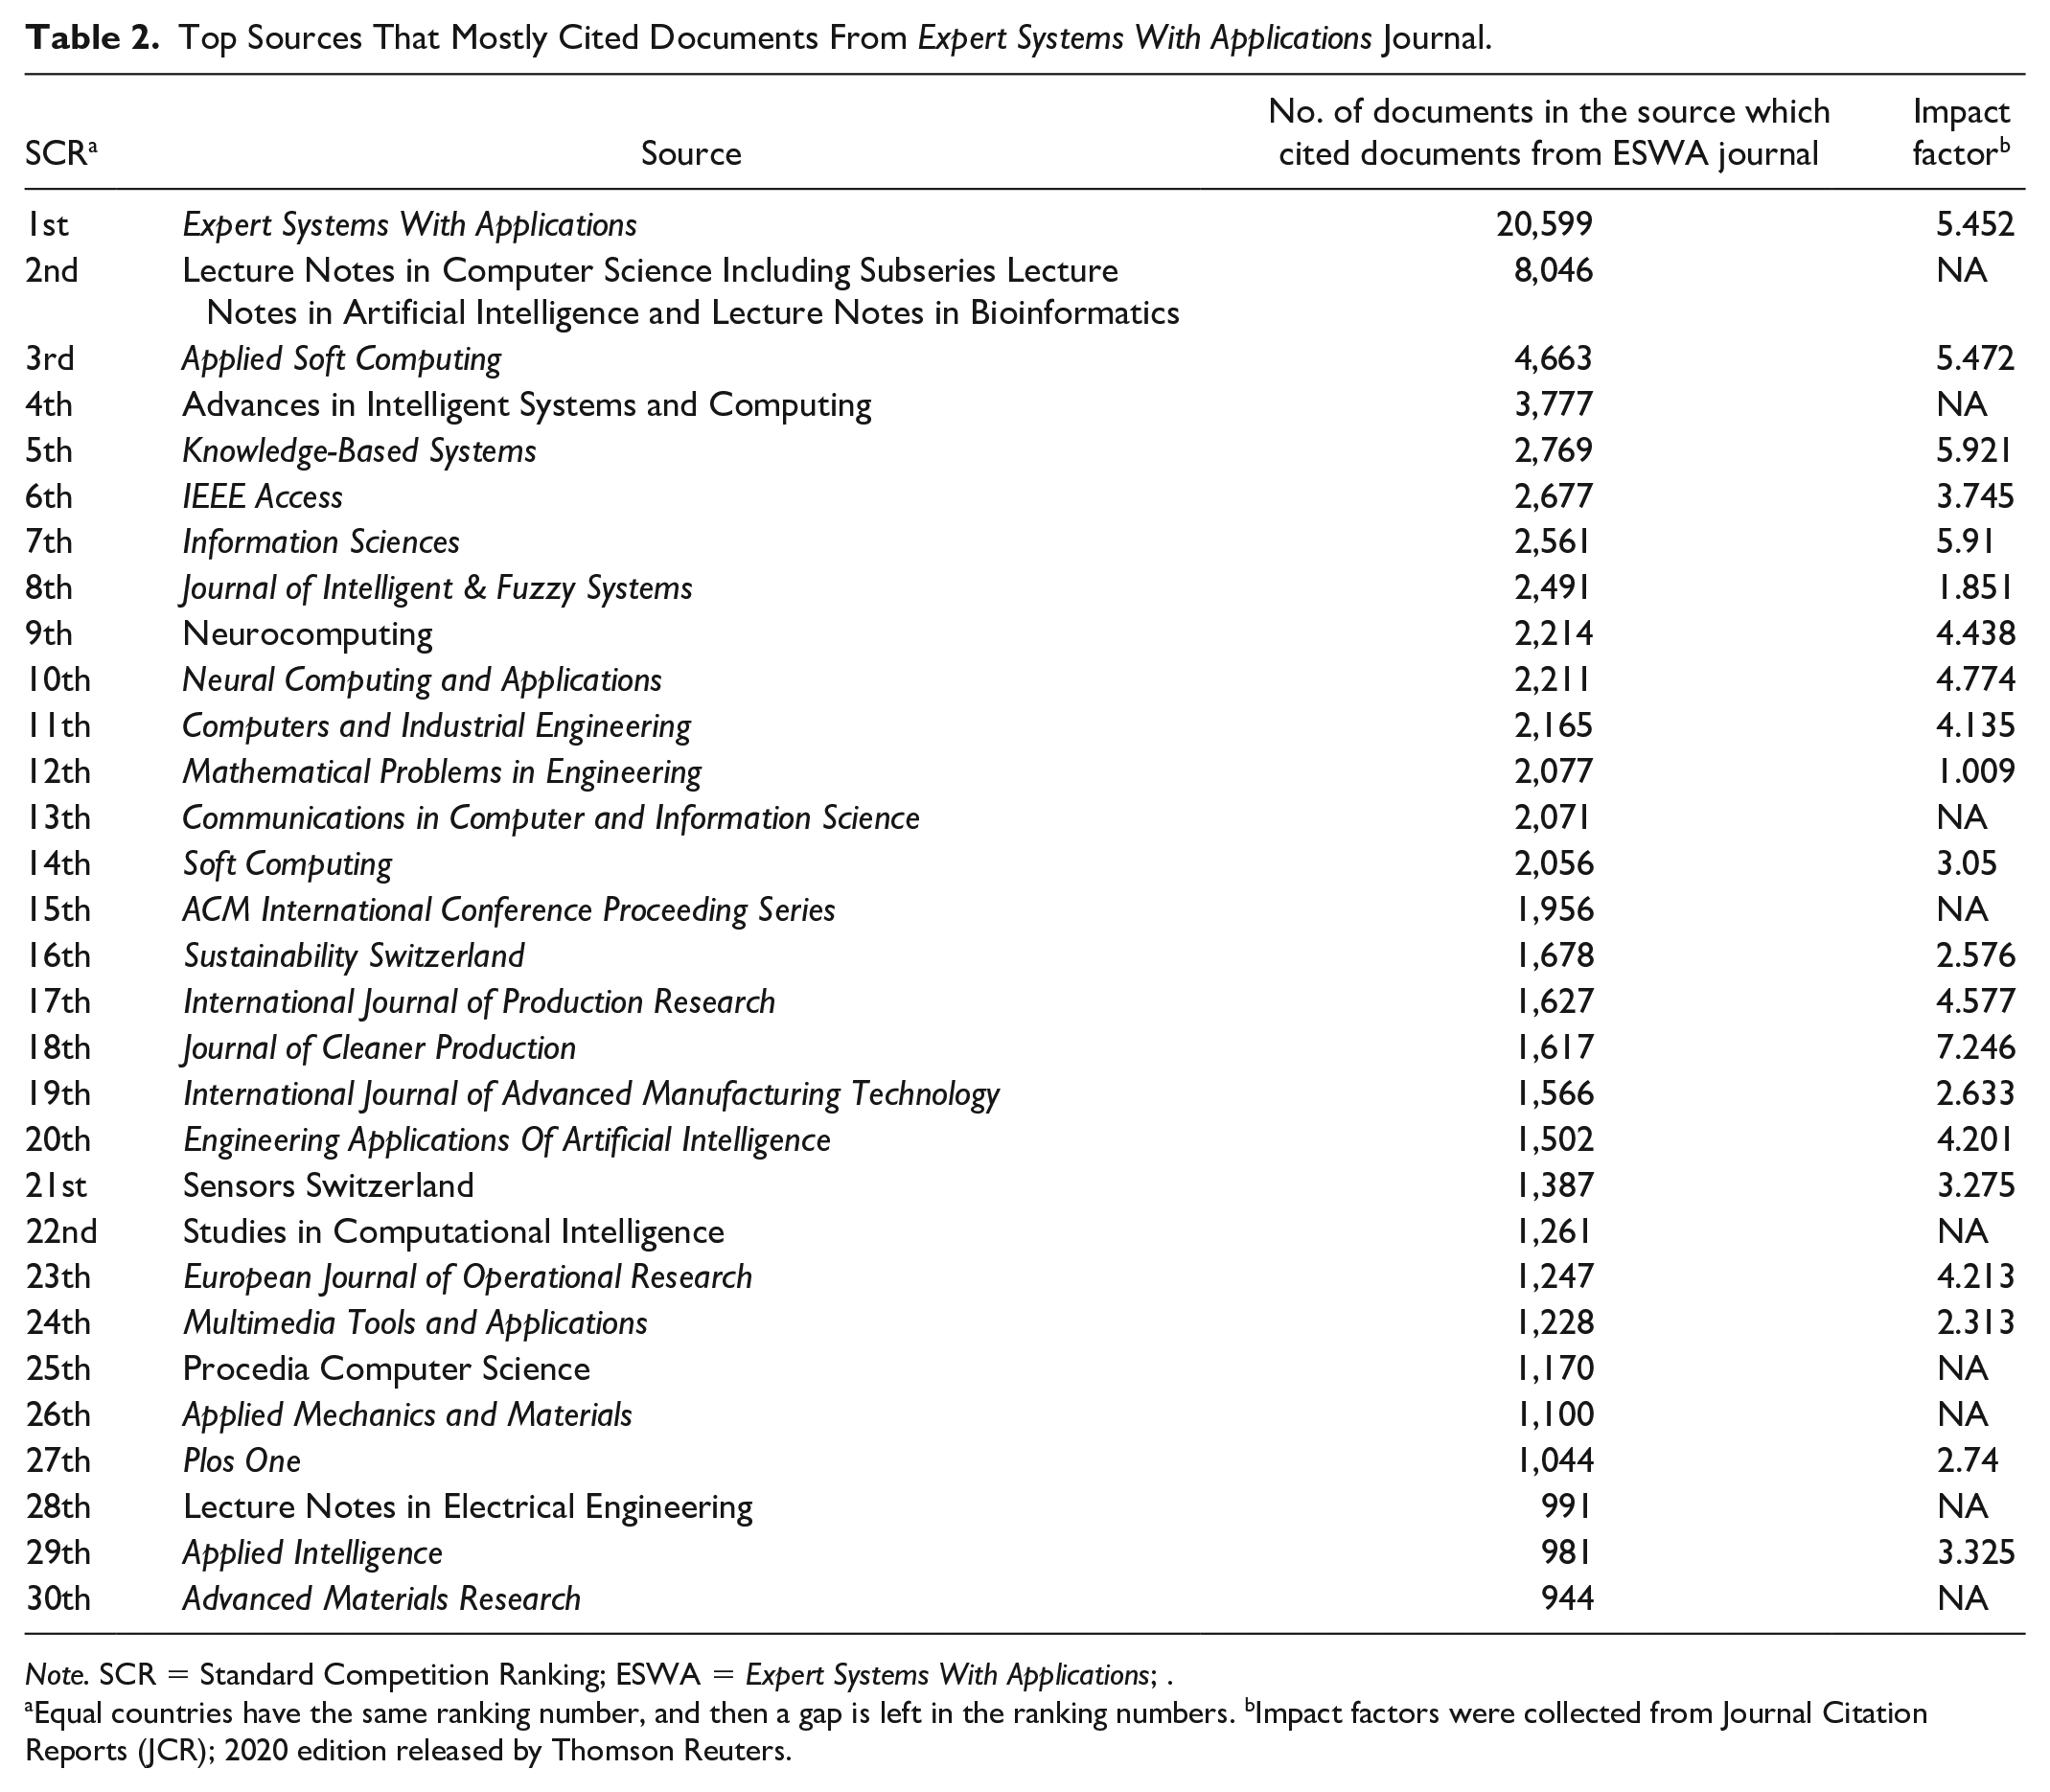
Note. SCR = Standard Competition Ranking; ESWA = Expert Systems With Applications; .
Equal countries have the same ranking number, and then a gap is left in the ranking numbers. bImpact factors were collected from Journal Citation Reports (JCR); 2020 edition released by Thomson Reuters.
The list includes major series and proceedings such as Lecture Notes in Computer Science Including Subseries Lecture Notes in Artificial Intelligence and Lecture Notes in Bioinformatics (Springer), Advances in Intelligent Systems and Computing (Springer), Communications in Computer and Information Science (Springer), ACM International Conference Proceeding Series (Association for Computing Machinery), Procedia Computer Science (Elsevier), Studies in Computational Intelligence (Springer), and Lecture Notes in Electrical Engineering (Springer). The aforementioned series and proceedings are, mainly, devoted to document the developments on theory, applications and design methods of intelligent systems and intelligent computing in all disciplines.
The network visualization map based on co-citation analysis of published documents in ESWA journal and publications in other sources are displayed in Figure 5. The benefit of co-citation analysis is in clustering the sources with major interconnections. The minimum number of citations for each source was set as 1,000. Out of 112,831 sources, 30 matched the proposed threshold. There were 435 links between the sources with a total links strength of 495,683. The ESWA journal was in the core of the map as it is the reference in this regard. Sources with high rates of co-citations, in addition to ESWA journal, are with larger nodes (i.e., European Journal of Operational Research, Fuzzy Sets and Systems, Information Sciences, and Pattern Recognition). The strongest link strength was between ESWA journal and European Journal of Operational Research (33822). It is followed by the link between ESWA journal and Information Sciences (15,676), and the link between ESWA journal and Applied Soft Computing (13293). The map categorized the sources into three clusters. The red cluster includes 15 sources, the green cluster includes eight sources, and the blue cluster includes seven sources.

Network visualization map of top journals based on co-citation analysis.
The Major Institutions With Outstanding Contributions Toward Knowledge in ESWA Journal
The major bibliometric performance indicators of the most productive institutions at global level in ESWA journal are displayed in Table 3. National Cheng Kung University, Taiwan, was at the top of the list (219 documents; 1.8%). It is followed by Hong Kong Polytechnic University, Hong Kong (193 documents; 1.6%), National Taiwan University of Science and Technology, Taiwan (189; 1.5%), and National Chiao Tung University Taiwan, Taiwan (188 documents; 1.5%). Fifteen institutions out of 20 most productive ones are from Asiatic region (six institutions from Taiwan; four from South Korea; two from each of China and Hong Kong, and one from Singapore). The highest h-index (54) and the high rates of citations (8561) were recorded by National Taiwan University of Science and Technology, Taiwan. The highest average of citations was recorded by National Kaohsiung University of Science and Technology, Taiwan (56.6), while the highest median (interquartile range) was recorded by Firat Üniversitesi, Turkey (40.5 [21.5–70.25]). The significant productivity of Taiwan’s institutions is largely linked to the presence of a group of active researchers in fields of research in relation to expert systems from Taiwan. This is clarified in the next subsection.
Top Productive Institutions That Have Outstanding Contributions in Expert Systems With Applications Journal and Their Major Bibliometric Performance Indicators.

Note. SCR = Standard Competition Ranking; Q1–Q3 = lower quartile–upper quartile.
Equal institutions have the same ranking number, and then a gap is left in the ranking numbers. bPercentage of documents/ institution out of the total published research. ch-index is related to published research by each institution in Expert Systems With Applications journal. dFor the small number of articles, the interquartile range was not available.
The Most Prolific Authors With Outstanding Contributions Toward Knowledge in ESWA Journal
The list of top prolific authors is presented in Table 4. The active authors represent the cornerstone and the chief support of any journal. The top prolific author is Chen, S.M., National Taiwan University of Science and Technology, Taipei, Taiwan (53 documents). In this list, there are six authors from Taiwan, four authors from each of South Korea and Hong Kong, three authors from Turkey, two authors from Italy, and one author from each of Canada, China, Belgium, Australia, and Singapore. The highest h-index (31), and the highest number of citations (3,211) for the most prolific authors were recorded to the benefit of Chen, S.M., National Taiwan University of Science and Technology, Taipei, Taiwan. The highest average of citations (97) was recorded for Han, I., Korea Advanced Institute of Science & Technology, Yusong, South Korea. While, the highest median (interquartile range) (78.5 [35–118.25]) was recorded for publications of Kahraman, C., Istanbul Teknik Üniversitesi, Istanbul, Turkey.
Top Prolific Authors Who Have Outstanding Contributions in Expert Systems With Applications Journal and Their Major Bibliometric Performance Indicators.

Note. SCR = Standard Competition Ranking; ESWA = Expert Systems With Applications; Q1–Q3 = lower quartile–upper quartile.
Equal authors have the same ranking number, and then a gap is left in the ranking numbers. b Percentage of documents/ author out of the total published research.
The co-authorship is a type of scientific collaboration between scholars in a specific field of research. The co-authorship analysis provides a clear vision of cooperation patterns between researchers (Fonseca et al., 2016). The network visualization map of co-authorship analysis is displayed in Figure 6. The map categorized authors into five clusters. The first cluster (red one) includes eight authors, the second cluster (green one) includes eight authors, the third cluster (blue one) includes four authors, the fourth cluster (yellow one) includes three authors, and the fifth cluster (purple one) includes two authors. The total number of links is 81, and the total link strength is 126. The strongest link (7) was between Wang H. and Wang S. in Cluster 4. The strongest link was recorded to the benefit of Liu Y in Cluster 1 (21). This author has the largest number of links with other authors (14), and the largest number of documents (68).

Network visualization map of co-authorship analysis.
Analysis of Citation Trends and Most Cited Publications in ESWA Journal
The number of citations the document had received is among the most well-known bibliometric performance indicators in assessing the quality of published works. The total number of citations the documents published in ESWA journal had received at the time of data collection (January 1, 2020) was 378,576 citations. The h-index associated with 12,254 documents published in ESWA journal during the examined period was 184. This means that of the 12,254 documents considered for the h-index, 184 documents have been cited at least 184 times. The average citation was 31, while the median (interquartile range) was 17 (7–37). The exponential model (Figure 7A and 7B), in which the dependent variable was the accumulative citations, and the independent variable was the period used to assess the trends of evolution of citations. The coefficient of determination (r2) of the model including the year 2020 was 0.963 (Figure 7A). While the coefficient of determination (r2) of the model excluding the year 2020 was 0.9982 (Figure 7B). This is attributed to the fact that the year 2020 is at its beginning and it is open for new citations. There is a clear harmony between the total citations and the number of documents published in each year in terms of their trends (Figure 7C). This is true for the period extended from 1990 to 2015. Generally speaking, this is because documents published many years ago will likely to be cited more times than a recently published documents. Figure 8 displays the boxplot representation of evolution of citations collected to the benefit of documents which have been published every year within the period of analysis. The highest average of citations was achieved for documents published in 2002 (66.2), while the highest median (39) was recorded for published documents in 2002 and 2007.
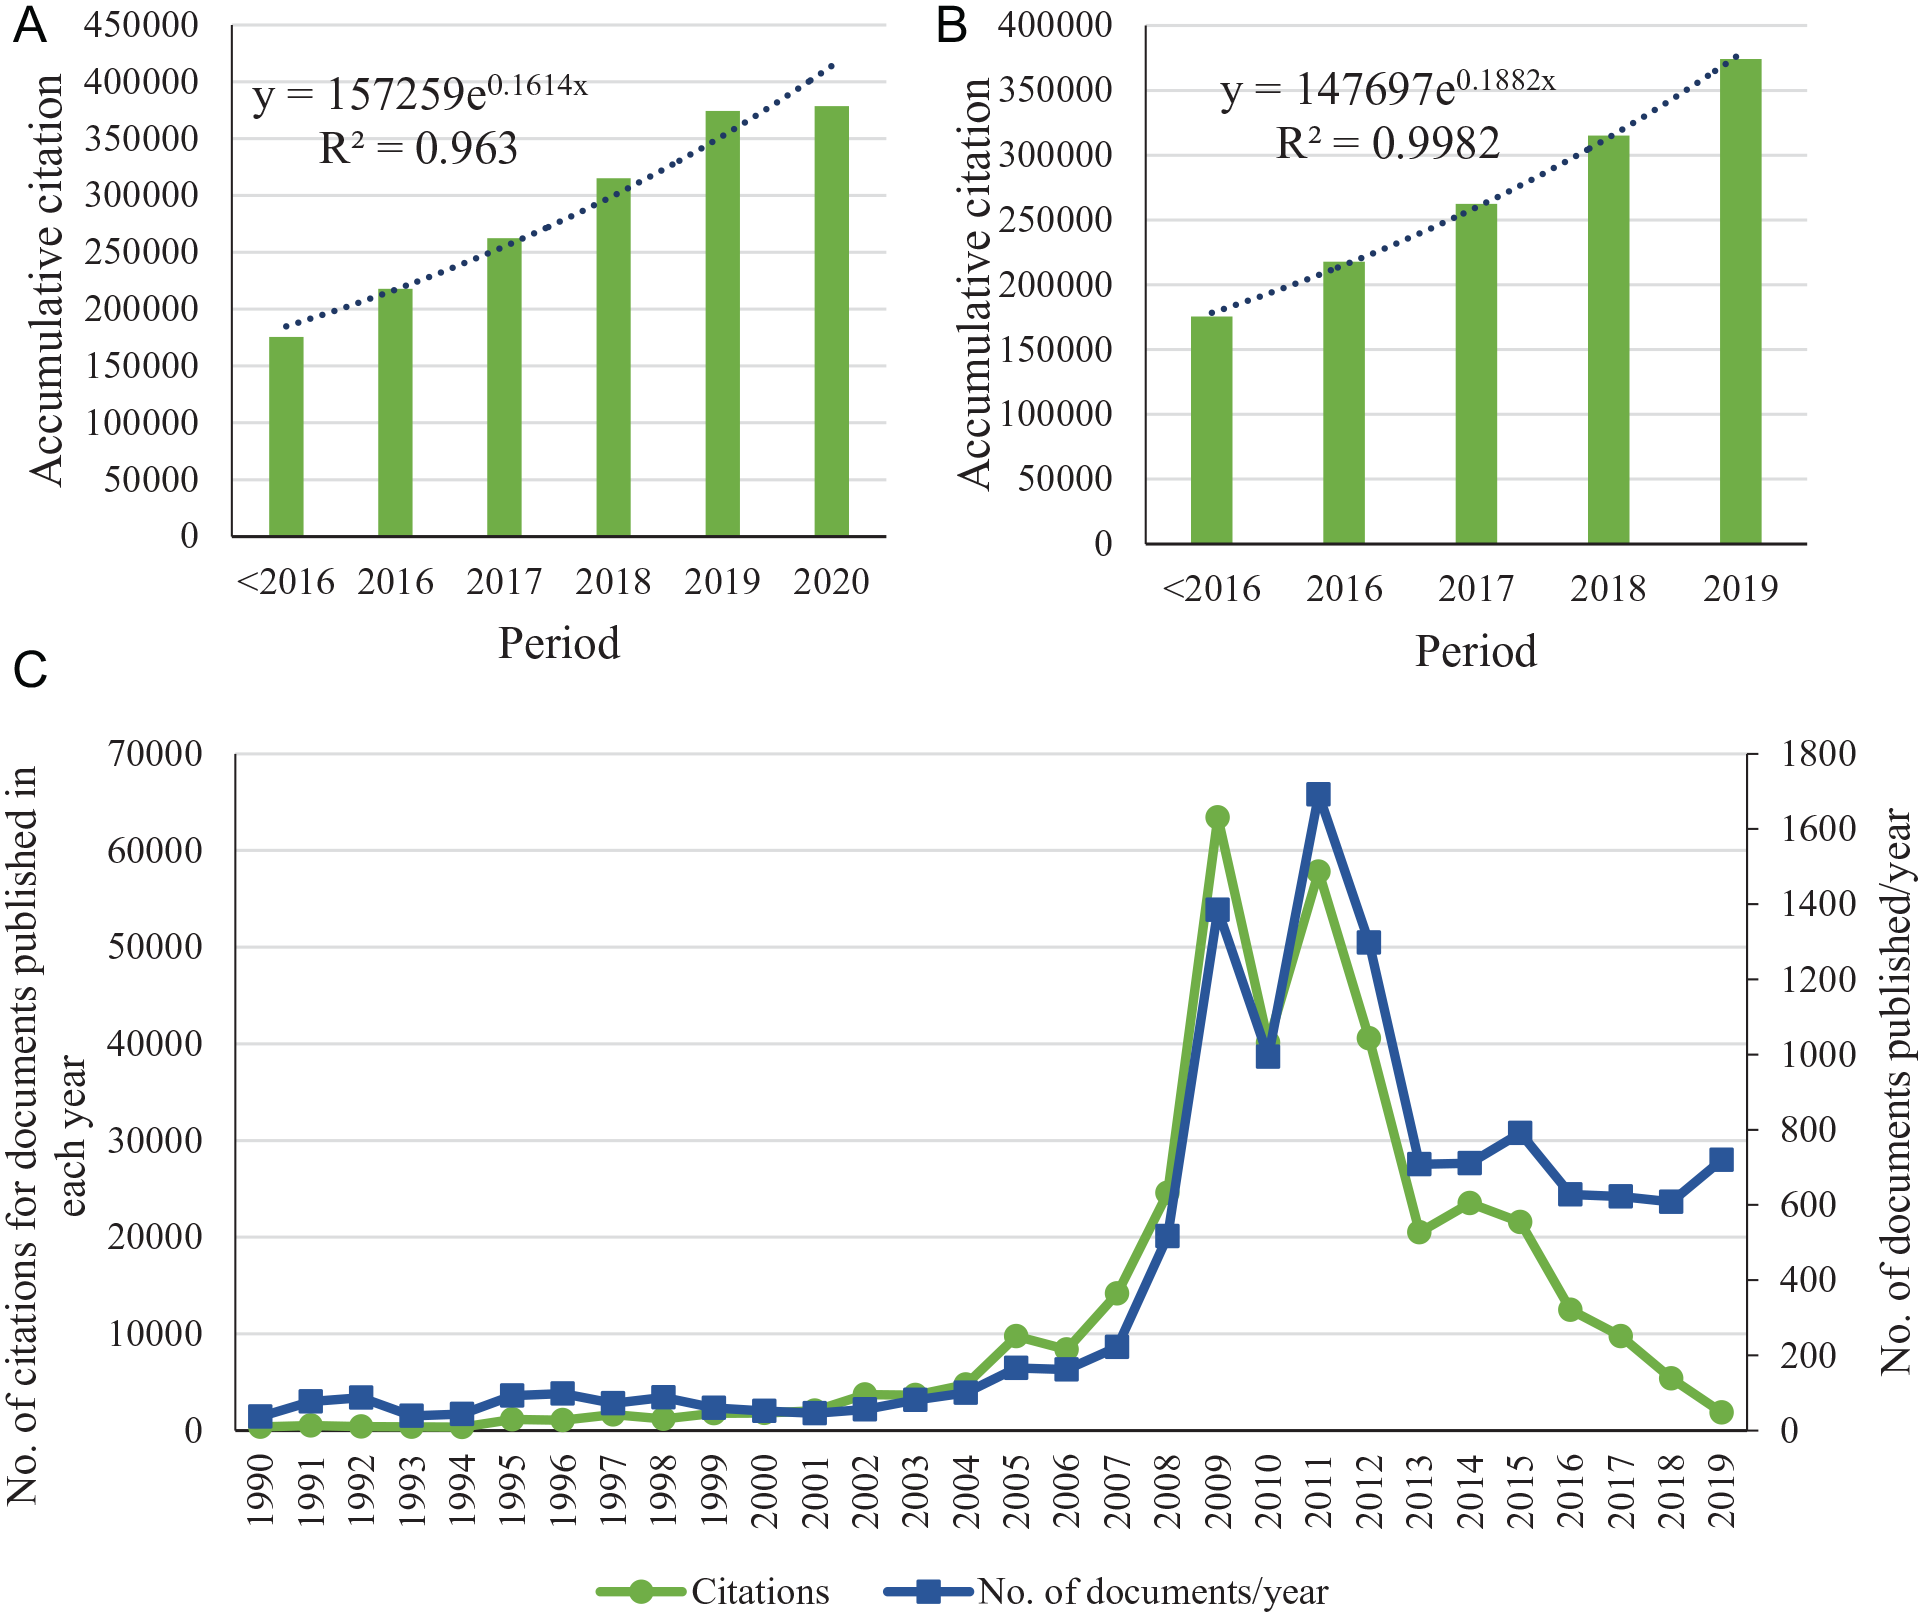
Evolution of citations for the published documents in Expert Systems With Applications Journal: (A) Evolution of citations included year 2020, (B) evolution of citations excluded year 2020, (C) number of citations of documents published in each year.
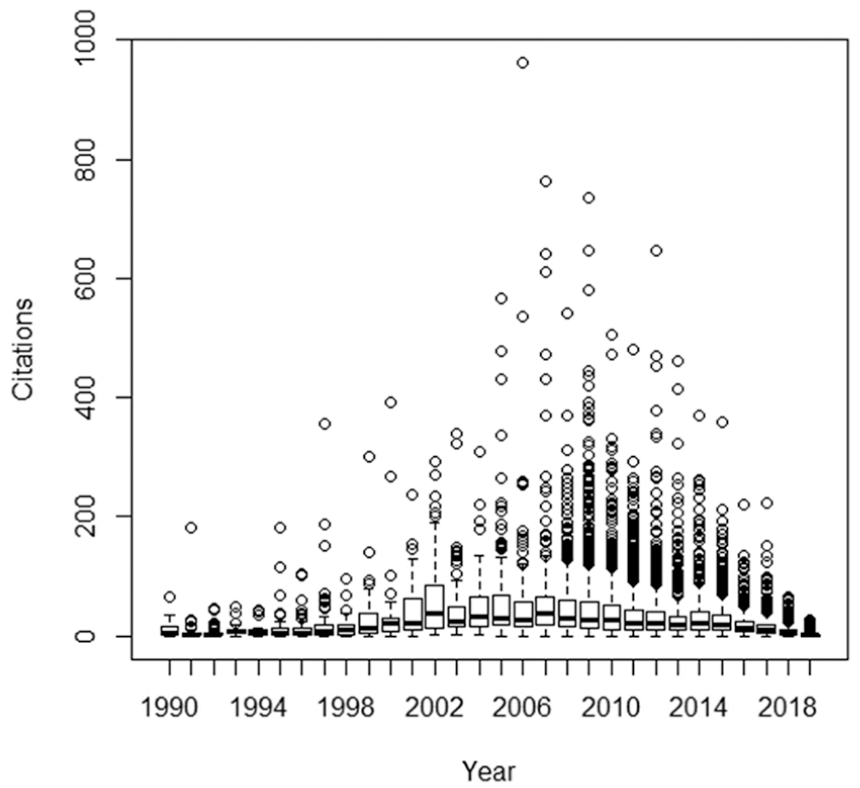
Boxplot representation of evolution of citations collected to the benefit of documents which have been published every year within the period of study (from 1990 to the end of 2019).
The top 50 cited documents (articles and reviews) are displayed in Table 5 (Akay, 2009; Alatas, 2010; Arun Kumar & Gopal, 2009; Atsalakis & Valavanis, 2009; Behzadian et al., 2012; Boran et al., 2009; Büyüközkan & Ifi, 2012; Celebi et al., 2013; Chai et al., 2013; Daǧdeviren et al., 2009; Güler et al., 2005; Hong et al., 2009; C. L. Huang et al., 2007; C. L. Huang & Wang, 2006; Ishizaka & Labib, 2011; Kayacan et al., 2010; K. J. Kim & Han, 2000; Lee et al., 2008, 2009; Liao, 2003, 2005; Liao et al., 2012; C. Lin et al., 2014; S. W. Lin et al., 2008; Liu et al., 2013; Mardani et al., 2015; Min & Lee, 2005; Ngai et al., 2009; Ocak, 2009; Paliwal & Kumar, 2009; D. H. Park et al., 2012; H. S. Park & Jun, 2009; Phinyomark et al., 2012; Romero & Ventura, 2007; Ryu et al., 2003; Sanayei et al., 2010; Shaw et al., 2012; Shin et al., 2005; Subasi, 2007; Subasi & Gursoy, 2010; Tsai et al., 2009; Tzeng et al., 2007; T. C. Wang & Chang, 2007; Y. M. Wang & Elhag, 2006; Y. M. Wang et al., 2009; T. C. Wang & Lee, 2009; Wei, 2010; Wiig, 1997; Wu & Lee, 2007; Ye et al., 2009).
Top Fifty Most Cited Documents in Expert Systems With Applications Journal.
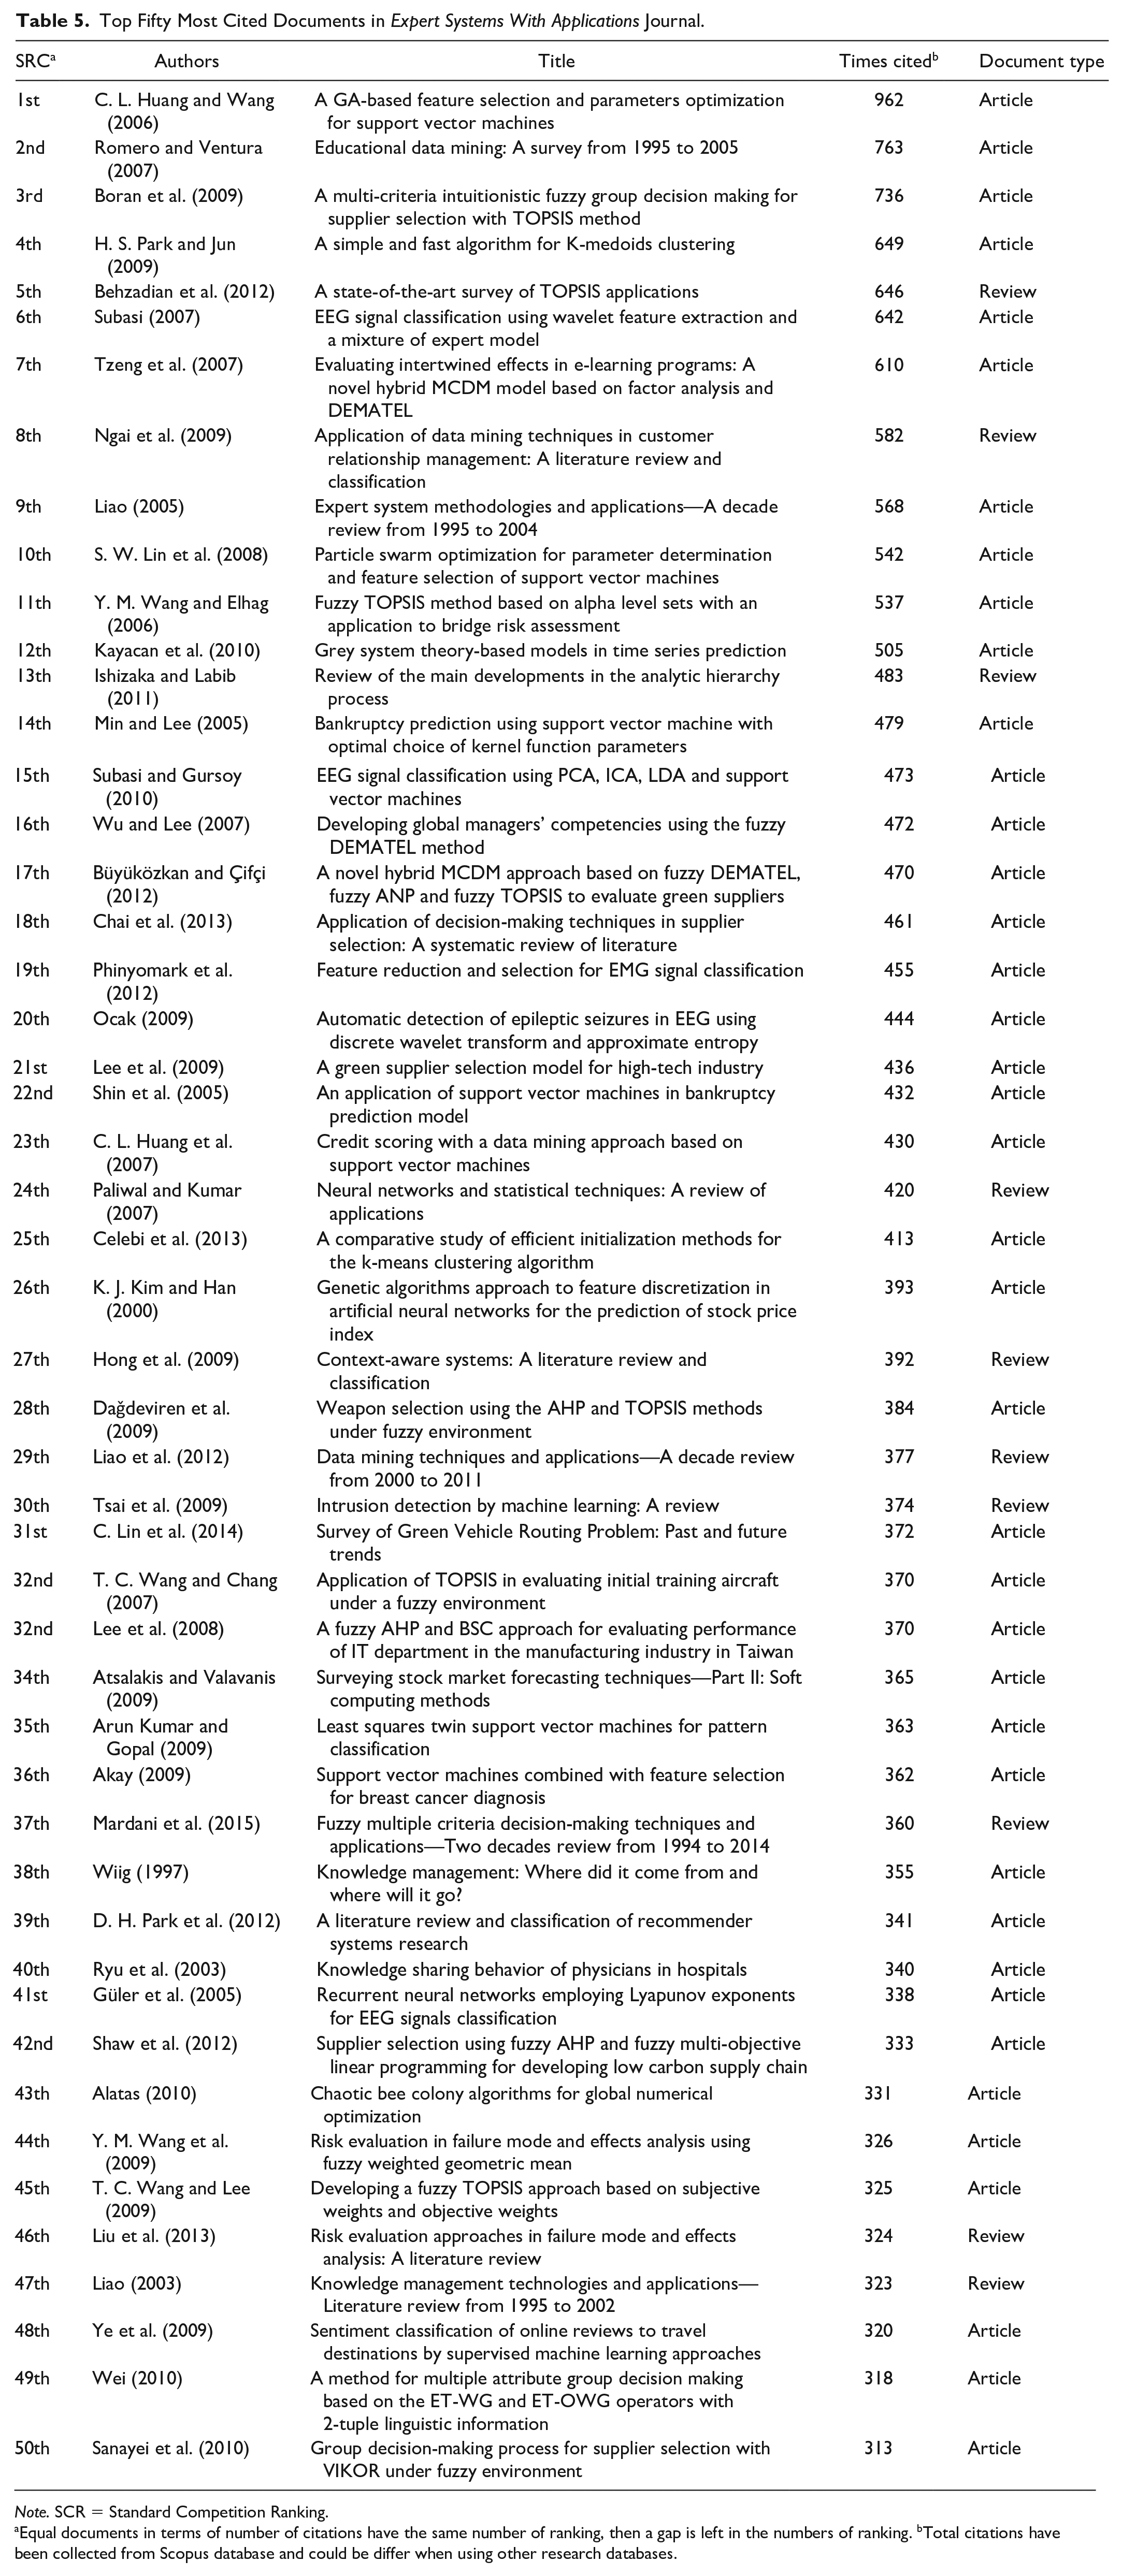
Note. SCR = Standard Competition Ranking.
Equal documents in terms of number of citations have the same number of ranking, then a gap is left in the numbers of ranking. bTotal citations have been collected from Scopus database and could be differ when using other research databases.
The most cited article at the time of data collection from Scopus database was entitled “A GA-based feature selection and parameters optimization for support vector machines.” This article harvested 962 citations and has been published by two authors: the first author was Huang, Chenglung from National Kaohsiung University of Science and Technology, Kaohsiung, Taiwan, and the second author was Wang, Chieh Jen Huafan University, Shihding, Taiwan. In this article, the two authors developed a genetic algorithm for feature selection and optimization of parameters to solve the problem of degrading the support vector machine classification accuracy (C. L. Huang & Wang, 2006). In this list, there were 40 articles and 10 reviews. The marked number of reviews in the list of most cited documents, despite their margin dominance in the total tested sample (1.3%), referred to the fact that in general, reviews tend to be highly cited as they are used heavily in the literature review. As reviews summarize the current state of knowledge about a research topic, these types of documents are more frequently cited than research articles. Despite the role of reviews in increasing the score and impact of journals, ESWA showed a low ratio of reviews compared with original articles. This indicates a straightforward publication practice of ESWA journal in avoiding legitimate manipulation based on increasing the number of published reviews to increase its impact.
Major ESWA Journal Metrics
The database of SCImago Journal & Country Rank (SJR), which is a publicly available portal including several scientific indicators developed from the data and information contained in Scopus database, showed that the h-index of ESWA journal is 184 at the time of data collection (January 1, 2020). The SNIP impact of ESWA journal is 3.139 (Elsevier, 2020). The trend of development of SJR metric, based on data reproduced from SJR (2020a), is displayed in Figure 9A. There is in general a trend of increase in SJR metric with time. The lowest SJR metric was 0.292 in 1999 and increased to its highest value; 1.494 in 2019. As SJR metric is a prestige indicator, this indicates that the impact of publications in ESWA will be of significance in terms of quality and quantity at long term. Figure 9B. displays a comparison between total citations and self-citations. It is clear that there is a trend of decreasing the self-citations in ESWA journal (i.e., the highest rate of self-citation was recorded in 2009; 29.4, while the lowest rate of self-citation was recorded in 2018; 6.46). The average self-citation is estimated at 17.2%. A study conducted by WoS concluded that self-citation rate of 20% or less is characteristic of the majority of the high-quality science journals (WoS, 2020b). Therefore, there is no much difference in the impact factor of ESWA journal with total citations; 5.452 and its impact factor without journal self cites; 4.807. In terms of CiteScore (Figure 9C). displays a linear trend that links the evolution of CiteScore with time. The coefficient of determination (r2) of the model was about 0.99. This indicates a stable positive linear development in the quality of publication in ESWA journal with time.
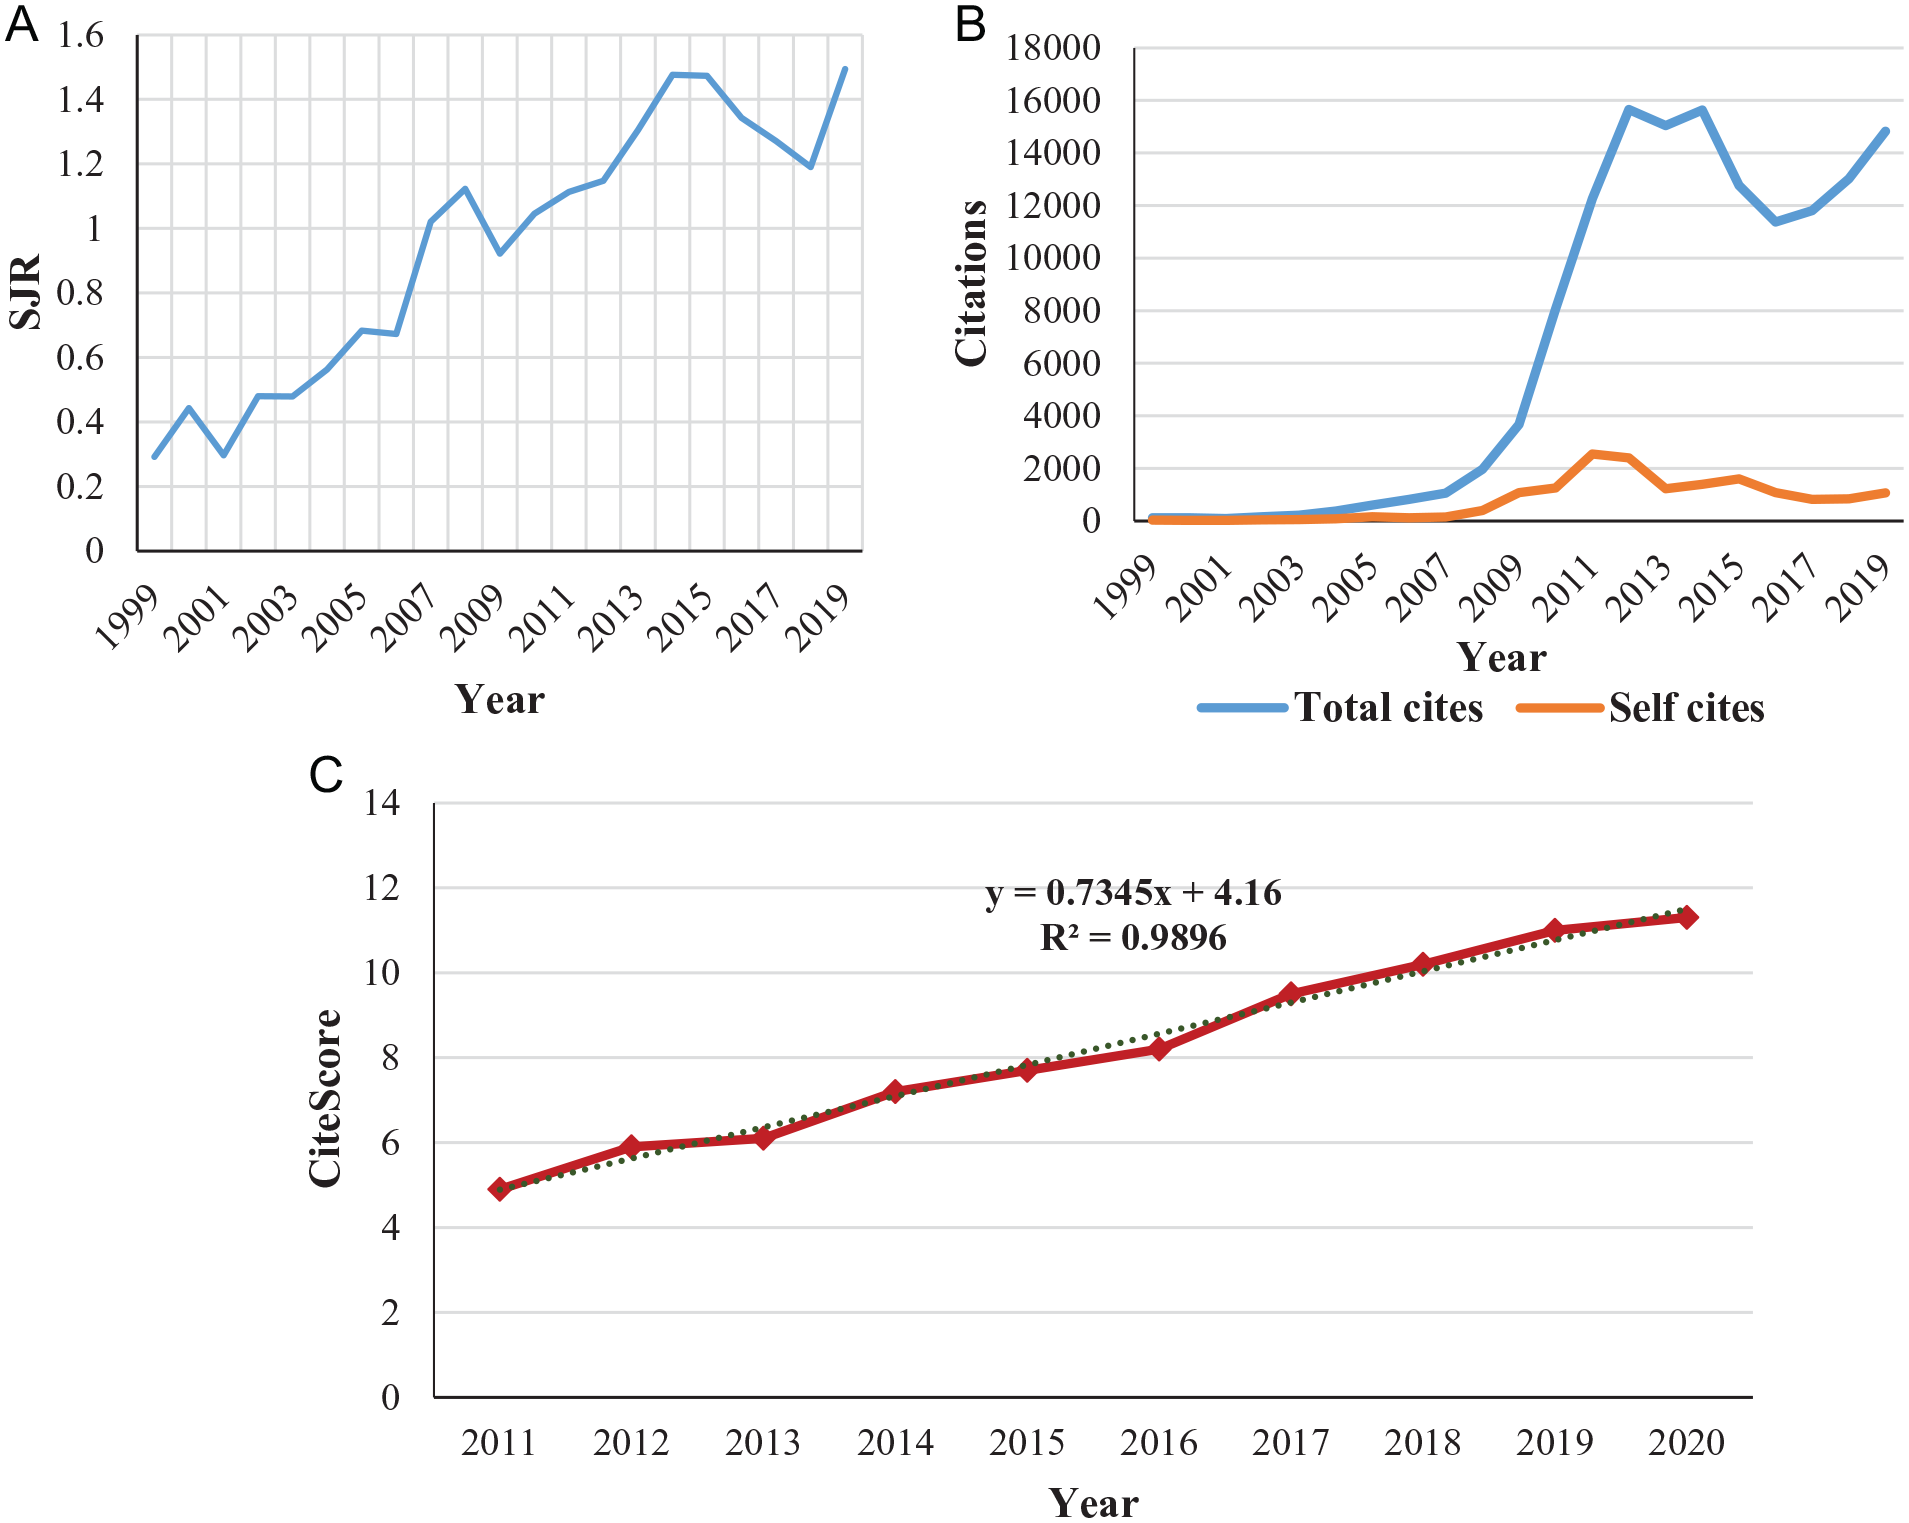
Evolution of SJR and citations of ESWA journal with time: (A) Development of SJR of ESWA journal with time; (B) comparison between total citations and self-citations in ESWA journal; (C) development of CiteScore of ESWA journal with time.
Content Analysis Outcomes Based on Analysis of Author and All Keywords
The overlay visualization map of co-occurrence author keywords analysis is shown in Figure 10. For a keyword, the minimum number of occurrence was given as 30 occurrences. One hundred thirty-five keywords out of 27,687 keywords met the set threshold. The size of the node in the visualization map is an indicator of the contribution of the keyword (the larger the size of the node, the higher occurrence of the keyword). The terms genetic algorithm and genetic algorithms were the keywords with most occurrences (612). It is followed by data mining (587), neural network and neural networks (497), support vector machine and support vector machines (375), classification (348), machine learning (294), feature selection (273), particle swarm optimization (254), fuzzy logic (199), and clustering (194). It can be concluded from this map that these topics with most occurrence will continue to be major research areas in ESWA journal. A strong correlation was found between the most occurrence author keywords for publications in the list of top-cited documents (Table 5) and most occurrence author keywords for all published documents in ESWA journal (Figure 10). In the list of top cited documents (Table 5), support vector machine and data mining were the keywords with the most occurrences (seven occurrences/each keyword). It is followed by supplier selection, neural networks, feature selection, fuzzy set theory, pattern recognition, genetic algorithm, and clustering.

Overlay visualization map, analysis of co-occurrence of author keywords, minimum number of occurrences of a keyword was set to 30, of the 27,687 keywords: 135 meet the threshold.
For the two most used keywords, genetic algorithm or genetic algorithms and data mining, the search in Scopus database for these terms in titles, abstracts, and keywords of published documents in Scopus database resulted in 190,297 documents and 165,611 documents, respectively. This points the importance of these techniques as robust, efficient, and optimized methods in a wide field of research where high computational performance is required. The use of genetic algorithms in data mining applications is of particular and increasing interest due to their success in large-scale search and optimization issues.
The map shows the active topics in association with time (Figure 10). In recent periods (red color nodes), the active topics include random forest, ensemble learning, segmentation, anomaly detection, deep learning, swarm intelligence, metaheuristics, mutual information, computer vision, sentiment analysis, and opinion mining. There are seven clusters with 2,063 links and a total link strength of 5,052. The keywords in each cluster have more joined relations with each other. The strongest link strength was recorded by data mining keyword (612). It is followed by the link strength of genetic algorithms (522), neural networks (434), classification (428), support vector machines (388), feature selection (301), machine learning (289), decision tree (188), clustering (182), and fuzzy logic (156). It is clear that for the critical period of exponential growth in the number of publications (2010–2014), there was a wide variety of topics discussed in ESWA journal. While, for periods of stable growth, there was less variety in the discussed topics.
The density visualization map (Figure 11) has been used to map co-occurrence of all keywords (author and index keywords). One hundred ninety-one keywords have met a threshold of 100 occurrences out of 61,688 keywords. The keyword (neural networks) was the one with highest occurrences (1,527 occurrences). It is followed by genetic algorithm and genetic algorithms (1,417), decision making (1,340), data mining (1,265), and expert systems (1,280). There were 14,032 links with a total link strength 116,284. The neural networks keyword recorded the strongest link strength (6948). It is followed by genetic algorithms (6884), data mining (5737), decision making (5712), and artificial intelligence (5310). The map categorized the items into six clusters, expert systems in the core of Cluster 1, neural networks in the core of Cluster 2, decision making in the core of Cluster 3, algorithms in the core of Cluster 4, forecasting in the core of Cluster 5, and decision trees in the core of Cluster 6.

Density visualization map, analysis of co-occurrence of all keywords (author keywords and index keywords), minimum number of occurrences of a keyword was set to 100, of the 61688 keywords: 191 meet the threshold.
Strengths and Limitations
This assessment revealed a collection of key information where interested researchers can acquire insights into the contributions of authors, institutions, and countries in fields of research in relation to expert systems. The major bibliometric indicators that characterize ESWA journal have also clearly revealed and presented. The acquired indicators (qualitative and quantitative bibliometric indicators) will be of advantage in future assessments. They can be used to assess the progress in terms of collaboration, citations, productivity, and so on, compared with the present situation. Furthermore, it is possible to use some of these indicators in identifying the possible developments in research trends and interests compared with the present trends. In terms of limitations, the major one is concerned with citation rates. The citation rates which are elicited from Scopus database could be different compared to other databases (i.e., Google Scholar, WoS, etc.). Despite this limitation, Scopus database is mostly and commonly accepted by researchers in conducting high-quality bibliometric assessments. That is because it includes many merits and having higher flexibility compared with other databases. Another limitation is related to considering only articles and review documents in this analysis. The exclusion of other types of documents (i.e., letters, conference papers, editorial, etc.) could omit some valuable information and contributions in the field.
Conclusion Remarks
In this work, a comprehensive perspective at the development and evolution of ESWA journal is provided. This study investigated the 30-year history of ESWA journal (from 1990 to end of 2019) from multiple perspectives. Based on utilizing of bibliometric techniques and visualizing mapping, it was possible to analyze publications in ESWA in terms of geographic distribution, contributed authors, countries, institutions and sources, research collaboration, co-citation, co-authorship, and content analyses. The main conclusions about ESWA are summarized as follows: the publications of ESWA have provoked considerable discussions and universal concerns across the globe. It has attracted the interests of the scientific community. This is evident by the extraordinary growth in the number of submissions, publications, and citations. Taiwan, at country level, is the leading country of ESWA, while China and United States have become more and more influential and productive in ESWA. The Asiatic region plays a pivotal role toward generating and sustaining of knowledge in ESWA. The networks of co-authorship and authorship are linked very well and comprise a group of collaborating scholars. The ESWA can be considered as a principal hub of cutting-edge research related to computer science and engineering, mainly artificial intelligence. It is an incubator of major emerging trends and the most recent research subjects in relation to computer science. Finally, this bibliometric study is a dynamic analysis and may evolve differences in the future. Accordingly, it is required to perform these analyses periodically to document successes and pitfalls in relation to different bibliometric performance indicators of a specific journal.
Footnotes
Availability of Data and Material
Data available within the article. Any additional data are available from the authors.
Declaration of Conflicting Interests
The author(s) declared no potential conflicts of interest with respect to the research, authorship, and/or publication of this article.
Funding
The author(s) received no financial support for the research, authorship, and/or publication of this article.