
Abstract
The present study aimed to develop an indigenous measure of learning styles for e-learners in Pakistan and to establish its psychometric properties. The objectives of the study were attained via three studies. First, the items for the development of the Learning Style Scale for e-Learners (e-LSS) were generated empirically based on a 5-point Likert-type scale. In Study I, the internal consistency and dimensionality of the measure were determined by sampling 360 e-learners aged from 20 to 40 years through a convenient sampling technique, whereas other demographic characteristics were kept in close consideration. For this purpose, exploratory factor analysis was utilized. In Study II of scale development, the factor structure that emerged in Study I was confirmed via confirmatory factor analysis using structural equation modeling. In Study III, the convergent and divergent validities of the newly constructed scale were established by correlating scores with preestablished scale scores that assess the similar construct (i.e., LSS) and with scores on the discriminant construct (i.e., Solving Problems Survey). The sample for this study consisted of 80 e-learners aged from 20 to 40 years. A total of 29 items were confirmed in the final scale with 8 distinctive factors (namely, visual, auditory, kinesthetic, global, analytical, individual, collaborative, and technological type) with sound psychometric properties. To conclude, the newly constructed scale was a significant addition to assess learning styles particularly of e-learners in the context of Pakistan.
Introduction
The doors of the third millennium are opening enormous and stimulating opportunities for both educators and learners by the use of the internet, intranet, or network (Ahmed et al., 2017). The rapid development of computers as well as the growth and enhancement of technology in the domain of education has been witnessed by academicians, educators, and learners (De Meester et al., 2014). In addition, World Wide Web (WWW) has played a vibrant role in distance education in general by providing innovative and interactive means of learning without any barrier of time and distance to reach learners (Vassileva, 2012). McEwen (2001) argued that one such great phenomenon at the intersection of information technology (IT) and education is electronic learning (e-learning). With the advent of this latest technology, that is, e-learning, the higher education process has dramatically changed over the past few years. During these few years, e-learning technology has enhanced the learning experience of learners and teaching avenues of instructors as well as turns into commonplace for university students and teachers (Paechter et al., 2010).
Moreover, these new avenues of new challenges and opportunities also played an imperative role in the integration of technologies in the domain of education for distance education in general and e-learning in particular (Bocchi et al., 2004). Ryan (2001) suggested that learning and education vary to a great extent among learners because of their diverse choices, approaches, and needs toward learning. These individual differences are called learning styles by psychologists. Thus, it is imperative that learners should provide learning environments per their needs and preferences where they find more efficient to accommodate their learning styles.
E-Learning
E-learning, the latest invention of IT, considered as an emerging, vibrant, and rapidly growing mode of education, has made the global exchange of knowledge and skills easier than ever before (Doulik et al., 2015). It can be defined as the deliverance of academic skills and educational activities through computers or other electronic devices (Roffe, 2002; Sambrook, 2003; Schank, 2002; Tsai & Machado, 2002). The varying demographic factors of learners, altering conditions for educational delivery, and advancement in technology are the major motivating forces behind the popularity of e-learning (Concannon et al., 2005). Educational institutions all around the globe are in constant effort to keep pace with these altering trends of incorporating information and communication technology into education to improve the educational experience of learners (Garrison & Cleveland-Innes, 2010).
In the Western milieu, it is generally observed that e-learning, which originated from its predecessor, namely, distance learning, has been incorporated into higher education institutes for various educational purposes (Valcke, 2004), as it has drawn the attraction of the educators across the globe (Brady et al., 2010) primarily because of its flexible nature for the majority of university components (Ezziane, 2007). It is reported that e-learning has been rapidly mounting in major parts of the world and regarded as a necessity as well as an opportunity in the domain of education (United Nations Educational, Scientific and Cultural Organization, 2007). Consequently, many countries begin to prioritize the initiatives for education; the sole purpose behind is aiming to achieve a goal of “education for all” (Park, 2011). In addition, the rapid expansion of e-learning appears to promote further, since the internet has become the necessity of the young generation of the digital world. Lau (2003) explored the fact that youngsters aged from 16 to 20 years are keen toward e-learning. The popularity of e-learning is due to the fact that it defies the hurdle of time and space (Valcke, 2004) and facilitates individuals who have been in search of higher education but constrained by work pressure and family needs to pursue higher studies while staying at home or any place at any time (Park, 2011). Hence, e-learning is on the rise among higher education institutions to attain the maximum advantage from the innovative paradigm (Salehi Omran & Salari, 2012).
Learning Styles
The notion of learning style is not a new idea; in fact, it is dated back to the ancient Greeks (Wratcher et al., 1997). Researchers, for the past few years, have observed that certain methods of learning are preferred by the learners over the others. These learning preferences assist teachers to plan and devise individual-based instructions (Li, 2011). Learning styles, therefore, can be defined as those individual traits that influence a learner’s ability to attain information, to work together with peers and instructors, and provide their contribution for educational purposes (Grasha, 1996). Thus, it is the tendency for the preference to process information in certain ways (Li, 2011).
During past decades, lots of research have been conducted on demographic characteristics, instructional design, motivation, personality traits, and student satisfaction to explore the success of e-learners in e-learning courses (Boyd, 2004; Halsne, 2002; E. Qureshi et al., 2002). Learning styles have made significant contributions to exploring the learning preferences and differences in e-learners to deliver instructions and course designs effectively. In this context, e-learning may provide a possible choice to satisfy the learning needs of e-learners (E. Qureshi et al., 2002).
It is important to note that each learner is unique and approaches the learning material in different ways when compared with other learners which in turn may affect the learning process as a consequence (Baldwin & Sabry, 2003). Hafler (2001) indicated that it is beneficial to be familiar with the learning style when learners are exposed to learning situations to optimize the outcome. It is also evident that awareness of the learning styles of learners is helpful for the teachers to arrange the course content accordingly, and enhanced learning could take place (Murrell & Claxton, 1987). The evidence comes from the fact that knowledge of individual learning styles would enhance confidence among learners in utilizing their study styles (Hendry et al., 2005).
As far as e-learning is concerned, most of the learners in this mode of education are fascinated by the convenience and flexibility of time and scheduling (Ryan, 2001). The learning characteristics of learners are not known, thus making it hard to devise effective instruction (Sheard & Lynch, 2003). Consequently, instructors need to be sensitive to different learning styles to maximize learning experiences, needs, and expectations and appreciate the e-learner’s learning environment (Bocchi et al., 2004). Similarly, e-learners are more concerned about the administration, teaching approaches, and credibility of the academic qualifications from e-learning programs (Alhasan et al., 2017). The knowledge of students’ concerns, expectations, and needs is necessary for devising effective instruction.
Previous Inventories to Measure Learning Styles
For many years, the significance of learning styles for learners has led to the development of numerous measures aiming to measure, identify, and categorize learner’s individual differences consisting of certain advantages and drawbacks. For example, the earlier test for the assessment of learning style is developed by Witkin et al. (1977) known as the “Group Embedded Figures Test,” where the subject is required to place a specific shape in a complex figure. The subject in this test is classified as field-dependent/global and field-independent/analytic (Witkin, 1976). Another measure known as “Myers-Briggs Type Indicator” was developed by Myers (1962) based on Jung’s theory of personality to identify personality based on the following dimensions, that is, introversion–extraversion, intuition–sensation, feeling–thinking, and perceiving–judging (Myers, 1962). Based on the experience learning model, Kolb developed a scale of learning style based on a continuum which includes concrete experience, reflective observation, abstract conceptualization, and then active verification in the form of a four-step cycle (Kolb, 1976). Kolb categorized learners based on four preferences: (a) convergers, (b) divergers, (c) assimilators, and (d) accommodators (Kolb, 1976).
Dunn developed a 24-factor inventory known as Dunn’s Learning Style Inventory that is used to measure learning styles (Dunn et al., 1981), whereas another inventory of 21 factors called “Productivity Environmental Preference Survey” is utilized by adult learners (Price et al., 1991). Learning Style Profile is developed by Keefe and his associates. The scale was composed of 23 factors; among them, cognitive skills, perceptual response, persistence orientation, manipulative, time of the study, group study, mobility, and location were included (Keefe et al., 1986). Another noteworthy scale to measure the construct is “Index of Learning Styles” developed by Felder and Soloman in 1991. It is used to measure four dimensions based on 44 items to assess learning preferences which include: (a) sensing/intuitive, (b) visual/verbal, (c) active/reflective, and (d) sequential/global (Felder & Spurlin, 2005). All the instruments discussed earlier measure the learning styles of students in conventional or traditional universities, whereas none of the abovementioned scales is available to determine the e-learner’s learning styles.
In addition, it is evident that learning styles have been witnessed to play a significant role for e-learners. In this regard, abundant research have been done to explore, examine, and investigate the learning styles of e-learner in diverse dimensions. Research (e.g., Graf et al., 2009; Guerrero & Crites, 2013; Lightner et al., 2010) investigated that there is not a single style suitable for all learners and similarly cannot address learner’s individual differences in information processing. Moreover, Terrell and Dringus (2000) have investigated the role of learning styles on the performance of learners and student retention in distance education and found that when the learning styles of students in the online learning environment are considered and respected, their academic performance enhanced and they succeed more.
Furthermore, students with aural, verbal, and solitary learning style in e-leaning medium of education have higher academic achievement, whereas female students were found to display high preferences for the perceptual learning styles when compared with male students (Akdemir & Koszalka, 2008; Kia et al., 2009; Ramayah et al., 2009). Several other research (such as: Hussain, 2007, 2012; Iqbal & Mumtaz, 2010; Jawaid et al., 2013; Khan & Jumani, 2012; I. A. Qureshi et al., 2012; Sherazi & Ikram, 2002) explored that e-learning is emerging as a substitute in Pakistan for the traditional educational system due to its low cost, standardized curriculum, flexibility, equipped with latest technologies, instructional methodology based on technology, national integration, and equal opportunity for both genders to get the opportunity for attaining higher education.
All the research studies mentioned earlier underline the significance of the indigenous scale for the measurement of learning styles. The following study was conducted to serve this purpose. To the extent of our knowledge, the development of a valid and reliable learning style scale for e-learners (e-LSS) is the initial study conducted in Pakistan for students enrolled in e-learning universities. The construct has its significance and contribution for the e-learners which has gained increased popularity over the past few years in Pakistan, that is, 750,000 students enrolled under different e-learning degree programs in Pakistan with an annual growth rate of 14% (Siddiquei & Khalid, 2018). The mentioned statistics showed that e-learning universities provide educational facilities to students three times greater than any other university in Pakistan (Shah & Saleem, 2010). There are no single practical studies that have developed a learning style scale for e-learners which is a way of addressing students’ learning needs. The Learning Style Scale for e-Learners has the capacity to be used for both distance education and e-learning environment worldwide. This instrument has extensive scope than the existing scales of learning styles keeping in view the wide spread use of e-learning in every sphere of life including education and to boost the literacy rate of Pakistan by providing educational avenues to the youth.
The following objectives were achieved in this study:
To construct an indigenous learning style scale for e-learners.
To establish sound psychometric properties of the newly constructed scale.
To explore and enlighten the importance of learning style as the innovative research area by establishing the importance of e-learning universities as a rapidly growing and mainstream mode of education in Pakistan.
Study 1: Development of e-Learners Learning Style Scale (e-LSS)
The study was conducted in two phases. In Phase I of the study, the item generation process was completed, whereas Phase II consists of exploratory factor analysis (EFA). EFA was run on items generated empirically to attain the theoretical structure of the scale.
Method
Phase-I: Process of Item Generation
The item generation process for the development of the e-Learner Learning Style Scale (e-LSS) was done based on three sources, that is, (a) a review of the existing measures for the assessment of learning styles. (b) A focus group was conducted with students enrolled in different e-learning degree programs. E-learners were encouraged to discuss their learning styles; (c) in addition, items were pooled up as well as presented for expert opinion.
This procedure yielded 55 items. After the development of the item pool, experts analyzed the items carefully based on the given criteria: (a) content clarity, (b) construct relevance, (c) reiteration, and (d) reading clarity. The 48 items were left after this process. To each item of the scale, a 5-point Likert-type layout was allocated (1 = strongly disagree, 2 = disagree, 3 = undecided, 4 = agree, and 5 = strongly agree).
For further psychometric screening of the developed items, the following actions were taken, including (a) eliminating overlapped or unrelated items, (b) making sure that statement of each item is easy to comprehend, (c) restraining the length of the questionnaire, and (d) items appropriateness in the questionnaire. The pilot test of the newly constructed scale was done on a conveniently selected sample of 50 e-learners. Significant results were revealed by the test of normality, that is, the Kolmogorov-Smirnov test. Finally, the theoretical structure and factorial validity of the 48-item scale were confirmed through EFA.
Phase-II: Factorial Structure and Internal Consistency of e-LSS
The 48-item scale was presented for the factor structure in Phase II of the study using EFA. The process was accomplished to get the final items of the scale and to examine the factorial structure of e-LSS. Furthermore, reliability analysis was done to calculate internal consistency and item-total correlation.
Participants
A sample of 360 students was taken from Virtual University of Pakistan (VUP), and the sample ranged in age between 16 and 40 years (M =24.07, SD = 3.07) through a convenient sampling technique. The educational level of students varies from bachelor's to master's programs of different courses and different semesters as well.
Measure
The 48-item scale that was used in Phase II was finalized after the pilot testing.
Procedure
The participants of the study were personally approached by the authors from university campus located in different cities of Pakistan. The study participants were informed about the study individually. Informed consent was also taken from the participant. The responses of the participant were recorded by the researcher, and the participants were guided to choose the most appropriate response. No names of the participants were recorded to ensure anonymity and confidentiality of the responses. Before factor analysis of the data, the following assumptions of EFA including normality, sample size, linearity, and outliers were tested, whereas the data were found to meet the criteria (Field, 2009).
Results
The 48-item scale was subjected to principal component analysis (PCA), using the method of Varimax Rotation to increase the interpretability and orthogonality of factors. Based on the criteria given, the scale structure was reviewed: (a) a simple structure with distinctive factors with its items highly loading on a single factor; (b) an eigenvalue ≥1; (c) a factor loading of minimum 0.30; and (d) relevance of the factors concerning the underlying construct as suggested by Field (2009), Fabrigar et al. (1999), Norman and Streiner (1994), and Zeller and Carmines (1980). The meaningful or interpretable factors were drawn with the help of the criterion given by Kaiser (1974) and the percentage expressed by the total variance explained. This process provides the final eight factors. The retained eight well-defined factors showed a significant amount of variance, that is, 49.1%. Similarly, component transformation matrix points out that the orthogonal rotation method was suitable for this study because the majority of the factors have low intercorrelations.
In addition, the scree plot was used as a criterion for the selection of factors based on eigenvalue (Cattell, 1966). Table 1 shows the eigenvalue of 6.19 was obtained for the first factor, 3.91 for the second factor, whereas 2.71 and 1.97 are the Eigen values for the third and fourth factors, respectively. Similarly, on five, six, seven, and eight, an eigenvalue of 1.64, 1.61, 1.49, and 1.44 was obtained, respectively. In all, 11.59% of the variance was explained by Factor 1, whereas variance explained by second, third, fourth, and fifth factors were 7.00%, 4.33%, 2.81%, and 2.05%, respectively. However, 1.99%, 1.67%, and 1.62% variance were explained by the sixth, seventh, and eight factors. Table 1 shows eigenvalues and percentages of variance explained by each factor.
Eigenvalues and Percentages of Variance of 48-Item e-LSS Explained by Eight Factors in the Factor Solution Obtained Through Principal Component Analysis (N = 360).

Note. e-LSS = e-Learners Learning Style Scale.
Furthermore, Figure 1 shows the scree plot for the extraction of the factors. The break and bend are clearly indicated between the seventh and eighth factors in the scree plot. Therefore, eight factors are supported to be retained in e-LSS.

Scree plot showing extraction of factors of Learning Style Scale for e-Learners (e-LSS).
The factor loadings of the 48 items of e-LSS on eight distinct factors using Varimax rotation are presented in Table 2.
The Factor Loadings of the 48 Items of the Learning Style Scale for e-Learners (e-LSS) on the First Eight Factors in the Factor Solution Obtained Through Varimax Rotation.

Note. e-LSS = e-Learners Learning Style Scale.Bold represent the significance values of the table.
The criteria for the item selection on a scale was most preferably factor loading of 0.30 or above, whereas the item loading value which is <0.30 must be extracted from the scale (Field, 2009). As a result, an eight-factor scale was finalized keeping in mind all of the assumptions discussed earlier. In addition, each factor was observed based on the theoretical relevance of items and item content.
Items 37 to 42 exclusively loaded on Factor 7 with their loadings ranging between 0.74 and 0.64; therefore, these six items were maintained under this factor due to factor loadings and theoretical relevance of items to each other. Similarly, items 43 to 48 exclusively loaded on Factor 8 with their loadings ranging between 0.65 and 0.32; therefore, these six items were also retained in their respective factor due to factor loadings and theoretical relevance of items to each other.
Hence, it was decided that two items (i.e., Items 21 and 25) were eliminated in the final scale because these items have <0.30 factor loading and did not make any meaningful structure, and they were not theoretically relevant to each other. The remaining 46 items had high factor loadings (ranging from 0.31 to 0.74) based on eight factors that formed the e-LSS. No reverse coding was required for any item on this scale. The 46-item scale of e-LSS was subjected to principal component analysis another time to get the final factor structure.
The eigenvalues shown in Table 3 confirm that the eight factors accounted for 45% of the variance. The first factor had eigenvalue of 6.14; the second factor had an eigenvalue of 3.91, while the third and fourth factors had 2.68 and 1.97 as eigenvalues, respectively. In the same way, the fifth to eighth factors had an eigenvalue of 1.63, 1.61, 1.49, and 1.44, respectively. The variance of Factor 1 was 13.35%, while the variance for second, third, fourth, and fifth factors were 8.50%, 5.83%, 4.86%, and 3.55%, respectively. Moreover, 3.51%, 3.24%, and 3.13% were the variance found for sixth, seventh, and eight factors.
Eigenvalues and Percentages of Variance of 46-Item e-LSS Explained by 8 Factors in the Factor Solution Obtained Through Principal Component Analysis (N = 360).

Note. e-LSS = e-Learners Learning Style Scale.
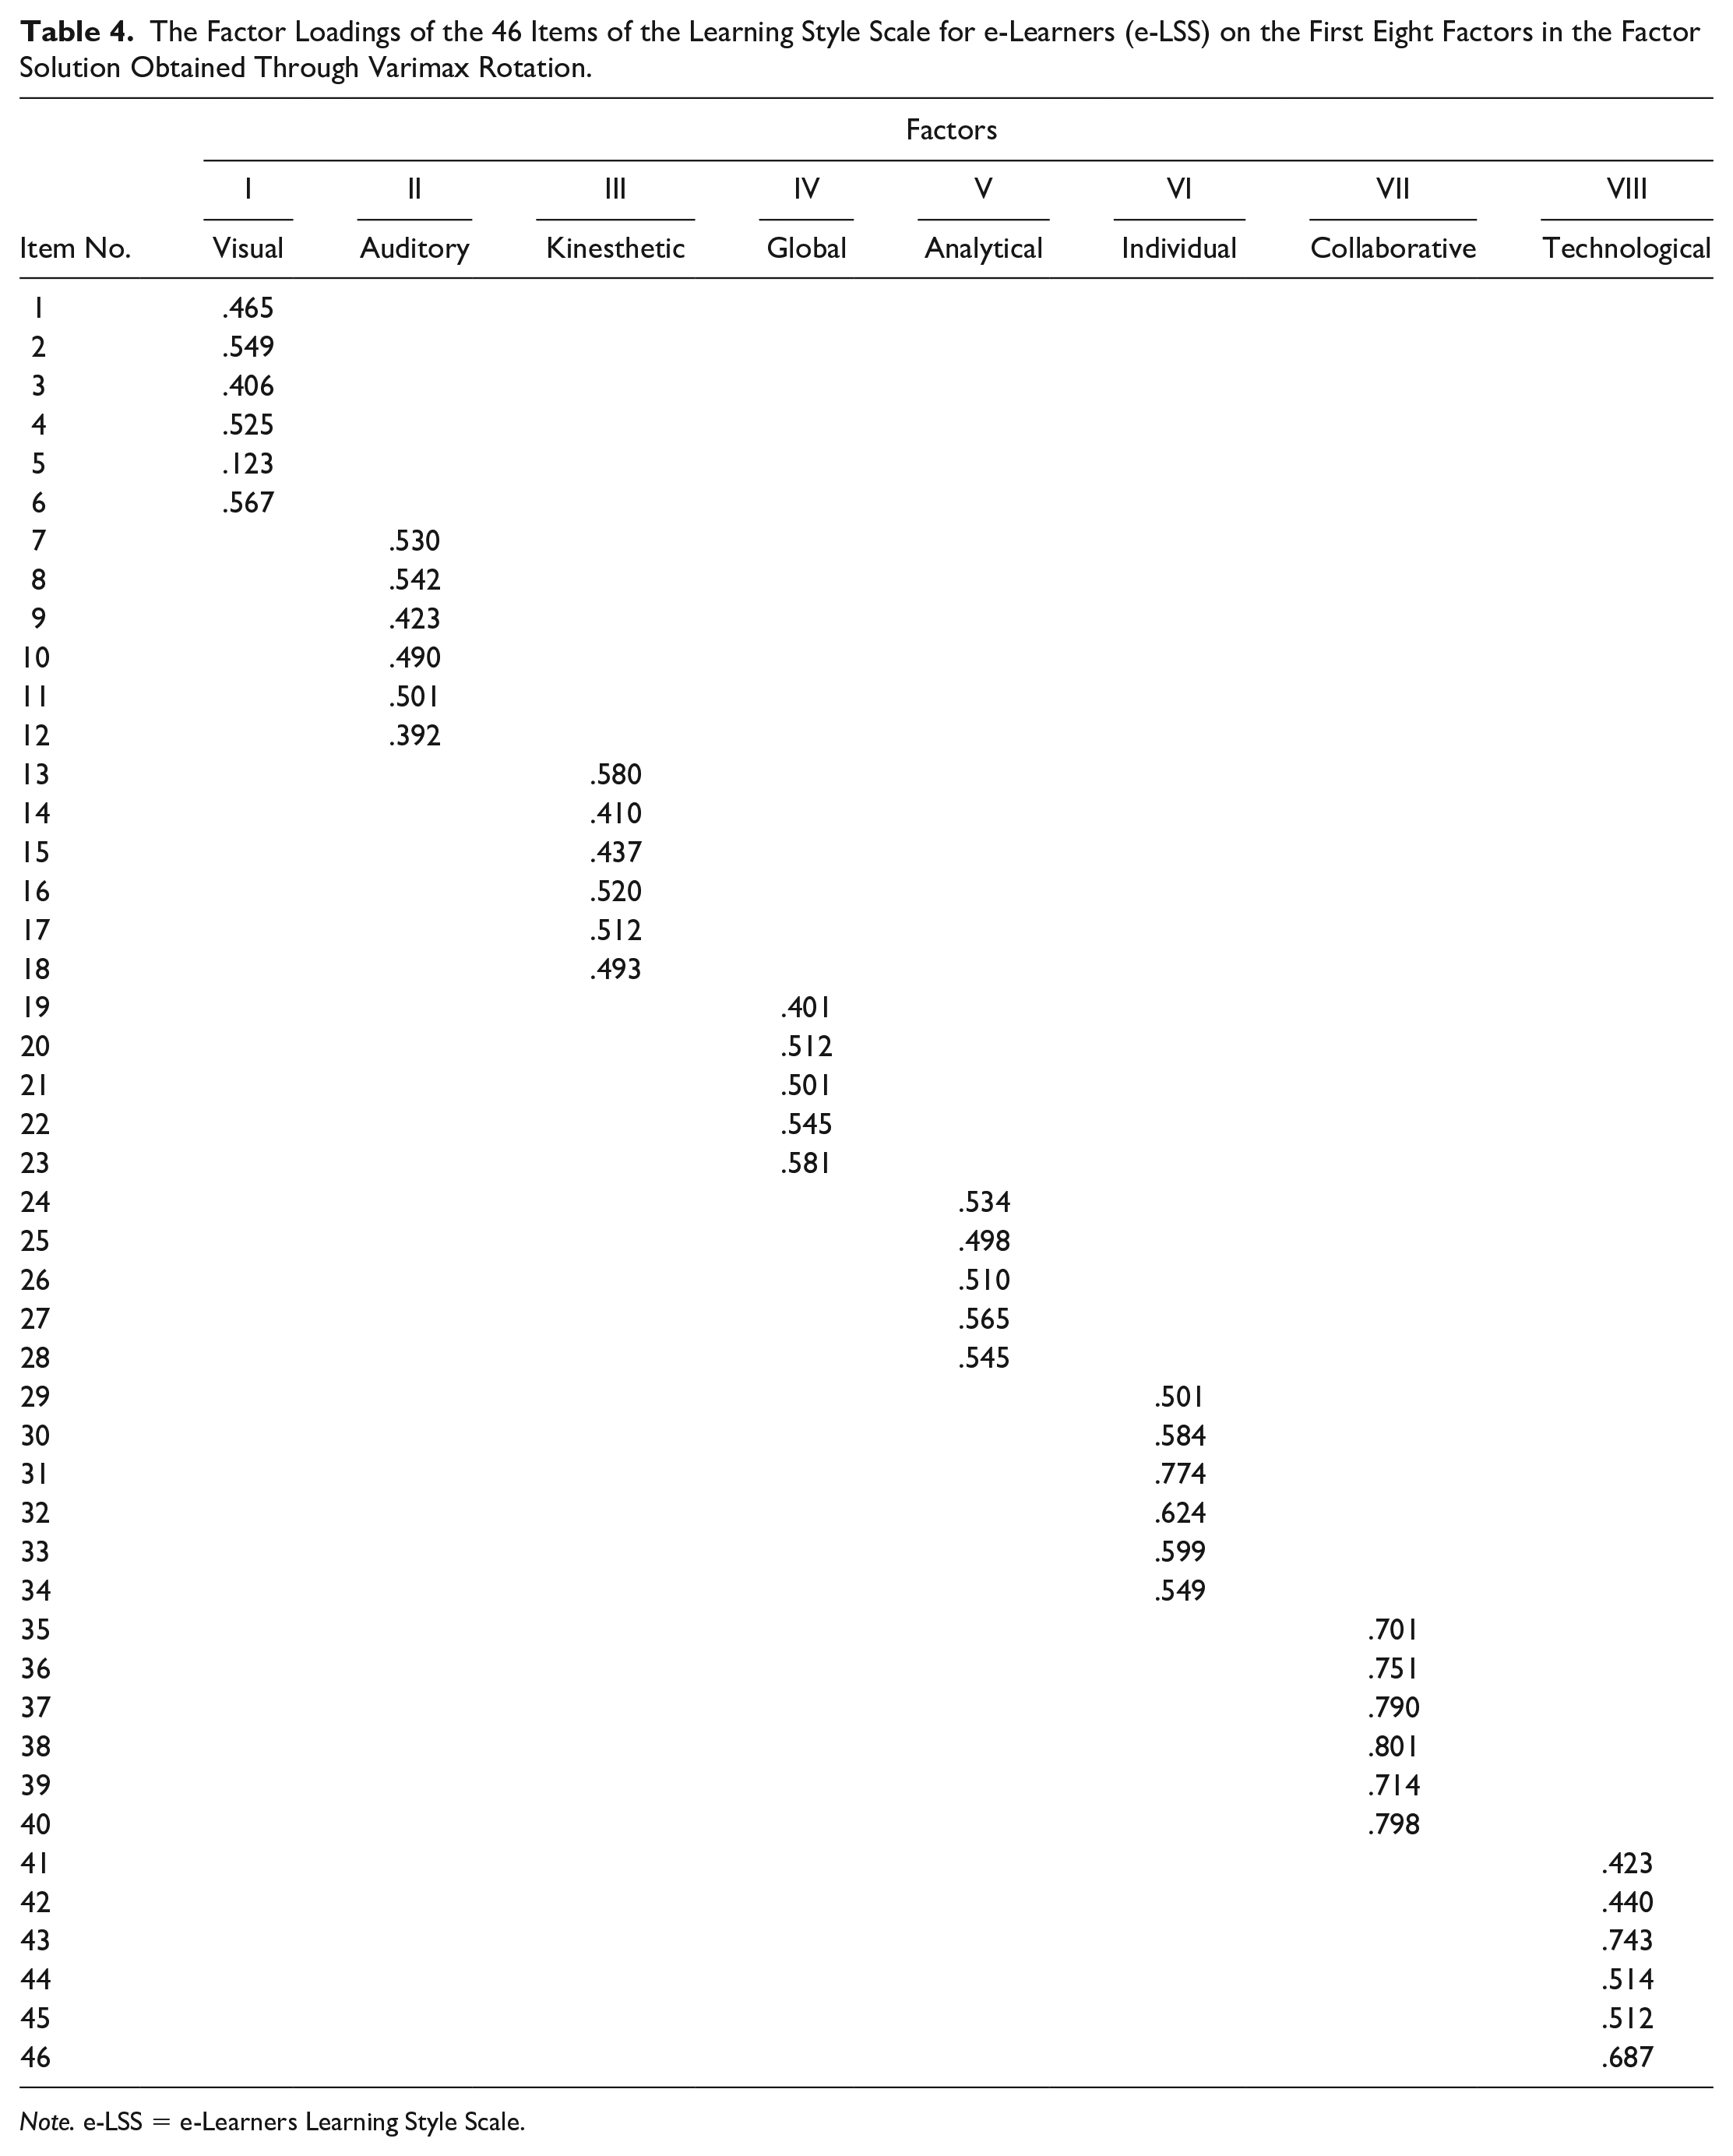
A principal component analysis performed on the 46-item e-LSS using Varimax rotation yielded an eight-factor solution. These factors were examined closely regarding the content of items as well as the underlying theme. A total of six items loaded on the first factor which included items characteristics of visual learners. It was labeled as “visual type.” Factor 2 was labeled as “Auditory type” which also comprised six items and measures auditory characteristics of learners. The third factor consisted of six items dealing with the kinesthetic type of learners. It was labeled as “kinesthetic type.” These factors were expressing the perceptual aspect of learning style. Similarly, there were five items on the fourth and fifth factors, respectively. They were labeled as “Global & analytical type” and showed the cognitive aspect of learning style. The next two factors were named as “individual & collaborative type” and both consisted of six items showing social interaction aspect of learning style. Table 4 represents the factor loadings of 46-item e-LSS with their relevant dimensions.
The Factor Loadings of the 46 Items of the Learning Style Scale for e-Learners (e-LSS) on the First Eight Factors in the Factor Solution Obtained Through Varimax Rotation.
Note. e-LSS = e-Learners Learning Style Scale.
Reliability Analysis
To determine the internal consistency of the scale and subscales, a reliability analysis was run, and internal consistency was established on a sample of e-learners upon which the Scale of Learning Style was developed (N = 360).
Item-Total Correlations of the e-LSS
To determine the item-total correlation, the 48 items of the e-LSS were subjected to the correlation analysis. The criterion for the selection of an item was that it should correlate .30 and beyond with the total (Cristobal et al., 2007; Nunnally & Bernstein, 1994). It was noted that the same two items that had low factor loadings on the eight factors (see Table 2) failed to attain the significance on item-total correlation analysis. These findings confirm the previous decision (based on factor analysis) of removing these items from the final scale. Table 5 shows the item-total correlation for 48 item e-LSS.
Item-Total Score Correlation for the 48 Items of the Learning Style Scale for e-Learners (e-LSS) (N = 360).

Note. e-LSS = e-Learners Learning Style Scale; ns = not significant.
p < .01.
The final 46 items of the scale were subjected to the item-total correlations once again. The range of item-total correlation for the 46 items was 0.301 to 0.593 and was significant (p < .01). The results are presented in Table 6.
Item-Total Score Correlation for the 46 Items of the Learning Style Scale for e-Learners (e-LSS) (N = 360).

Note. e-LSS = e-Learners Learning Style Scale.
p < .01.
Correlations of Subscales of e-LSS With the Total 46-Item e-LSS
To determine the intercorrelations of the eight factors, the total scores of e-LSS were calculated. The results revealed that there were significantly positive interscale correlations among visual, auditory, kinesthetic, global, analytical, individual, collaborative, and technological types of learners. Hence, it was found that two subscales, that is, individual and collaborative scales, had the strongest correlations. The extent of intercorrelations among subscales shows that they are comparatively moderate correlation, whereas high correlations exist with the total score on the e-LSS. These values of correlation confirm that the eight subscales characterize theoretically distinctive dimensions. A highly positive and significant correlation was found between the subscales and the total e-LSS. It is therefore concluded that all of the eight subscales contributed to the total score which recommends that the 46-item e-LSS measures learning styles of e-learners which comprises eight dimensions of learning, that is, visual, auditory, kinesthetic, global, analytical, individual, collaborative, and technological. The intercorrelations of the eight factors are presented in Table 7.
Intercorrelations Among the Subscales of the Learning Style Scale for e-Learners (e-LSS) and Correlations With the Total Scale Items.

Note. e-LSS = e-Learners Learning Style Scale.
p < .05. **p < .01.
Internal Consistency of the e-LSS
To measure the internal consistency of the 46-item e-LSS, the alpha coefficient of the scale was computed. A value of 0.80 was obtained; however, the value was expected to increase after the elimination of two items (with very low item-total correlation) from the final scale. The Cronbach’s alpha reliability of the 46-item e-LSS was 0.83 as given in Table 8 is considered fairly high for any test. The value of Cronbach alpha suggests that the items were homogeneously consistent as expected theoretically for the construct of learning styles for e-learners.
Alpha Coefficient of the Learning Style Scale for e-Learners (e-LSS) With 48 Items and With the Reduced 46 Items.

Note. e-LSS = e-Learners Learning Style Scale.
Internal Consistency of the e-LSS Subscales
The reliability estimation of e-LSS and the internal consistency of the eight subscales was also estimated by calculating Cronbach alpha for subscale. The Cronbach alphas for all of the eight subscales were significant. Although the alpha’s for the subscales are lower when compared with the total score, it is however sufficient for the scale of 46 items. The values are given in Table 9.
Alpha Reliability of the Learning Style Scale for e-Learners (e-LSS) Subscales (N = 360).

Note. e-LSS = e-Learners Learning Style Scale.
Study 2: Confirmatory Factor Analysis
Method
Participants
A sample of 350 students were taken from Virtual University of Pakistan (VUP), and the sample age ranged between 16 and 40 years (M =23.06, SD = 3.27) through convenient sampling technique. The educational level of students varies from bachelor's to master's programs of different courses and different semesters as well.
Measure
The retained 46 items were used for confirmatory factor analysis (CFA) after EFA in Study 2.
Procedure
The participants of the study were personally approached by the authors from university campus located in different cities of Pakistan. The study participants were informed about the study individually. The informed consent was also taken from the participant. The responses of the participant were recorded by the researcher, and the participants were guided to choose the most appropriate response. No names of the participants were recorded to ensure the anonymity and confidentiality of the responses.
Results
After EFA, the scale structure was subjected to CFA with the help of AMOS 21 version using structural equation modeling. The purpose is twofold: (a) to ensure the factor structure and (b) to confirm dimensionality of e-LSS. For CFA, another sample of 350 participants was taken through convenient sampling. To illustrate the best-fit model, different indices and criteria that is, comparative fit index (CFI), goodness of fit (GFI), Tucker–Lewis index (TLI) and root mean square error of approximation (RMSEA), were checked in this study.
However, the values of, chi-square = 1919.993 (df =961), p =.00, chi-square/df =1.998 and CFI=0.83, TLI=0.82, GFI=0.80, and RMSEA= 0.05 did not illustrate a good fit to the data. The parsimony of the model was improved by removing certain items from the final model. The final model consisted of 29 items as shown in Figure 2 and found a good model fit. The model fit indices (Table 10) for e-LSS (chi-square/df = 1.64, chi-square = 569.346 [df = 347] p = .000, CFI =0.90, GFI =0.92, TLI= 0.93 and RMSEA =.042) were adequate.

Illustration of model.
Model Fit Indices of CFA for e-LSS (N = 350).

Note. CFA = confirmatory factor analysis; CFI = comparative fit index; e-LSS = e-Learners Learning Style Scale; GFI = goodness of fit; RMSEA = root mean square error of approximation; TLI = Tucker–Lewis index.
Study 3: Construct Validation of e-LSS
This study was carried out in two parts. The convergent validity of e-LSS was determined in part I of the study. Learning Style Survey (LSS; Cohen et al., 2001) was used to determine the convergent validity. In the process of construct validation, scores of a newly developed scale are correlated with preestablished scale scores that assess similar constructs (Friedenberg, 1995).
However, the discriminant validity of e-LSS was examined in part II of this study. Scale scores were compared with scores on Solving Problems Survey (Barkman & Machtmes, 2000). The procedure of discriminant validity is supported by Friedenberg (1995) during the validation procedure. In the process of discriminant validation, the correlation was found between the newly developed scale score and scale related to discriminant/contradictory behaviors as measured by the construct under study. The results should be negative or at times zero correlation was found.
Method
Participants
The study sample consisted of 80 students aged from 16 to 40 years (M =22.06, SD = 3.27). All the students were taken from the Virtual University of Pakistan (VUP), and the educational level of students varies from bachelor's to master's programs of different courses and different semesters as well. The sample was selected by using a convenient sampling technique.
Measure
The following measures were used.
E-LSS
The e-LSS was used for the measurement of learning styles (see Study 1).
LSS
The self-report measure was used for the assessment of learning styles of learners and was originally developed by Cohen et al. (2001). The survey consists of 110 items to assess 11 dimensions of learning styles. The LSS is a Likert-type scale ranging from 0 to 4 (4 =always; 0 = never). The LSS is used to measure 23 types of learning styles. The respondents were required to answer how each item explains them well and were required to rate accordingly. The survey is suitable for a diverse range of age-groups and is shown to be a valid and reliable measure of learning style (Cesur & Fer, 2009). The questionnaire used in this study has an adequate internal consistency with a Cronbach alpha coefficient (i.e., .77; Pallant, 2001).
Solving Problems Survey
The Solving Problems Survey (SPS) was developed by Barkman and Machtmes (2000). It is a 24-item scale that is used to measure the problem-solving skills by exploring the several skills that an individual is required to keep in solving problems. The SPS is based on 4-point Likert-type scale rating from 0 to 4 (0 = never, 4 =always). The solving problems survey provides evidence of correlation of .80 (Barkman & Machtmes, 2000).
Procedure
The measures were administered to 100 students with aged 20 to 40 years. Data were collected from a convenient sample from different campuses. Participants were instructed to fill the questionnaires to determine the convergent and discriminate validity of e-LSS. The participants were informed about the purpose of the study. Before administering the scales, informed consent was obtained from the participants. The participants’ confidentiality and anonymity were assured as no names were recorded. No time limit was given to participants, but the questionnaire usually took 20 to 25 min to fill the scales.
Results
Pearson correlation was calculated between e-LSS and LSS to determine the convergent validity of the newly constructed scale (Cohen et al., 2001). The results in Table 11 shows that there exist a positive and significant relationship (r = .37**, p = .01). The discriminant validity was calculated by correlating e-LSS and SPS (Barkman & Machtmes, 2000) shown in Table 11. Results revealed that the relationship is negative and significant (r = −.18, p = .01).
Correlations of e-Learners Learning Style Scale With Learning Style Survey and Solving Problems Survey (N = 80).

Note. e-LSS = e-Learners Learning Style Scale; LSS = Learning Style Survey, SPS = Solving Problems Survey.
p < .01.
Discussion
This study was intended to develop an indigenous scale for the assessment of the learning styles of e-learners in Pakistan. Three independent studies were designed to achieve the goal of constructing a psychometrically sound e-LSS. The process of scale development was highly rigorous, time-consuming, sequential, and systematic. The items of the scale were generated empirically and were administered to a sample of 360 participants. The 48-item scale based on eight distinctive and interpretable factors appeared through factor analysis, that is, the Varimax rotation method. This is the simplest method that predicts the accuracy and comprehensible interpretation of each factor from the infinity of rotations (Kaiser, 1974). In addition, each factor was observed based on the theoretical relevance of items and items content. Keeping in view the factor loading of <0.30 (Field, 2009), two items, that is, items 21 and 25 were excluded from the final scale. The rest of the items, that is, 46 items, was significantly loaded (see Table 1).
The eight factors of the scale showed significant internal consistency and item-total correlations (see Table 2). To determine factor structure emerged through EFA, CFA was used on the sample of 350 participants. As a result of CFA, 18 items were excluded from the final scale, and the final model emerged as a good fit and acceptable indices (see Table 3) with the same eight distinct factors (namely, visual, auditory, kinesthetic, global, analytical, individual, collaborative, and technological type) of learning style scale for e-learners. The positive relationship of e-LSS with LSS (Cohen et al., 2001) supported its convergent validity (r = .37, p = .01). Since the learning styles of e-learners had never been explored exclusively, direct support from the available literature is not possible for our results. However, there is evidence of some circumlocutory support from other studies. The results are consistent with Kolb (2013) revealed in a study that scores on the Kolb Learning Style Inventory 4.0 are highly associated with scores on the previous Kolb Learning Style Inventory 3.1 and maintaining the validity that the instrument has shown over the years.
Negative relationship with SPS (Barkman & Machtmes, 2000) supported the divergent validity of the scale (r = −.18, p = .01). Similarly, a couple of research supported our claim that there was negative a relationship of learning styles with chess players’ problem-solving skills (Sadeghi & Mousavian, 2017), and learning styles, creativity, and problem-solving styles explained disparity among different domains of talent (Woodel-Johnson, 2010). In another study by Şİrİn and GÜzel (2006), problem-solving skills had a negative relationship with abstract conceptualization learning style.
There are various existing learning styles scales, including Dunn and Dunn (1978) Learning Styles; Gregorc (1979) Learning Styles; Honey and Mumford (1989) Model; Kolb (1984) Learning Style Model; Felder-Silverman (1988) Learning Model; and Fleming (2006) VARK model, have been described in the literature. One of the significant models, for instance, Kolb’s representation of learning style, is related to the Learning Style Inventory instrument (LSI) which majorly emphasizes student’s preferences regarding concrete against abstract and action versus reflection (Kolb, 1984). On the other hand, another scale was developed by Honey and Mumford in 1989 known as Learning Style Questionnaire (LSQ). Apparently, the LSI has not adequate validity as well as predictive accuracy in comparison to LSQ. LSQ has expressed learners in four distinctive ways: reflectors, activists, pragmatics, and theorists. It has widely been used for business and management purposes, whereas the application of LSQ for educational purposes has largely been questioned (Curry, 1983). Another scale that is used as an alternative to LSQ is the Canfield Learning Style Inventory, which illustrates learning styles, based on four types, that is, learning conditions, mode of learning, area of interest, and conditions for performance (Canfield, 1992). Likewise, the previous two scales and its applicability for use in academic settings have been questioned.
Another well-known scale of Felder and Silverman was developed for learning style assessment of classroom use and, in the perspective, of engineering education (Felder & Silverman, 1988). The scale consisted of four dimensions each with two attributes of learning. The perceptual dimension includes intuitive and sensory, whereas the input dimension includes verbal and visual. On the other hand, the processing dimension includes reflective and active and the understanding dimension includes global and sequential (Felder & Soloman, 2001). Based on this model, the Index of Learning Survey (ILS) has developed (Felder et al., 2002). In one study, Cook (2005) tried to assess convergence and divergent validity of ILS, and the results revealed that subscales (sequential-global) failed to associate well in both the scales, that is, ILS and LSI with other scales and may be flawed.
Similarly, other learning style scales are intended to assess psychological types or personality indexes (e.g., the Myers-Briggs Index) or perceptual type, that is, the VARK model, that primarily focuses on visual, verbal, and auditory types of learners. These models might overlap and express learning styles in nonspecific methods (De Vita, 2001). The use of such an instrument especially for e-learners (who are different in the context of traditional learners) has been criticized by keeping in view their educational needs and preferences by numerous authors. Therefore, to find out the learning styles of e-learners, the use of such inventories is not suggested (Curry, 1983). Hence, it is a dire need to develop an indigenous scale suitable for e-learners, and additionally, the outcome of such an instrument would permit the course developers to design the course content appropriate for learners of different learning styles.
The e-LSS appeared as a multidimensional measure with eight distinct factors particularly for e-learners in Pakistan. The first, second, and third factors consisted of visual, verbal, and kinesthetic learners (perceptual type), respectively. Visual learning style includes learning with textbooks, diagrams, and pictures (Marcy, 2001), whereas auditory learning style is a style by which individuals learn via listening to tapes, radios, and lectures (Coffield et al., 2004). Favre (2009) defined kinesthetic learners as individuals who involve whole-body movement to process new and difficult information. The fourth and fifth factors comprise global and kinesthetic learners (Cognitive Type). A global learner perceives the whole picture or overall view, while the analytical learner emphasizes the parts that make up the whole picture (Pask & Scott, 1972).
Individual and collaborative learners (Social Interaction type) constitute the sixth and seventh factor of the e-LSS. Collaborative learning is a learning style that engages the learner to perform collectively for problem-solving, task completion, or product creation and assignment making (Laal & Laal, 2012). On the other hand, learners who choose to study alone and take her or his own responsibility for learning refers to the individual learner (Laal & Laal, 2012). The seventh factor, that is technological type, has been markedly revealed in the extant literature as well as a technological factor has emerged as a new and novel characteristic of e-learners while exploring learners during the focus group. It has also been explicit in the literature review that the technological factor has not been part of any instrument assessing learning style. Technological learners are those who understand how to utilize technology in this digital world in their environment. Those learners are able to recognize the importance of technological inventions and the chance it offers the learner in their daily lives (Prensky, 2001). However, e-learners are well aware of the digital language of smartphones, video games, computers, or the internet (Thirunarayanan et al., 2011).
In the light of the abovementioned discussion, it is evident that e-LSS is a reliable and valid measure and will be a valuable addition to assess learning styles, particularly of e-learners in the context of Pakistan. This newly constructed scale of learning style for e-learners integrates widespread categories of measuring learning styles along with its indigenous scope and has sound psychometric properties. While concluding, it can be suggested that the e-LSS is a promising measure having adequate item homogeneity, significant internal consistency, and accepted validity.
Limitations and Suggestions
The following limitations are required to be addressed in future studies regardless of the fact that e-LSS is a valid and reliable measure. First, although the sample size for factor analysis of current work was adequate, however, it was not sufficient for results generalization. It is, therefore, suggested to collect samples from all provinces of Pakistan in the future. In this regard, it is recommended that the sample should be selected from as many cities of Pakistan to obtain a sample representative of e-learners for validation of scale in the future. In this way, validation across diverse cultures should also be done. Second, peer rating was not used to establish construct validity of e-LSS, so it is suggested to use peer rating to assess constructs validity in future studies.
Third, an equal number of participants should be taken for age groups, educational level, and gender which can also influence the research findings. It is recommended for future work to have an equal number of participants to find a clearer picture of the results. Fourth, indigenous norms may be developed in future studies for e-LSS. In addition, the scale is required to be utilized in cross-cultural studies; in this way, the learning styles of e-learners across diverse cultures may be explored. A comparative analysis of e-learners and conventional students will also provide directions for future research.
Despite the limitations discussed earlier, the newly constructed scale seems to have good reliability and adequate convergent validity as well as sound divergent validity. For assessing the learning styles of e-learners in Pakistan, this scale will be useful.
Conclusion
The study was a fruitful effort to develop a valid, reliable, and promising measure of learning style particularly for e-learners in Pakistan. It is important to develop awareness regarding learning styles for effective and efficient learning which allows learners as well as instructors to realize how they learn and enhance their learning process. The scale developed in this study will help learners to explore and identify their style of learning. It is also anticipated that findings will also help instructors to recognize their students learning styles and formulate guidelines that will assist them in their studies.
Footnotes
Declaration of Conflicting Interests
The author(s) declared no potential conflicts of interest with respect to the research, authorship, and/or publication of this article.
Funding
The author(s) received no financial support for the research and/or authorship of this article.