
Abstract
This study is based on data used by a telecommunications industry over a period of 6 months, beginning July 1, 2018, until December 31, 2018. The approached model of customer lifetime value (CLV) was concerned on the sample size of 245,355 records made by cell phones of active prepaid subscribers. The aim of this article is to estimate CLV through survival function with adjusted variables enclosed, for example, marketing cost. To do this, a statistical model was used to predict the individual CLV and confirmed a different finding to some previous study, in which this new finding brings an important message that the telecom providers should take care of customer earlier before too late because after the 10th of tenure, the subscribers can churn the telecom operator’s service. The result of CLV is well supported to segment market. It will also benefit the telecom providers to maintain their market competitiveness.
Introduction
Currently, the telecommunication operators in Vietnam have a positive trend toward investing in a Big Data system, but constraints of exploring and mining Big Data are seemly taken into account. At present, there are three leading telecom operators in Vietnam, for example, Viettel Group as the largest mobile telecom operator with the market share of 51.5%, Vinaphone, known as VNPT with the second-ranked operator accounting the market share of 28.4%, Vietnam Mobile Telecom Services, known as Mobilefone with the third operator with the market share of 12.7% (Dublin, 2020). According to the Ministry of Information and Communication of Vietnam, the industry of telecommunication witnessed a strong growth in 2019, which its revenue reaching $20.2 billion and has an increase of 19% comparing 2018. Traditional services such as calls and SMS messages account for 76.6% of revenue. The commercialization of 5G (Generation) is steps to be concerned about and granted license to the three leading telecom operators, Viettel, Vinaphone, and Mobifone, in which the big cities of Hanoi and Ho Chi Minh City are pilots of 5G technology.
Measuring customer lifetime value (CLV) sounds great, but it is not yet concerned much by telecom operators in Vietnam. We can explain this that these operators can be facing a limitation of behavior analytics and prediction based on quantitative methods, besides, they do not avoid complications of data analytics based on mathematic models. Stemming from those limitations, the need for CLV research is very important, not only to bring results to serve reality but also to contribute the scholarship of the telecom industry of Vietnam.
According to Çavdar and Ferhatosmanoğlu (2018), CLV is a very important metric that can enhance a firm’s understanding of their customers. Using flight data and social network scores to estimate CLV through multiple regressions for airline customers, Çavdar and Ferhatosmanoğlu found that a customer rarely flies but have high social impact. Unlikely, Hajipour and Esfahani (2019) employed delta model to develop CLV, in which RFM, a combination of three elements such as recency (R), frequency (F), and monetary (M), is concerned as the indicator to calculate CLV.
In fact, many scholars take different approaches to calculate CLV in various sectors, where the CLV in the banking sector is concerned by Channa (2019) and Kahreh et al. (2014), in airline business by Çavdar and Ferhatosmanoğlu (2018), in online retail (Jasek et al., 2018), and so on. Although there are many propositions to various models to calculate CLV, two viewpoints are summarized: the calculation of CLV included a participation of acquisition cost and a usage of acquisition practice, such as marketing cost. On the contrary, CLV excludes acquisition cost, and we interpreted it as the largest profitable acquisition cost (Abdolvand et al., 2014; Jain & Singh, 2002).
This study is going to make a difference in using the promotional cost approach as a proxy of marketing costs toward CLV calculation. It combines this usage with the length of service (LOS) of subscriber to support the CLV calculation by each individual consumer. Although there have been studies using customer demographic information (age, education, marital, retired, and gender) to calculate CLV (Y. Chen et al., 2009), the demographic information will not be of much interest in this article, as prepaid subscribers at Vietnam rarely declare full personal information once they register the telephone number or SIM to use. Instead, information about the calls or voice, the number of messages of SMS, churn rate, and top-up of each individual are taken into account.
This article is an extension of Bansal et al.’s (2020) and Y. Chen et al.’s (2009) studies, where the quantitative method is used to predict CLV. The new point of the study does not use the demographics of prepaid subscribers because of the low level of trustworthiness, but past historical data of message, voice, top-up, data usage, and top-up are taken. An explanation of this reason is shown that declaration of personal information (e.g., age, gender, occupation, and residence place) of the prepaid subscribers when registering and buying the new phone number (SIM) is not completely compulsory. Sometimes they are asked at store when buying, but their information provision is not accurate. Even some of them can register two SIMs and can take personal information of their family member to submit.
The second new point in this study is that besides prepaid subscribers’ past consumption considered, the CLV approach model also uses the LOS of subscribers, customer churn rate, and marketing cost. These variables are employed in the model of survival model to predict individual CLV, while Y. Chen et al. (2009) did not concern those when applying the survival mode. In addition, this study proposes a novel way to fill a gap with Y. Chen et al.’s (2009) study and enroll arguments of Channa (2019) to estimate the CLV.
Continuously, the finding of CLV is a further step to support market segmentation through a matrix development based on a combination of LOS and CLV to overcome the traditional approach because these two indicators are dynamic variables (Mosaddegh et al., 2021). The results will be a quite supported reference for telecom operators who can use it in future as well as for researchers to give constructive comments.
This study aims to fulfill the following objectives: (a) review-relevant studies so as to support arguments, (2) literature review is concerned toward employing statistical model; (3) research methodology; (4) empirical analysis to estimate the CLV through a quantitative model so as to initiate market segmentation, and (5) discuss findings and think of possible campaigns.
Literature Review
As popularized by Kim et al. (2006), the study of the CLV is understood to be the study of a customer’s lifetime value, customer equity, and customer profitability. Pfeifer et al. (2005) argued that CLV is the present value of future cash flow that is associated with a customer; it considers the time value of money using the discounting and traditional present value technique.
As argued by Segarra-Moliner and Moliner-Tena (2016), the firm concerns more to measure on an individual customer toward the best-desired performance. This is a reason why marketing managers pay more attention to know individual customer information.
According to discussions of Gupta et al. (2006), six modeling approaches that several researchers concerned to estimated CLV are: (a) RFM model; (b) probability models that its building focus is to describe and predict the observed behavior through regression model; (c) econometric models that it uses hazard models to estimate customer retention; (d) persistence models that components of acquisition, retention, and cross-selling are concerned and can be predicted through long time series; (e) computer science models; and (f) diffusion/growth models.
To obtain dynamics of customer segments in the banking sector, Mosaddegh et al. (2021) had a first approach step toward CLV calculation, which the model of RFM is employed. CLV is not only a significant contribution toward market segments but also support marketing campaigns, due to the real value of each customer is measured. Based on a practical study, Méndez-Suárez and Crespo-Tejero (2021) answer a question of why unprofitable customers are in needs to be retained in the bank sector. To do this, they apply real option theory, introduced by Myers (1977), to identify the CLV. While Hajipour and Esfahani (2019) use the triangle with three elements of total customer solutions, lock-in system, and best product as the delta model to develop CLV. The model of RFM is directly used on 13,108 real bank customers and 1,182 legal customers to address CLV. Then the customers are divided into different groups based on using the algorithm of K-means. But this market segment only focuses on three indicators of RFM, without demographic characteristics of customers and dynamic variables (Mosaddegh et al., 2021).
Actually, using CLV to support market segment is used in previous studies, which Monalisa et al. (2019) had that for paint industry, then market segment is carried out. Similarly, Khajvand and Tarokh (2011) and Khajvand et al. (2011) also used RFM to measure CLV in retail banking and toward the market analysis. Based on those research method, this article also aims segments of market after CLV of individual prepaid subscribers is predicted.
While Fader et al. (2005) joint RFM and CLV toward customer base analysis. Rosset, Neumann, Eick, and Vatnik (2003) concerned three components, for example, customer’s value over time, LOSs of customers, and a discounting factor to calculated the CLV
As defined by Chamberlain et al. (2017), the net returns of the CLV during a period can be predicted over 12 months by training random samples on historic data. The calculation of the CLV in earlier papers is based on RFM (Safari et al., 2016) and (Hajipour & Esfahani, 2019). While Haenlein et al. (2007) estimated the CLV for retail banking using the first-order Markove chain modeling and CART (classification and regression tree) on 6.2 million data sets. The result of the study was helpful for the market segment. But, Donkers et al. (2007) predicted the CLV of the insurance industry using a model by Berger and Nasr (1998) where the relationship level of customer retention and profit was aggregated across services. Hwang et al. (2004) employed the statistical model to estimate the CLV of individual customers in the wireless telecommunications industry. The researchers focused on looking at three segments: current value, potential value, and customer loyalty. Their models used past profit contributions and the expected future cash flows of individual customers by periods (and not survival analysis) to estimate the risk of churn rates as the retention rate. The models used by these earlier studies just mentioned above have a common point with little on to apply the CLV estimation using statistical models.
Unlikely, Y. Chen et al. (2009) adopted Cox’s proportional hazards model using the survival-analysis method to improve the CLV model. To do this, these authors used 1,000 records extracted from the customers’ data which comprised verified attributes that also include demographic variables such as age, marital status, education, employment, retirement, gender, and so on to predict the CLV and the churn rate. But, one point that the model of Y. Chen et al. (2009) does not approach the average amount of service charge asked to pay for a customer and cost of marketing activities. This can be bias to calculate CLV because CLV is defined as the present value of the future cash flows associated with a customer (Channa, 2019), it also allocates marketing expenditure and identifies different service activities to take care of customers with the high and low profit contribution (Chamberlain et al., 2017).
Application of CLV Toward Market Segment
According to arguments of H. Chen et al. (2019), market segmentations based on demographic factors, consumer behavior, and psychology are popular for the customer heterogeneity measurement, while the market segmentations based on inheritance results of genetic algorithm are not popular, particularly for the telecommunication sector. To reach customer segment dynamics, Mosaddegh et al. (2021) used Big Data analytics on bank customers during 42 consecutive months of 34 million clients and measured the real value of each customer as CLV based on the variables of RFM. After that, market segment is conducted by the popular clustering algorithms of classification method, for example, K-means.
Based on the segmentation method of Kim et al. (2006), Hwang et al. (2004) and Cuadros and Domínguez (2014) developed an approach to segment customers by CLV calculation. However, all of them have not concerned information of personal consumption behavior of customer. Cuadros and Domínguez (2014) calculated CLV based on the gross income, measured as the amount value bought per price paid of the customer and the relationship cost (with the customer) corresponding to the all costs associated with the customer. Then, the customer segments are ranked to insure the segment value for the company, they base this on the contributed value of CLV level.
While Hwang et al. (2004) employed CLV calculation based on the CLV model combined with three indicators to measure customer value, such as current value, potential value, and customer loyalty toward market segmentation to support the marketing strategies, Kim et al. (2006) had arguments on how to obtain market segmentation, in which using CLV classification to segment customers into three categories: (a) segmentation by recruiting only CLV, (b) segmentation by employing components of CLV, (c) segmentation by concerning both the value of CLV and other information.
Unlikely, once CLV in this article is measured, then the market segmentation is concerned and overcomes the traditional approaches using dynamic the matrix of two components, for example, the tenure as LOS of customer and CLV, as dynamic variables (Mosaddegh et al., 2021), in which the indicator of LOS is employed as a new explored suggestion and CLV (Cuadros & Domínguez, 2014; Hwang et al., 2004; Kim et al., 2006). Each component has two poles of low and high. Accordingly, four segmentations are developed, called as: (a) “switcher” based on the cell combined by low LOS and low CLV; (b) “keepers” based on the cell combined by low LOS and high CVL; (c) “development” based on the cell combined with high LOS and low CLV; (d) “high value” based on the cell combined with high LOS and high CLV.
In sum, based on inheritance of previous scholars, such as Bansal et al. (2020) and Y. Chen et al. (2009), the historical data of prepaid subscribers involved in voice calls, SMS, data, and top-up are recruited in the quantitative model. Also, information about churn rate and the difference between average revenue per user (ARPU) and cost of promotion (proxy of acquired costs) (Donkers et al., 2007) are concerned. Using demographic information for prepaid subscribers in Vietnam to predict CLV can cause a hole in the CLV prediction, as those people rarely give correct personal information during registration, even some of them have a use of two telephone numbers (two SIMs) at the same time.
Methodology
Data Selection
A total of 245,355 records of prepaid subscribers were extracted from the Big Data of a telecommunications company located in Vietnam. In this study, active subscribers with a service of 3 months or less were excluded because the behavior of these users are considered as not stable (they can be foreign tourists, foreign business man, local users with two SIM who had taken advantage of the instant promotions, etc.). Fields employed in the model include the expenditure of prepaid subscribers such as voice calls, SMS, data, churn rates, LOS, ARPU, and cost of promotion as proxy. Voice calls were measured by the duration of the calls, SMS was measured by the number of messages, and data were measured by the amount of kilo bytes. Sampling was randomly selected from 1% of the entire customer-base taken from the population of the telecommunications operator. The months were considered for collecting data so as to measure customer survival as churn behavior for a period of 6 months, from July 1 until December 31, 2018. The SPSS Modeler was used for the data assessment.
Conceptual Model
As mentioned previously, the model applied in this article is an extent of (Rosset, Neumann, Eick, Vatnik, & Idan, 2003), which the survival model is taken into account. But the difference in utilizing the survival model is that ARPU and the promotion cost that are calculated for each individual subscriber is admitted to the research model, while this of Rosset, Neumann, Eick, Vatnik, and Idan (2003) do not have. In sum, the quantitative model is the survival probability of customers with regards to factors of the LOS and a discounting one r (describing a predetermined discount rate of current value and future value), in which LOS describes the probability churn of customer over time. This is usually defined by a survival function h(t) for
To approach the hazard model or hazard function, Cox’s regression model was deployed. This model looks at customer’s relationship and the duration/LOS as central ingredients of the probability of predicted retention. To predict churn of customer, Hassouna et al. (2015) developed churn modeling techniques of logistic regression and decision tree, in which they concern variables of data usages and voice usages to investigate how changes in those to the churn situation. To calculated CLV, then toward market segmentation in the telecommunication industry, Aheleroff (2011) employed service usage of voice call, SMS, data. Rosset, Neumann, Eick, Vatnik, and Idan (2003) concerned covariates of usage history, payment history to model CLV.
Based on previous approaches of scholars and behavior of subscribers on using voice call, SMS, and data, these information are concerned in the survival model. In this context, voice calls were measured in seconds for each call made, SMS is measured by the number of messages and data were measured by the number of KB (kilobyte) used by the subscribers who were using the 3G (third-generation technology) cell phones to access the internet, music, entertainment programs, and others.
The CLV is dependent on the monthly margin, while Donkers, Verhoef, and De Jong (2007) and Gupta et al. (2006) concerned with the profit contribution of each individual of that period of time. In the context of this article, the monthly margin of each subscriber was represented by the difference between ARPU on the monthly average and the acquired costs for maintaining current customers as well as prospective customers. In addition, the promotion cost (per user during period studied) serves as the proxy for cost, as shown in the equation below.

where ARPU is the average revenue per user (sometimes known as average revenue per unit) of subscribers and measured in VND (Vietnam dong). COST is the promotion cost per user once the subscriber has taken beneficiary of the promotion program provided by the telecom provider (monthly promotion program, e.g., gold day per month) and a proxy of the monthly promotion cost during the 6 months of study. This cost is meant to maintain the existing subscribers and to acquire new customers, as measured in the VND per user.
r is a predetermined discount rate which measures how much current value is transferred to the future. This rate serves between 8% and 15% of the framework per year. Since recent changes (these came from changes in the inflation rate which went up) in Vietnam’s economy has taken place, particularly during the period of this study, the rate of 10% per year was then defined in this article.
t is the time that a subscriber has been using service (1,. . .,T) (length of service), measured in month, i is subscriber i of period studied, Pi(t) is the series of probability of survival rate (retention rate; survival curve) from month 1 through month T.

where
where
hi(t) is hazard risk at time t for individual i. h0(t) is basic hazard risk (being 0 if independent variables is 0).
The model of proportional hazards derives the proportion of different individuals risk function. The survival rate (as retention rate) was expressed in terms of the percentage of subscribers for a given period of time, based on the registry of the stating date. Survival rates are important for service because the rate is based on the samples as a whole or as an individual who stays shorter or longer with the service provider due to promotional campaigns.
To estimate the survival function, the LOS of subscribers and the churn rate are indispensable where LOS is the number of months the subscriber is using the services of the company, calculated from the first active day. Rosset, Neumann, Eick, Vatnik, and Idan (2003) had arguments on LOS and show whether the customer commits not to leave if the incentive is accepted, this causes an effect on customer’s lifetime. Customer retention level is derived from churn rate (Hwang et al., 2004). Churn rate is a dummy variable or target variable (1 being churn and 0 being not churn), it defines customers who terminate their relationship with a company in a given time period.
Empirical Results
As stated previously, the CVL in (a) was obtained once the survival model is deployed. This means that function (b) was estimated. Accordingly, the result shown in Table 1 depicts the case of the processing summary of the survival model. It shows which events were measured as churn rate and this accounted for 23.4% of the total samples, which were equivalent to 245,355 prepaid subscribers. Another sample measured as “Censored” represent subscribers who were still using the services of the telecommunications company and they accounted for 76.6% of the total.
Case of the Processing Summary of the Survival Model Approach.
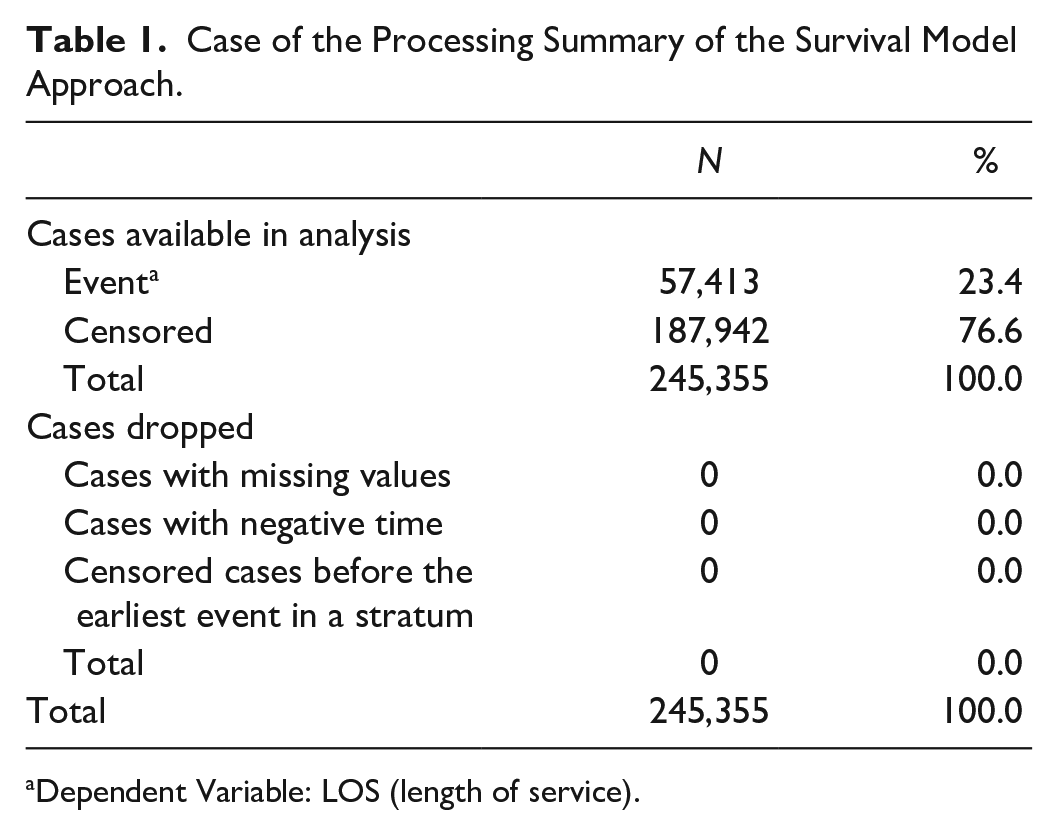
Dependent Variable: LOS (length of service).
Cox’s model was used to show that the survival ratio and the hazard ratio were under different covariate values as noted in Figures 1 and 2, respectively. The detailed survival result was evaluated by different periods. Its high churning rates were noted at the quick decreasing curve (Figure 1), while the hazard function is opposite; it presents the increasing curve at the low churning rate (Figure 2). Accordingly, in the first 12 months, subscribers were seemingly not churned because the cumulative survival rate was close to 1 and the cumulative hazard was near 0. However, there was a negative change in the survival rate from the 13th month onwards until the 60th month. In particular, the survival rate that rapidly declined to almost zero for LOS was at 60 month, whereas the cumulative risk was opposite, it showed a rapid increase in churn risk at LOS of 40 months up. Consequently, subscribers with LOS of 60 months and above showed quite a low survival rate.

Cumulative survival by LOS.

Cumulative hazard by LOS.
Based on function (a), the CLV was estimated and the statistics showed that it presented the right information of the subscribers’ (customers) contribution to the company’s profit. Particularly, the CLV’s calculation was dependent on the survival rate as well as the hazard rate of subscribers. As seen in Figure 3, the mean value of the CLV of subscribers was, seemingly, at 45,000 VND (equivalent to 2 USD) with the LOS of 36 months (equivalent to 3 years) and this shows a stable churn. Thus, it may be said that the higher the LOS is, the lower the churn rate happens with the higher CLV. Hence, it can be seen that once the subscriber is maintained, it also provides more CLV to the company.
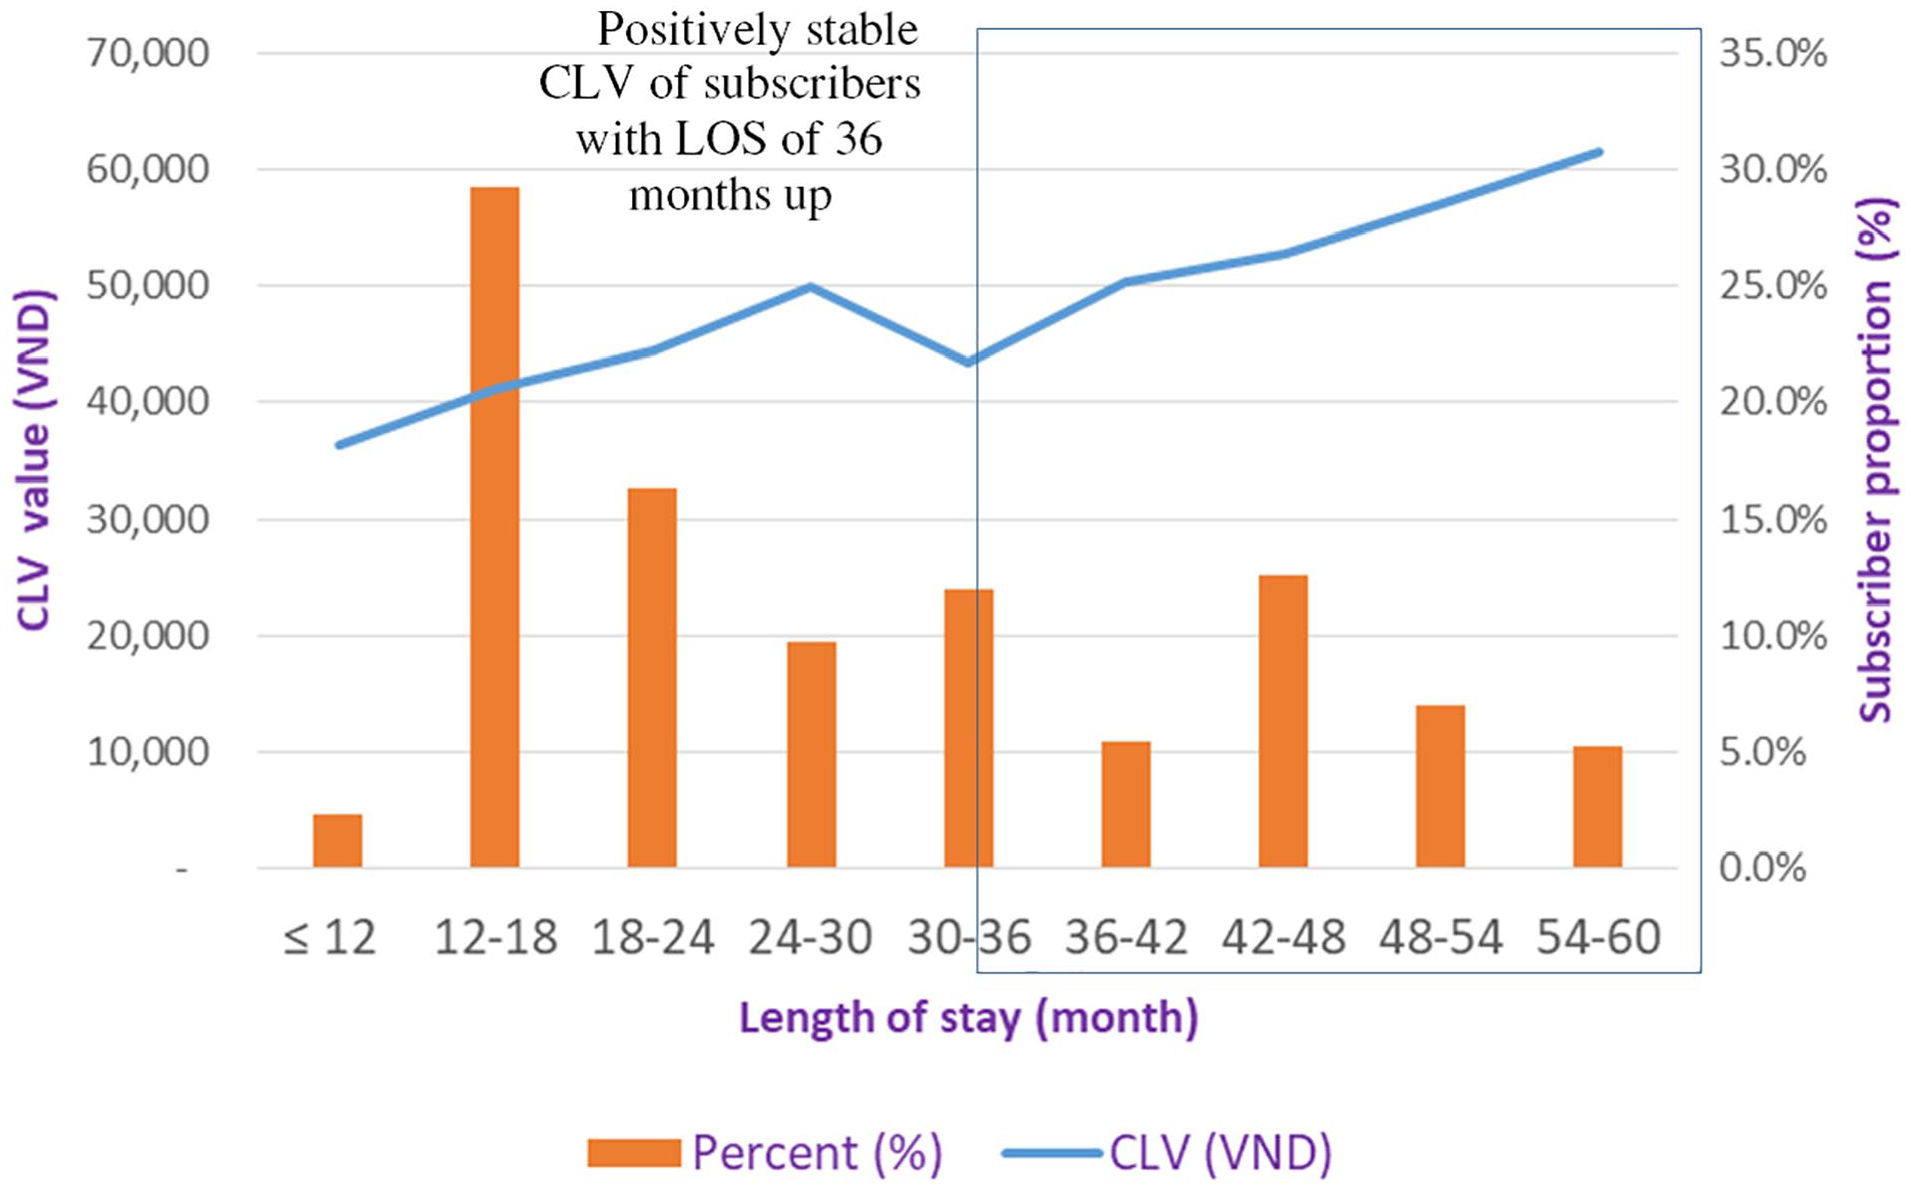
CLV of subscribers by LOS.
Based on the estimated model of the survival function and the CLV calculation, the method of market segmentation was developed. As stated previously, four segmentations were deployed where high and low CLV were divided by the CLV mean of 45,000 VND (equivalent to 2 USD) while the short and long LOS was classified by the LOS of 36 months. This separation is based on the stable contribution of the CLV and the churn rate (Figure 4).
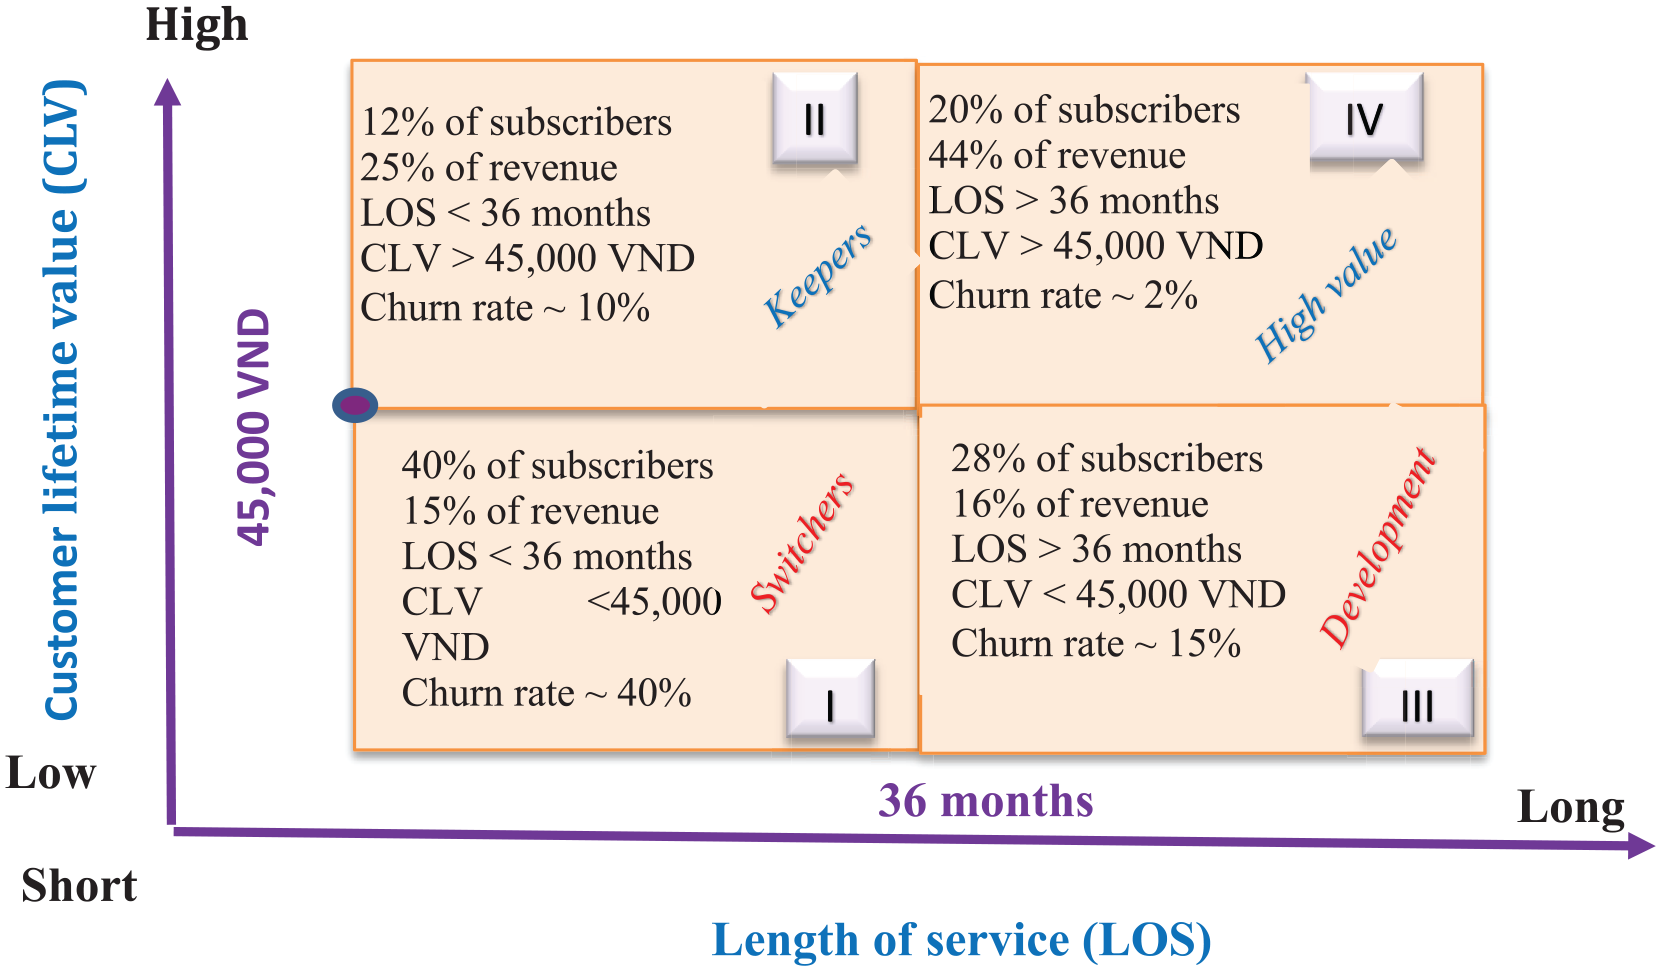
Segmentation matrix based on CLV and LOS.
Marketing strategies play an important role in building the campaigns and promotions for the telecommunications industry. This is because once the market segmentation and positioning become stabilized and attract the attention of the target group of clients, the clients become loyal customers. Thus, the marketing programs will help to improve the efficiency of maintaining clients and in expanding the market share.
Call switchers, the first segment (Cell I), is a combination between the LOS ≤ 36 months and the CLV ≤ 45,000 VND because of the behavior of unstable subscriptions. This is also the time where subscribers who had joined earlier leave the network. As a result, this group accounts for the highest proportion (40%) of the total subscribers churn rate.
The second segment (Cell II) is a combination between the LOS ≤ 36 months and the CLV > 45,000 VND. This segment presents the behavior of customers who are involved with using the service as a form of experience (experienced users). Thus, its consumption adds a high contribution to the firm although the LOS of subscribers may be less than 36 months. Consequently, the total subscribers of the second segment amounted to 12%, with a churn rate of 10%.
The third segment (Cell III) is a combination between the LOS > 36 months and the CLV ≤ 45,000 VND (equivalent to 2 USD) called the “development.” As noted in the matrix, subscribers of Cell III accounted for 28% and this contributes to 16% of the total revenue with a churn rate of 15%. Although this group has high LOS, its CLV contribution is lower than 45,000 VND. This may be attributed to some reasons such as subscribers having two SIM cards, one to keep communications and the other to make calls and to re-charge credit from promotional programs. In sum, subscribers with a low CLV and a long LOS pay more attention to the promotion programs.
The fourth segment (Cell IV) is based on the combination between the LOS > 36 months and the CLV contribution of customers > 45,000 VND. This segment is evaluated as high value due to the positive contribution made to the firm contributed by the low churn rates. As shown in the matrix, subscribers of Cell IV accounted for 20%, bringing the highest share (40%) of the total revenue. In addition, this segment was also evaluated to be the most successful area of the firm, with a low churn rate of 2%. Once subscribers of others segments (e.g., Cell I, Cell II, and Cell II) enter this segment (Cell IV), it brings a positive signal for the telecommunications company. However, it remains to be important for the company to develop marketing strategies so as to maintain and attract such customers.
Discussion
The outcome noted from this study showed that there were some differences in the survival rate when compared to previous studies. Without using the monthly margin of each subscriber, Y. Chen et al. (2009) found the survival rate to rapidly decrease from the 10th month onwards, whereas in this article with the usage of monthly margin of the difference between the ARPU and the acquired costs of maintaining current customers, we observed a little difference from the phenomenon to commence from the 13th month.
In addition, with the application of survival analysis which the demographic factors of age, income and occupation of consumers in the telecommunication industry, Bansal et al. (2020) found a significant evidence that overall average survival time for the subscribers are more than 20 months, this means the churn rate increase from the 21th month onwards.
The difference in the survival rate by time between this article and the previous findings of Bansal et al. (2020) and Y. Chen et al. (2009), which brings an important message that the telecom providers should take care of customer earlier before too late, because after the 10th of tenure, the subscribers can churn the telecom operator’s service. Using attributes of gender, retire, age, marital status, education, and so on to predict CLV of Y. Chen et al. (2009) and Bansal et al. (2020) can cause a bias for the Vietnamese telecommunication providers because prepaid subscribers in Vietnam often have a free choice to buy SIM (not limited in registration frequency for new SIM). As a result, the use of consumption behavior of voice, SMS, top-up and data usage during 12 months (Cuadros & Domínguez, 2014); Chamberlain et al. (2017) are appropriate for a different culture among countries.
Further to this, Pfeifer et al. (2005) developed a market segmentation which comprised six segments but this article focused on only four segments. The result noted in each segment was deemed to be of real value, and the long-term relationship with customer was noted to occur when the marketing paradigm was really involved with each segment.
Another prominent difference of this article when compared to previous studies is the approach of the survival model deployed for the CLV calculation. Here, the survival rates were also noted as hazard rates of subscribers, while previous studies, for example, Monalisa et al. (2019), Khajvand and Tarokh (2011), and Khajvand et al. (2011) employed mathematic methods of RFM. They were found to contribute to the estimation of the CLV. Because of using the CLV model, the statistical model could derive a significant result. This is an academic contribution and a good reference for the telecommunications provider.
The prediction of CLV from the survival model is a meaning and important step to support the market segments, which the four subscription segments were noted. Of these four, it appears that segment IV was of the most valuable because once subscribers have taken to this segment, they tend to stay as loyal customers. It appears that when the LOS is higher, the churn rate is lower and this brings a higher CLV to the firms.
Conclusion
Using the sample size of 245,355 prepaid subscribers who were randomly selected from the entire customer base of 34 million subscribers in the firm who were also active customers of the cell phone, the survival model deployed was observed to be appropriate. Accordingly, the survival model gave a positive result in the use of spending-related parameters of subscribers such as ARPU and the company’s promotion costs to contribute to each customer’s CLV calculations. Unlike previous studies conducted, demographic-related customer personal information will not be included in the research model because the use of personal information of prepaid customers in Vietnam will not be highly accurate, as the majority of these prepaid subscribers often do not provide personal information fully and honestly when claiming a SIM card purchase. Even a person can use two different SIM cards, as a formal and informal SIM card. This also comes from the increased interest in sales of telecom providers in Vietnam, so these companies ignore the buyer process and make a declaration.
As such, the results of this study will have a high level of accuracy in CLV calculations because the variables explained included in the survival model are just information related to subscribers’ consumption history of calls, SMS, top-up, and data usage. In addition, using the survival model creates a concrete mathematic, less bias and ensure minimum level of uncertainty. Continuously, four segments were developed after CLV calculated, in which the segment with high LOS combined with high CLV was observed to be a big contribution to the firm’s revenue, particularly the low churn rate. Once the market segment is established, it will be the basis for telecom service providers to have competitive strategies and effective customer care programs, especially to limiting the promotions that cause spam to customers.
Research Limitations and the Future Work
The calculation of CLV in this study is not clearly explained to the purchasing frequency of the overall service consumption. Although CLV supports the realization of market segmentation and shows the types of customer groups. But implementing the proposed strategy is the future work of research. In addition, in the future work, the research will also continue to explore the churn risk of subscribers depending on what type of service, for example, depending on SMS or voice or top-up or data usage.