
Abstract
This article examines the effectiveness of using online survey methods in planning research. This study measured travel behavior and physical activity of office workers over a month period. An online travel diary, pedometer, and online survey were used to assess walking levels and transportation habits for office workers. A subset of the sample used a paper travel diary, which was used for comparison. Analysis of missing data was performed to explore implications of using online survey methods. Using online travel diaries and surveys to assess objective and subjective data can help to reduce recall bias, missing data, and greater flexibility survey administration.
Keywords
Introduction
Paper surveys are going the way of the rotary dial telephone, as the glow of computer screens and cell phone displays becomes a familiar sight in more and more U.S. households. Metaphors of transport dominate discussion of information technology, but new technologies do not always inform planning practice and research. Within this research arena, using online-based systems will continue to improve both the quality of data and mechanisms for data collection. This shift in technology is particularly relevant for measuring public health perceptions about the built environment and transportation, thus improving effectiveness of planning work. Traditional studies in transportation planning focused on paper travel diaries to collect trip information, while public health research often relied on phone or paper surveys for self-reported perceptions of behavior. Paper surveys and paper diaries can be effective in reporting both activity and perceived impacts on physical activity, but researchers tolerate the flaws inherent to these methods. Participants lose paper surveys amid floods of direct mail marketing. Cellular phones are quickly replacing landlines, creating increasingly flawed samples based on landline phone lists. Time delay in completion of paper surveys or diaries also reduces the accuracy of the data based on recall issues. The time has come for planning researchers to reconsider their Luddite attachment to old survey forms as exclusive tools for gathering travel data. To this end, this study explores how online survey and travel diary tools are compared with paper surveys and diaries when assessing walking behavior for a targeted group of office workers. This analysis will illustrate the potential methodological advantages of online self-report mechanisms used in concert with objective measures.
Theoretical Framework
Technology is one tool for researchers in collecting data about behavior. For research on travel behavior, connecting data gathered as close in space and time to when the behavior occurs improves the recall and accuracy of survey responses, and for passive data collection (e.g., global positioning system [GPS], accelerometers, pedometers), objectivity of the data increases. To obtain useful data on how perceptions of the built environment may influence physical activity, it is helpful to collect responses as close temporally as possible to when the activities take place. In medical research, ecological momentary assessment, or EMA, has emerged from laboratory-based research and shifted assessments to “real world” settings (Shiffman & Hufford, 2001). EMA, as a theory or methodological approach, highlights that accuracy is lost when participants rely on recall to fill out diaries or surveys, particularly when there is extended time between the activity and reporting the activity (Shiffman, Stone, & Hufford, 2008). Minimizing the amount of time between an event or when an environment is experienced and when the assessment is performed assists in the accuracy of the data and improves the validity of the instrument. According to Shiffman, the benefits of EMA include improved generalizability of findings to real-world conditions, avoidance of retrospective distortion, and ability to assess changes in participants more effectively (Shiffman & Hufford, 2001). Researchers using EMA acknowledge the benefit to research using data collection in “ecologically valid environments” or real-world settings where behavior or activity is normally experienced (Berkman, Dickenson, Falk, & Lieberman, 2011; Shiffman et al., 2008). It has become possible to use EMA in research on human behavior due to the availability of key technology options including paper diaries (Gorely, Marshall, Biddle, & Cameron, 2007; Rouse & Biddle, 2010), pagers with paper surveys (Hausenblas, Gauvin, Downs, & Duley, 2008), hand-held computers/personal digital assistants (PDAs; Biddle, Gorely, Marshall, & Cameron, 2009; Dunton & Atienza, 2009; Dunton, Yue, Intille, Wolch, & Pentz, 2011; French, Siewiorek, Smailagic, & Kamarck, 2010; Seekins, Ipsen, & Arnold, 2007), text messaging via computers or cell phones (Berkman et al., 2011; Heron & Smyth, 2010), and basic phone calls (Heron & Smyth, 2010). Although EMA as an approach has gained solid ground within the medical and public health fields, this specific framework may be a new research approach for planners. The attractiveness of this approach for planners is improving the quality of data to be reflective of how people experience and use the built environment, which in turn allows researchers to determine significant correlates related to planning objectives such as improved quality of life, increased physical activity, perceived safety and security of public spaces, and so forth. This approach is also becoming more feasible as greater access to various information and communications technology (ICT) options increase. ICT is the general term for any communication device including cell phones, smartphones, GPS, and computers, which have become commonplace (Stevenson, 1997).
Conventional methods for travel behavior data collection largely continue to include a combination of travel diaries, typically paper, paired with traffic counts to develop a travel demand model based on trip purpose, trips durations, and mode choice. More extensive regional transportation models also have paired paper travel diaries with computer-assisted telephone interview (CATI; Schafer, 2000). The addition of CATI certainly helps to address the accuracy of the data collected and the more timely nature of collecting the data close to when the activity occurred. However, this type of study is expensive and relies on landline-based phone lists for their sampling when used with regional modeling for small and large metro areas. Therefore, obtaining representative, quick, and inexpensive data remains an issue for regional modeling and research (Stopher & Greaves, 2007). Furthermore, this traditional approach has come under fire for accuracy of inputs into the model for the overall transportation system and more specifically for “non-motorized” modes. With non-motorized modes or active transportation modes of walking and bicycling, modeling current behavior and potential shifts in behavior are too fine-grained for the regional transportation modeling techniques and data. Typically, travel diaries for a larger transportation study for a city only include trips that last longer than 10 min. However, walking and bicycling trips often may only be 5- to 10-min long and cumulatively have health benefits that comparable driving trips do not have. Thus, refining our methods to collect data on travel behavior at this finer level requires closer connections to when the activity occurs, following the EMA approach, which is particularly relevant for recall of these potentially shorter trips.
Travel Diaries
Travel diaries are useful tools for transportation researchers in that they collect all the relevant data about travel trips made by a participant in a study, typically for up to 7 days. Travel diaries attempt to increase the objectivity of self-reported behaviors by requiring participants to log all daily trips with data about mode choice, trip departure and arrival times, trip origins and destinations, and trip purpose, with few to no questions about perception (Litman, 1994; Marca, 2002; Targa, Khattak, & Yim, 2003; Wolf, Guensler, Frank, & Ogle, 2000; Zmud, 2006). These diaries also have self-report problems of inaccuracy and incompleteness of the data collected. Frequently found problems include errors in the times of trips reported, omission or addition of trips, delayed completion of diary compromising recall quality, and a lack of information about the route or path choices, as only the origins and destinations are reported (Zmud, 2006). In addition, travel diaries are labor-intensive for the user. The accuracy and completeness are compromised due to how much effort is required by the participant. Despite these issues, travel diaries generally provide needed information on trip data, specifically trip purpose (Greaves et al., 2015). Trip purpose is a piece of data that cannot be derived from traffic counts and is fairly difficult to derive from GPS data collection (Bohte & Maat, 2009). Trip purpose is also correlated to travel mode preferences and thus highlights what opportunities exist to replace auto-based trips with active transportation modes, such as walking and biking (Mackett, 2001; Rodriguez & Joo, 2004). As Greaves et al. noted in their Australian travel study, the increasing use of web-based as well as smartphone diaries allows for researchers to collect the necessary data but reduces the cumbersome and labor-intensive nature of paper diaries (Greaves et al., 2015). Furthermore, they note that the use of web-based surveys and diaries allows for follow-up prompts when data are omitted and subsequently increases completion rates and reduces frustration with diary or survey (Greaves et al., 2015). Furthermore, rarely do these diaries assess participant perceptions of their built environment or connections to land uses. Researchers have clearly identified that land uses, design of public spaces, and features about the built environment such as sidewalk widths, presence of adequate bicycle lanes, and so forth influence walking and bicycling behavior (Atkinson, Sallis, Saelens, Cain, & Black 2005; Clifton & Krizek, 2004; Handy & Niemeier, 1997; Sallis, 2009). Therefore, to decrease the participant burden, increase the completion of responses, improve recall of activity, and address perception and attitudes related to the built environment, moving toward online options to collect travel behavior data can assist in measuring walking and bicycling behavior more effectively than traditional paper travel diary formats.
Measuring physical activity, as a part of daily living and transportation, rather than in idyllic lab settings, is essential to understanding the significant correlates in the built environment that support improved health outcomes and more active modes of transportation. Travel diaries and surveys lend themselves easily to electronic formats and work well with the portable information and communication technologies that are now an essential part of life of many populations. Using the Internet and other web-based tools to collect data is becoming a useful tool for targeted populations and potentially even essential and expected for younger generations (Boyer, Olson, Calantone, & Jackson, 2001; Ijmker et al., 2008). In addition, the interest or inclination of individuals to complete an online survey versus a paper survey is relevant to researchers in this area. A study of Belguim residents on relative interest and attitudes toward online surveys (N = 960) suggested that variables such as the anticipated ease of completion of the survey as well as other behavioural attitudes such as a moral obligation and subjective norms were appropriate with online survey usage (Heerwegh & Loosveldt, 2009). Combining online survey methods with pedometers and accelerometers, the quality of physical activity and travel data can be dramatically improved and recall bias can be similarly reduced.
Recall bias, the concept that individual response is altered as time passes, is a standard concern that researchers in the medical, public health, and transportation fields work to address (Andrews, Nonnecke, & Preece, 2003; Beebe, Locke, Barnes, Davern, & Anderson, 2007; Sax, Gilmartin, Lee, & Hagedorn, 2008). For example, an evaluation study of the use and accuracy of the Stanford 7-Day Recall instrument noted that the bias in the results, when compared with objective data like an accelerometer, occurred between those who performed vigorous exercise and those performing lower intensity physical activity (Richardson, Ainsworth, Jacobs, & Leon, 2001). Therefore, in public health and planning studies that are targeting sedentary individuals, standard paper diaries may not accurately reflect physical activity levels because recall of activity may in fact be underestimated.
In a study comparing paper and online survey non-response issues in the United Kingdom (N = 466), researchers found that non-response rates were not significantly affected by the survey medium (Denscombe, 2009). However, the researchers noted that open-ended responses appeared to be more complete for the online survey medium (Denscombe, 2009). This helps to support that online methods can be a useful tool for data collection with additional benefits of reducing recall bias, costs and time for data entry, ease of distribution among other benefits.
Internet-Based Surveying
Internet-based travel surveys, or travel diaries, began as early as 1999 when Resource Systems Group (2005) performed research for the Department of Transportation to evaluate and identify approaches that improve the quality of the data and the cost of the data collection related to travel choices. Phone or paper surveys have been commonly used to obtain self-reported information related to planning and public health issues (Addy, Wilson, & Kirtland, 2004; Bassett, Cureton, & Ainsworth, 2000; Boyer et al., 2001; Evenson & McGinn, 2005; Giles-Corti & Donovan, 2002, 2003; Humpel, Owen, Iverson, Leslie, & Bauman, 2004; McCormack et al., 2004; Siegel, Brackbill, & Heath, 1995). However, there are the standard issues related to self-reported data, particularly for reporting physical activity, such as social desirability, recall problems, and survey design (Hutto, Sharpe, Granner, Addy, & Hooker, 2008; Motl, McAuley, & DiStefano, 2005; Thomas, 2007; Tudor-Locke & Myers, 2001). Additional findings have indicated that Internet-based surveys for travel diaries result in fewer missing responses and can be presented in a more flexible manner or format that is easily used by the participant compared with paper survey formats (Boyer et al., 2001; Quinn, Robinson, & Parham, 1998). The convergence of technology via Internet-based approaches and EMA methods allows for more robust survey data for both planning practice and research.
Physical Activity Measurement Tools
In addition to online tools, other measures are needed to assess physical activity. To help overcome some of the limitations of self-reported data from surveys and travel diaries, many recent studies have included objective measures of physical activity by using pedometers and accelerometers to measure more accurately and reliably the quantity and intensity of physical activity (Duncan, Schofield, Duncan, & Hinckson, 2007; Elgethun, Fenske, Palcisko, & Michael, 2003; Evans, 2004; Leicht & Crowther, 2007; Schneider, Crouter, & Bassett, 2004; Swartz, Bassett, Moore, Thompson, & Strath, 2003; Tufts University Friedman School of Nutrition Science and Policy, 2005). These tools help reduce recall problems and self-report bias by adding objective and passively recorded data, which can supplement and be compared with self-reported data. Pedometers and accelerometers have contributed significantly to reducing measurement errors and improving the data precision and objectivity.
Newer technology such as wearable GPS units and evolving capabilities of cell phones is becoming a viable tool for researchers of physical activity within the built environment. GPS technology was developed by the Department of Defense and has been used by researchers in public health and physical activity for about 10 years (Elgethun et al., 2003; Perrin, Terrier, Ladetto, Merminod, & Schutz, 2000; Troped, Oliviera, & Matthews, 2008; Wikle & Lambert, 1996). GPS allows route analysis at a disaggregate level, thus improving our ability to understand the route and location choices for physical activity. This is useful both in identifying characteristics or correlates of the built environment that facilitate walking and biking but also in policy decisions for transportation investments (Rodriguez & Joo, 2004).
Along with Internet surveying and GPS units, cell phones are also a promising addition to health and transportation planning research. Wiehe et al. completed a study of 15 adolescent women using GPS-enabled Blackberry phones to assess the ability to use cell phones to connect the physical environment with health-related behaviors (Wiehe et al., 2008). Wiehe et al. confirmed that GPS points collected using cell phones accurately reflected the actual paths of the participants during the study (Wiehe et al., 2008). GPS data through cell phones provide an objective assessment of location, speed or intensity, and duration of activity following EMA principles in reducing recall bias as well as being an objective measurement. The proliferation of smartphones is enabling wider usage with more populations. However, income, education level, immigrant status, and other socio-economic factors may still mean planners and researchers cannot rely solely on smartphone or cell phone methods.
Despite the flaws in online surveying and other technologies, these advancements continue to increase our ability to follow EMA principles and increase accuracy and ease of data collection for both researchers and planning practitioners alike. There are, however, additional limitations to online surveying and other technologies related to the target population of a particular study. Although online travel surveys, smartphone aps, GPS units, and technological tools may increase the quality and accuracy of data for travel behavior, they of course are not appropriate or sufficient in all populations. Access to computers and online surveys may in fact be increasing even in our socio-economically disadvantaged populations. “In 2013, 83.8 percent of U.S. households reported computer ownership, with 78.5 percent of all households having a desktop or laptop computer, and 63.6 percent having a handheld computer” (File & Ryan, 2014, p.2). However, disparity in rates of access continues where Black and Hispanic households were reported at 75% and 79%, respectively (File & Ryan, 2014). Surprisingly, households with less than US$25,000 income reported 62% access to a computer and 48% access to the Internet (File & Ryan, 2014). This does show that important access to technology remains, but with the integration of technology for school-age children over the last 20 years, access, comfort, and proficiency with online surveying may be heading in a positive direction.
The study of behavior in targeted populations still requires the researcher to understand which tool works more smoothly for that group. In many cases, choices to use paper surveys or travel diaries, with the inherent flaws, may in fact be the only real approach for a given community, specifically, because access to digital technology is only part of the problem. Use and understanding of the technology can also be a barrier to some populations, often due to socio-economic disadvantages (Hsieh, Rai, & Keil, 2008). Mixing methods of data collection, while certainly complicating the way the data may be modeled statistically, may also help to give insight into travel behavior using technology and conventional methods. However, using a tool that makes the process smoother, easier, and assessing behavior temporally more close to the activity is still relevant to populations that we may note as disadvantaged. For instance, a paper diary may not be filled out by your participants the day the activities occurred. In fact, paper travel diaries may be filled out the day before they are turned in to the researcher. Mechanisms to increase the accuracy of the data collection can include phone-based surveying for those not using online survey. The same questions can be asked related to trips at key times in the day. Certainly, this requires that the individual has a phone and/or can take calls during the day. For target groups, sacrificing the number of days of data collection and creating a community meeting where researchers assist participants in recording travel behavior through interviewing, online survey, paper survey, or some combination of all these techniques may be needed to accurately profile the travel behavior of these groups.
The benefits of online surveys for travel behavior, particularly for bicycling and walking behavior, include the ability to ask more questions about reasons for and against a mode choice, temporally more connected to when activity occurred, and higher response rates. Given the dearth of information in many communities on walking and bicycling travel behavior, establishing baseline data and reasons for and against these modes helps begin the process of planning for these modes and identifying effective strategies to increase mode share. Clearly, one tool or method will not work for all populations, and care to address travel behavior in a diversity of groups is critical to any potential policy decisions. However, online surveys have benefits to planning research and specifically for research in active transportation modes where simple counts do not fully assess factors on why and when these activities are selected.
Online surveys allow the researcher to monitor when submittals of time-sensitive responses are or are not received to prompt participants and maintain minimal time between event or activity and recording appropriate data. In addition, online surveying allows researchers and practitioners to more readily see problems participants are having during the study period as they record data rather than uncovering unusable data after the study period has concluded. This study will explore how online surveying contributes to improved data collection and the benefits of considering this method for research and practice with appropriate populations and more specifically assessing walking behavior to gain better understanding of behavior for this travel mode.
Method
The original data for this article were collected as a part of a larger project studying walking behavior of office workers in different land use settings, which also included testing an intervention to encourage increased walking trips. In this article, I reconsider the methodological consequences of the use ICT as a research strategy (Valcanis, 2011; Warren, Davies, & Brown, 2008). Although methodological innovation was not a goal of this original research design, the findings nevertheless illustrate the clear benefits of new technologies, specifically online surveying, as they reduce recall error and simplify the collection and maintenance of data. Exploring the use of online survey was a component of this study on walking behavior for office workers. Of particular interest was improving the completeness of the data and how this flexible format may improve response rates and accuracy of recorded data by participants.
Use of Online Survey and Online Travel Diary With Office Workers in Texas
The sample for this study included office workers in urban and suburban land use settings who primarily work at a desk, have Internet access, and do not have a physical disability preventing them from walking up to a minimum of 10 min.
Data collection was done for a baseline survey and a travel diary using an online survey software (SurveyMonkey). Phase I of the study was the completion of the baseline survey, which assessed self-report walking behavior, perceptions of the land uses, built environment near the office site, and other individual factors. Phase II of the study involved completing an online travel diary over the course of 1 month and paired with a pedometer to measure walking steps as an objective measure.
From this study, the goal is to review the effectiveness of online surveying for assessing physical activity levels. Important evaluation criteria included response rate, completeness of surveys, ease of use for the participant, ease of data processing for the researcher, and the ability to follow-up on responses in a timely fashion.
Sampling Design
In the selected office settings, an overall sample frame population of office workers totaled less than 8,000 employees. A sample size of 392 employees was targeted. Approximately 1,000 randomly selected employees at each selected office setting (urban and suburban land use settings) received an initial mailed recruitment letter (N = 1,953). The expected response rate based on the experience of the staff in human resources was estimated to be 20%. Oversampling was performed to insure an adequate sample. The baseline survey was emailed, and participant responses were monitored.
Recruitment
Randomly selected participants from the sample frame were mailed recruitment letter on formal letterhead. The letter contained a web address to connect to the initial baseline survey (Phase I); a follow-up email was sent to the participants a week after receipt of the hardcopy letter. Initial questions in the online survey assessed eligibility for the overall study. Eligibility requirements included office workers who were 18 years or older, performed primarily sedentary work daily, had access to email and Internet, and had no physical disabilities that prevented them from walking up to 10 min bouts. Participants completed an online baseline survey (Phase I), which assessed self-reported physical activity levels, perception data, and socio-demographic information. Participants in Phase II completed an online travel diary, but the travel diary was also made available in a traditional paper format. Online travel diaries were monitored during data collection days. Participants who did not record data by the end of the day were emailed no later than the following morning as a follow-up to prompt completion of the data entry and to offer assistance. Participants also were encouraged to email the researcher during data collection time period to ask any questions regarding a particular trip or data entry issue. Participants were given a US$25 gift certificate and the pedometer used in the study as a small incentive.
Of the 1,953 possible participants, 94 respondents were ineligible due to physical disability, faculty or student status, or the nature of their work. This reduced the pool of possible participants to 1,859. There were 168 partially completed surveys and 507 fully completed Phase I surveys. A mini-exit survey was provided to those who did not wish to participate. There were 65 respondents who completed the exit survey to assess dropout bias. The response rate was calculated using the American Association of Public Opinion Research (2003) Outcome Rate Calculator, which resulted in a response rate of 34.9%, which accounts for non-responses, refusals, and ineligible participants.
For Phase II, 540 participants, who completed the baseline survey in Phase I, indicated willingness to participate in the travel diary portion of the study. Due to the intensive nature of recording every trip for a total of 6 days, a high dropout rate was expected. Total completion of all 6 days with usable data was 320 (approximately 60% response rate).
Results
The online baseline survey yielded a high level of completed questions (average rate of completion for each question = 73%; total of 60 questions). Table 1 shows the baseline survey questions and percent completed; essentially, this shows the questions not skipped by the participant, from Phase I of the study.
Online Baseline Survey Question Completion Percentages.
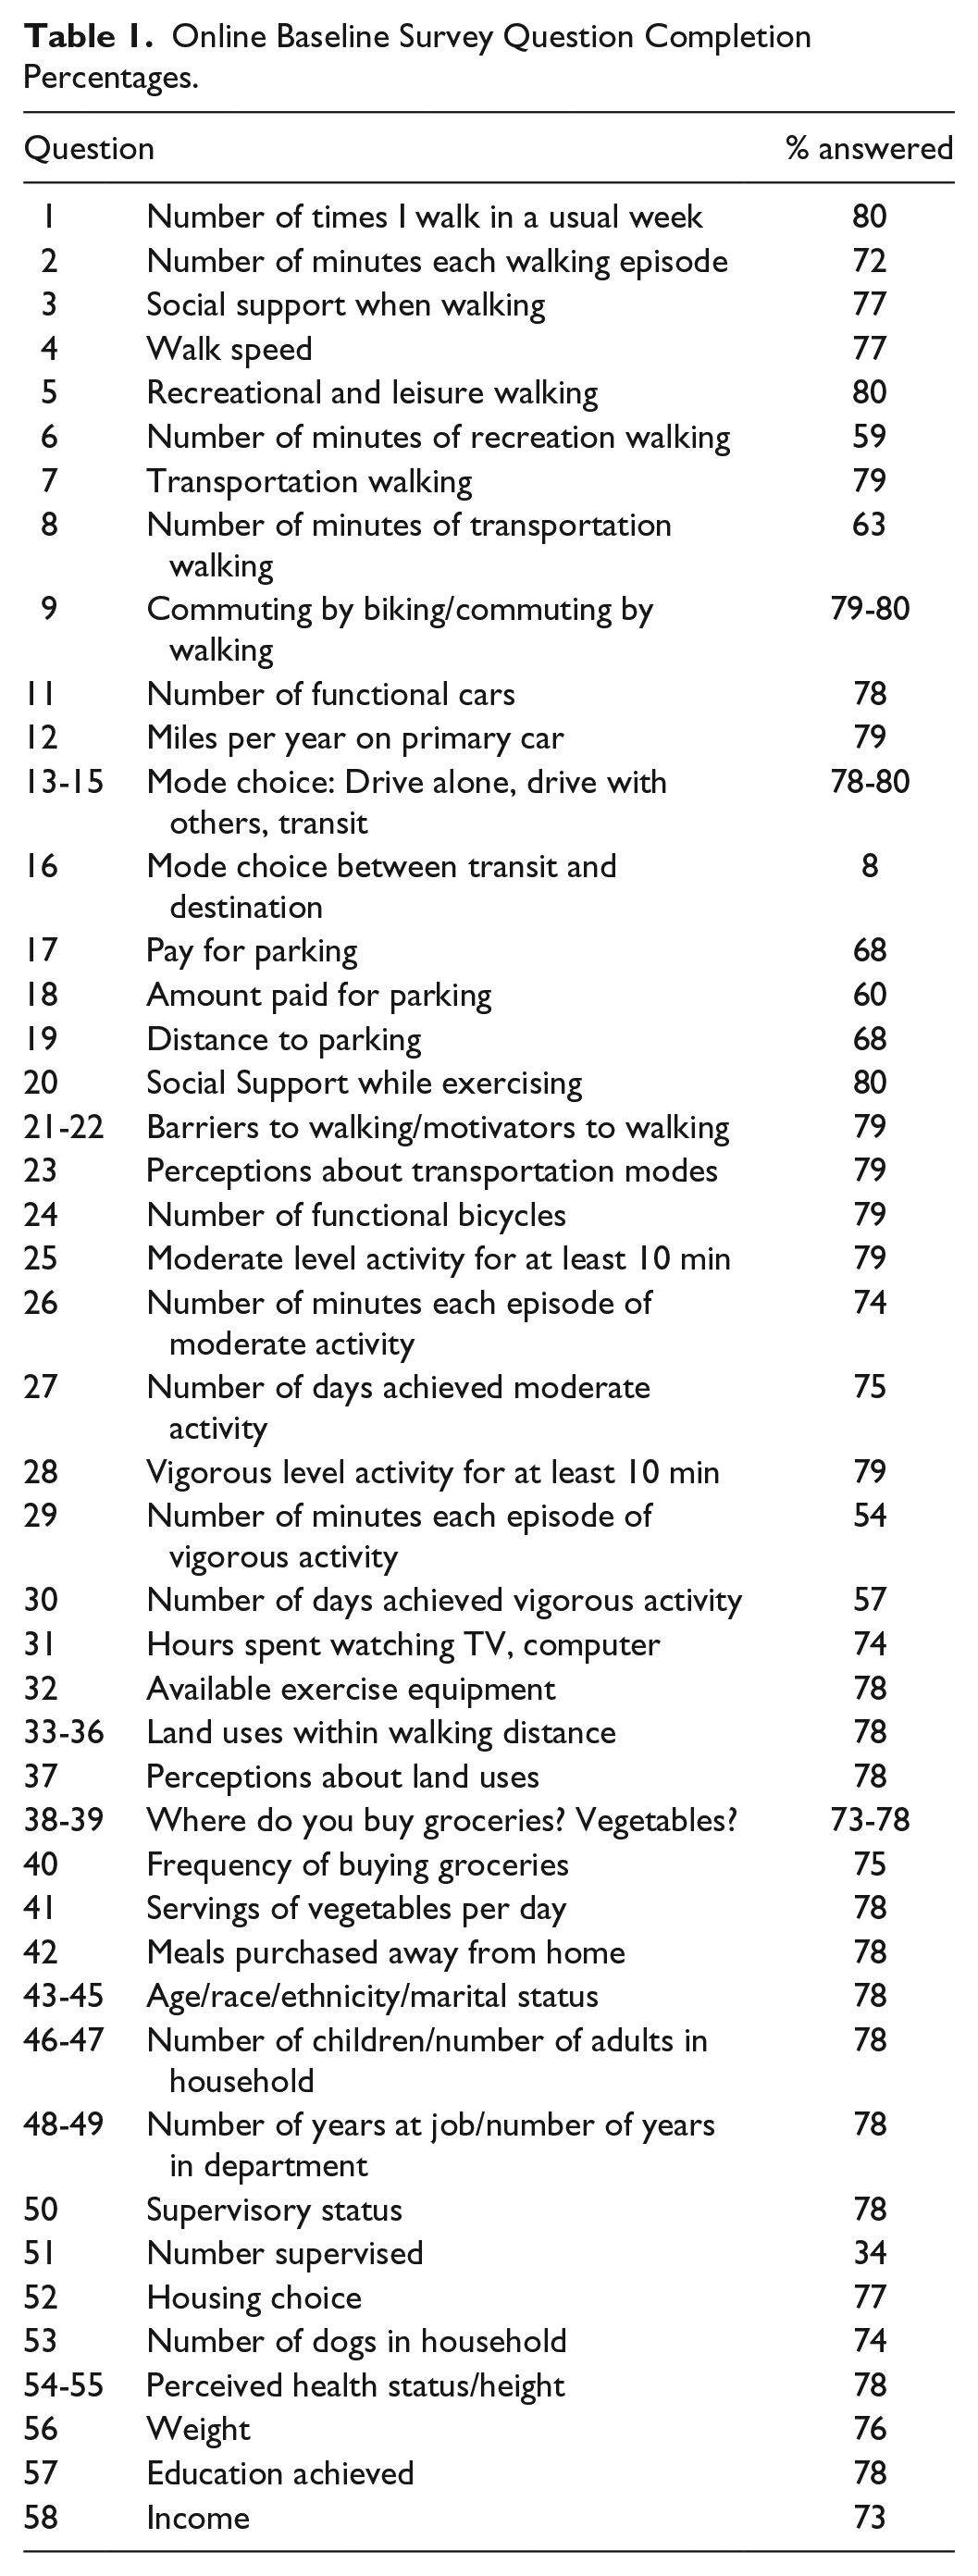
For the Phase I baseline survey, participants did not have the option of completing the survey on a paper version; responses were only collected via a web-based survey software.
For the travel diary phase of the study, data collection was primarily online; however, the option to complete a paper diary was offered to all participants. Thirteen participants opted to use the paper travel diary. This is a small sample, and self-selection bias is a limitation; therefore, this is a qualitative comparison between the two methods as planners begin to use online methods more consistently in practice and research.
The descriptive statistics for participants using the paper diary versus the online diary are comparable in amount of walking trips, total trips, and total step count from the pedometers. The average number of trips, total step count, and trip durations for the paper diary participants for the paper diary and online travel diaries are shown in Tables 2 to 4. Pedometer readings for step counts are fairly comparable between paper diary users and online travel diary users (Paper Diary Total Step Counts Day One & Day Two: 3,842 steps and 4,389 steps; Online Users Total Step Counts Day One & Day Two: ranging 3,972-4,898 steps and 4,565-5,094 steps). Notably, paper diary users reported more total transportation trips and more walk trips specifically as compared with online users (Tables 2-4).
Descriptive Statistics for Paper Diary Participants.

Descriptive Statistics for Online Travel Diary—Suburban Land Use Environment.

Descriptive Statistics for Online Travel Diary—Urban Land Use Environment.

Table 5 shows for the paper travel diary the percentage of missing data for key questions for total step count (0%-7.1% missing data), total transportation trips by any mode of travel (27.3%), and walk trips (6.3%-27.3%), over 2 days of data collection for the paper travel diary.
Paper Travel Diary Missing Data Analysis—Both Land Use Environments.

Tables 6 and 7 both show missing data for the online travel diary users. The data in these tables reveal higher percentages of missing data for these same key planning questions for the study: total step count (25%-45% missing data), total transportation trips (14%-42%), and walk trips (40%-50%) over the same two data collection days. Office workers in the urban setting appeared to have higher percentages of missing data than the suburban office workers completing the online travel diary.
Online Travel Diary Missing Data Analysis—Suburban Land Use Environment.

Online Travel Diary Missing Data Analysis—Urban Land Use Environment.

The paper travel diary users were a small sample; therefore, generalizability is not possible. Participants choosing to fill out the paper diary seemed to fill out their trips more completely with low levels of missing data. Because the paper travel diaries were mailed or emailed back a significant time after the data collection period (several weeks up to 2 months), assessing the recall bias inherent in the paper diaries is difficult to quantify. Despite the paper diary in this study showing a higher completion rate, the online diary afforded a greater sample size and other flexibility for researchers the paper version does not.
Analysis
From this study, the missing data comparison between the paper diary and online travel diary does not clearly indicate that using online strategies will result in more complete survey data. However, the sample size for the paper diaries is insufficient for statistical comparison. However, pairing this information with qualitative analysis, it can be seen that online travel diaries allow for a greater sample size, reduced data entry time and cost, and conceptually a decreased recall bias. The latter is due to the ability of the researcher to monitor respondents’ survey entries in real time. Reminders to complete the data or follow-up on a particular response are possible in real time when surveying is completed online. The shift to using online travel diaries and survey methods may also be increased as the cost and capabilities of cell phones continue to improve and ability for participants to commonly respond to research data collection efforts via their cell phones or smartphones become more viable. The ability to assess behavior in real time will continue to become a useful tool in measuring correlates of active transportation behavior.
Online surveying in this context also allowed for more questions about perception and attitudes to be included using skip routines when irrelevant to the particular trip. This included questions that assessed the quality of the built environment when a trip was made by walking, perceptions about safety, and factors that influenced mode choice such has having to carry items, having multiple trips to make, or child care responsibilities. These built enviroment questions connected to mode choice by each trip proved cumbersome for a paper diary where skip routines were required thus increasing confusion and the number of pages for the instrument (e.g. if you answered “Yes” to walking mode for a particular trip you then would need to be directed to a set of questions on why you chose that mode and quality of the built environment along that route). A telephone-based survey method can also handle the necessary skip routines better than a paper survey instrument; however, costs to perform this activity with a phone-based service for the surveying exceed most small research grants.
Conclusion
Collapsing the time between when an event takes place and when the data are recorded is an important goal in improving the accuracy of data collection, particularly when addressing lifestyle behaviors. Planners should consider ecological momentary approaches to improve our understanding of how behavior is influenced by environment. The use of technology, for example, online surveys, GPS units, and cell phones, will be tools for researchers to consider when measuring the connection between the built environment and physical activity. These methods can further be translated to planning research assessing connections between built environment elements and social interaction, perceptions on crime and safety, or use of public spaces. Limitations to online surveying still remain. Some populations will be uncomfortable using technology, cannot afford or generally do not have access to computers, and will still require paper formats. Although this study has a limited sample size and selection bias applies, this research shows some initial evidence that increasing the use of online tools will decrease costs to research, increase completion and data accuracy, increase response rates, and decrease data entry time. To target specific socio-economic groups, the ability to use “loaner” smartphones to track both GPS data on travel as well as collect online survey data is becoming a cost-effective tool possible for researchers to integrate with different populations.
Footnotes
Declaration of Conflicting Interests
The author(s) declared no potential conflicts of interest with respect to the research, authorship, and/or publication of this article.
Funding
The author(s) disclosed receipt of the following financial support for the research and/or authorship of this article: The grant was awarded by the Robert Wood Johnson Foundation through its Active Living Research program.