
Abstract
Significant gaps remain between public opinion and the scientific consensus on many issues. We present the results of three studies (N = 722 in total) for the development and testing of a novel instrument to measure a largely unmeasured aspect of scientific literacy: the enterprise of science, particularly in the context of its social structures. We posit that this understanding of the scientific enterprise is an important source for the public’s trust in science. Our results indicate that the Social Enterprise of Science Index (SESI) is a reliable and valid instrument that correlates positively with trust in science (r = .256, p < .001), and level of education (r = .245, p < .001). We also develop and validate a six question short version of the SESI for ease of use in longer surveys.
Keywords
Background and Motivation
In an influential review, Jon D. Miller (1983, p. 29) presented evidence that “the level of scientific literacy in the United States [was] deplorably low.” Alarm was raised around the same time in the United Kingdom by the so-called Bodmer (1985) Report of the Royal Society. Measured in a variety of ways, the state of U.S. scientific literacy has not changed significantly in the intervening decades (Board, 2016; J. D. Miller, 2016). At first glance, one reflection of this “deplorable” situation is the existence of a number of recalcitrant gaps between the consensus within the scientific community on issues such as anthropogenic climate change or the safety of vaccines or genetically modified organisms (GMO) and the level of agreement in the U.S. public on these issues—to say nothing of recent well-publicized upticks in more outlandish conspiratorial theories (e.g., concerning the planet’s bulk geometry) (Funk & Goo, 2015; Lewandowsky et al., 2013; J. D. Miller, 2004; Organisation for Economic Co-operation and Development, 2007). However, the gaps between public acceptance and scientific consensus may not be due to low scientific literacy. As Kahan and colleagues (2012, 2016) have argued, when it comes to accepting consensus science on issues like climate change, greater scientific literacy can correlate with greater polarization. This result raises many important questions about our strategies for education and science communication, of course. We do not intend to address such questions in this article; instead, we offer a new tool for their investigation: a validated survey instrument measuring one’s grasp of important social dimensions of the scientific enterprise.
Let us take a step back. What does it mean to be “scientifically literate”? This question has of course garnered significant attention over the last several decades—which, again, we cannot hope to survey in this context (see, for example, Bodmer, 1985; Durant, 1993; Jasanoff, 2014; Laugksch, 2000; J. D. Miller, 1983, 2010, 2016; Norris & Phillips, 2009; Shen, 1975). We can, however, note some general categories of answers to contextualize and motivate the survey instrument we have developed.
To begin with, one might draw an initial distinction between questions of content and those of methodology or more general aspects of the nature of science (NoS) (see Figure 1). Regarding questions of content, some aim to determine whether individuals are familiar with certain key scientific terms or concepts (of varying levels of specificity) as well as certain theories or accepted scientific facts. Regarding questions of methodology, some aim to measure, on one hand, whether individuals know about basic approaches to “doing science”—for example, how hypotheses are tested, how theories are developed, confirmed, and revised, what counts as a good explanation, what role models have, and so on—and, on the other, whether they grasp more abstract concepts such as theories, hypotheses, degrees of confirmation, and scientific uncertainty.

Elements of scientific literacy; popular conceptions focus on individual-level elements.
Most conceptions of scientific literacy in the literature can be seen as selecting items from the basic menu on the individual-level of Figure 1. For example, in Kahan et al.’s (2011, 2012) early studies, science literacy is measured using a combination of questions from the National Science Board’s 2010 Science and Engineering Indicators—questions of particular scientific fact (e.g., “Does the Earth go around the Sun?”) and basic methods (e.g., the best way to test the efficacy of a drug)—as well as a few numeracy and cognitive reflection questions (sensu Frederick, 2005). In subsequent work (e.g., Kahan, 2015), Kahan employs a similar composite scale he calls “Ordinary Science Intelligence” (OSI) that uses questions from various sources, including the Science and Engineering Indicators questions (see Kahan, 2016 for discussion and validation).
Only one of the items in the OSI scale (VALID) involves methodological concepts that might serve to measure individuals’ “knowledge about science” or grasp of “the nature of science”, an area that has long been part of the educational agenda in the United States (Duschl & Grandy, 2013, §1; Jarman & McClune, 2007, ch.1). This is not meant as a criticism. Researchers typically must be selective in what they can measure. And many other scales do attend to NoS concepts (see Lederman, 1998 for a useful overview). What appears to be much less common, however, are measures that address some of the key social or community-level aspects of the scientific enterprise. By this, we intend something more constrained than general aspects of the science–society nexus; while important and interesting, our focus is more narrowly on the social/institutional features of the scientific enterprise. For example, in Lederman et al.’s (2002) Views of Nature of Science (VNOS) open-ended questionnaire, items address the possibility of changing theories, the role of creativity in the design of scientific experiments, and possibility of scientific disagreement; but no item focused on social processes underlying these phenomena. Or consider the “Scientific Enterprise” subtest of Billeh and Malik’s (1977) Test on Understanding the Nature Science (TUNS) which contained only one topic with an implicit connection with the social/institutional features of science: that science is a “self-correcting enterprise” (it is left unspecified and unasked how this occurs); the concepts in the “Processes of Science” subtest include only high-level NoS concepts (such as observation, measurement, classification, experimentation, formulation of hypotheses, theories, laws, and models, and so on). While these items may well address important components of a holistic grasp of science, they do not get at the social processes that give the scientific enterprise its distinctive epistemic character.
We may then shift our focus from the individual-level conceptions of scientific methodology (or NoS more generally)—including methods that an individual investigator might use to test hypotheses or a nuanced conception of scientific theories—to the processes, institutions, and norms that guide the functioning of the scientific community (or its many subcommunities). By this, we have in mind the ways in which such communities police themselves, train and educate their members, collaborate but simultaneously compete with one another, vet, contest, and disseminate claims, apportion funding, set research priorities, and so on (topics found on the Community-Level branch in Figure 1). Arguably, by making it more likely that rigorously vetted scientific theories will yield more accurate (or anyway empirically adequate) representations of the world, such institutions and norms (when well-functioning) are an important part of the story of how scientific consensus derives its epistemic significance (Longino, 1990; B. Miller, 2013; Oreskes, 2019; Slater et al., 2019). While it is not much of a jump from here to the proposition that a grasp of the workings of the scientific enterprise would contribute to one’s trust of science, we are not prepared to assert this connection here; it is, after all, an empirical hypothesis that—so far as we are aware—has not been tested.
This may be for want of a suitable measure of such a grasp. While the social-institutional processes we have in mind have been well studied by historians, philosophers, and sociologists of science (Boyer-Kassem et al., 2017; Kitcher, 1992; Kuhn, 1962; Latour & Woolgar, 1979; Merton, 1973; Shapin, 1994; Shapin & Shaffer, 1985; Strevens, 2003), very few survey instruments focus on measuring one’s grasp of this aspect of scientific literacy. Individual items concerning social aspects of the scientific process can (occasionally) be found in other instruments. For example, Lombrozo et al. (2008) developed a 60-item questionnaire designed to measure subjects’ understanding of the NoS of which five items related to the idea that “the scientific community plays an important role in science” (292). Likewise, Hawley et al.’s (2011) Evolutionary Attitudes and Literacy Survey (EALS) includes a section on “Knowledge about the scientific enterprise”; but only one item (“For scientific evidence to be deemed adequate, it must be reproducible by others”) had any direct connection to social processes that animate the scientific enterprise. But with one exception, no contemporary survey that we found goes much further than this to probe how the scientific community plays a role in the generation of scientific understanding.
An exception is an instrument called the Institutional Knowledge Scale due to Bauer et al. (2000). The authors describe motivations similar to our own, also noting that the “institutional side of science” is often ignored or left out in researchers’ approaches to public understanding of science. Although the authors’ conceptions of the “scientific institution” (31) bear significant similarities to what we are here calling the (social aspects) of the scientific enterprise, there are some important differences between our respective measures in their formulation, validation, and content. We discuss these in more detail in the next section.
In the balance of this article, we document the development of an instrument—what we call the Social Enterprise of Science Index (SESI)—that researchers can use to investigate subjects’ grasp of the social–institutional aspects of the scientific enterprise. It is not intended as an instrument for measuring scientific literacy in toto; indeed, we doubt that there is any one thing that scientific literacy is or should be. Instead, we see the SESI as a measure for an important and under-studied aspect of scientific literacy that may be a useful tool for future researchers’ inquiries into different populations’ knowledge and understanding of the social enterprise of science (as it is approached in the United States and possibly other national contexts)—one that might readily be conjoined with distinct measures of other aspects of scientific literacy.
Development of the SESI
Instruments and assessments of knowledge can be designed in at least two ways. On one hand, researchers can aim to capture the degree of understanding of a particular topic. In these circumstances, items are chosen because they represent the key concepts that experts (or other relevant authorities) have decided must be understood to have competency in the topic (of course, different experts can have different ideas about what concepts are required for proficiency; proficiency on many fronts is also presumably a contextual matter). Population scores, then, reflect the number of items answered correctly—or of concepts understood—which need not be normally distributed. Instead, populations can score “lower” (meaning the population, on average, only answer a few questions correctly, i.e., positive skew) or “higher” (meaning the population, on average, answer many questions correctly, i.e., negative skew). An example of this type of instrument design are measures like the National Science Board’s Science Indicators (2020), which are used as a measure of science literacy in a number of studies (e.g., Gauchat, 2011; May, 1997).
On the other hand, researchers can design an instrument that aims to best capture the wide variation among the population on a particular construct (e.g., knowledge of evolution—see Weisberg et al., 2018). This requires carefully selecting items that vary in difficulty and have high discriminatory power, so that scores on the assessment are normally distributed. Importantly, as the test is designed to fit the population, researchers cannot use these scores to determine whether a representative sample from that population “scores high” or “scores low” on the targeted concept. Examples of this type of instrument design are measures of intelligence, which are centered and normalized to the population. This was the method used to develop the OSI scale (Kahan et al., 2012).
Here, we adopt elements of both approaches. First, through our interviews with scientists and academics, members of the public (and based on our understanding of the literature and our own expertise), we identified important concepts relevant to the social enterprise of science that were suggested as indicative of proficiency. Second, through pilot testing and item response theory (IRT) analysis, we narrowed down the instrument to 25 items (i.e., SESI v3.0). Finally, based on the difficulty and discriminatory power of each of the items, we created a short, 7-item version of the measure (SESI v3.0s) that can be used to capture variance among the general public, but does not include all of the concepts important for demonstrating proficiency.
The development of our instrument occurred in four phases (see Figure 2): (a) initial item selection, (b) item evaluation using Amazon’s Mechanical Turk (MTurk) workers (N = 108), (c) a field test with MTurk workers (N = 231), and finally (d) a field test using participants from a national online consumer panel recruited by Research Now. We describe each of these phases in more detail below.

SESI scale development.
Phase 1: Initial Item Creation
We began our process by locating existing measures of scientific literacy and identifying any items on those instruments that specifically dealt with the social–institutional features of the scientific enterprise. We adapted six items from a scale developed by Cooley and Klopfer (1961) and two items from the Lombrozo et al. (2008) measure. We then compiled a list of important aspects of the scientific enterprise, organizing these further into specific concepts and then into topics within each concept. Beyond a review of extant literature, we drew heavily from our own experience and expertise at this stage as well as a series of qualitative interviews we conducted with lay publics to identify common misconceptions about the scientific enterprise (see supporting materials).
Phase 2: Item Evaluation (Pilot Study)
We conducted a pilot study to test the preliminary items of the SESI with a sample of American adults. To establish convergent validity, we compared scores on the SESI with scores on Kahan et al.’s measure of science intelligence (OSI) and Nadelson et al.’s (2015) measure of trust in science. We predicted that those with higher scores on the SESI would also have higher scores on the OSI and higher scores on trust in science. To establish concurrent validity, we compared scores on the SESI to education level. We predicted that higher scores on the SESI would correspond to higher self-reported levels of education.
Method
Participants
The sample for this study consisted of 121 American adults recruited via Amazon’s Mechanical Turk platform (MTurk) and paid $1.50 for their participation. After the elimination of incomplete surveys, the remaining sample (N = 108) was 56.5% male and 82.4% identified as white, non-Hispanic. The mean age of the participants was 34.3 years old and 51% had a bachelor’s degree or higher.
Materials and procedure
For the study, participants completed an online survey consisting of three blocks: (a) the 27-item preliminary SESI v1.0, (b) the OSI measure (i.e., OSI, 21 questions, Kahan, 2017), and (c) a Trust in Science Measure (19 items, Nadelson et al., 2015). The order of the three blocks was randomized between participants, and the order of questions within the SESI and the Trust measure blocks were also randomized. The order of questions for the OSI remained the same (consistent with Kahan et al.’s studies). Finally, participants were asked a series of demographic questions (e.g., age, race, and education level).
Scoring
Each item was scored at the level of the question, and each question was worth 1 point. For true-false and multiple-choice questions, participants received 1 point for providing the correct answer. For Likert-type scale questions, “strongly agree” and “agree” were collapsed together (or “strongly disagree” and “disagree” for reverse-worded questions) with one point awarded for agreement with a correct statement (or disagreement with an incorrect statement). For check-all-that-apply items participants were awarded fractions of points for each correct selection, and fractions of points were also subtracted for incorrect selections, but no score below 0 was awarded (i.e., if someone chose three incorrect answers and one correct answer, their score for that question would be 0). Participants’ scores were the sum total of points earned. A detailed codebook for scoring the final version of the SESI is available in the supporting materials.
Results
Preliminary measurement analysis and interitem reliability
Scores on the first draft of the SESI (SESI v1.0) ranged from 7.17 to 34 (M = 22.35, SD = 6.03) out of a possible 37 points and were negatively skewed. The negative skew was not unexpected, given that MTurk workers in general, and our sample in particular, tend to report a higher level of education than the general American public. Interitem reliability for the 27-item SESI v1.0 was strong (α = 0.83). Four items with low interitem correlations were noted and were either eliminated or reworded after qualitative feedback from the expert reviews (see Table 1).
Item Concepts, Topics, and Development for the Social Enterprise of Science Instrument.
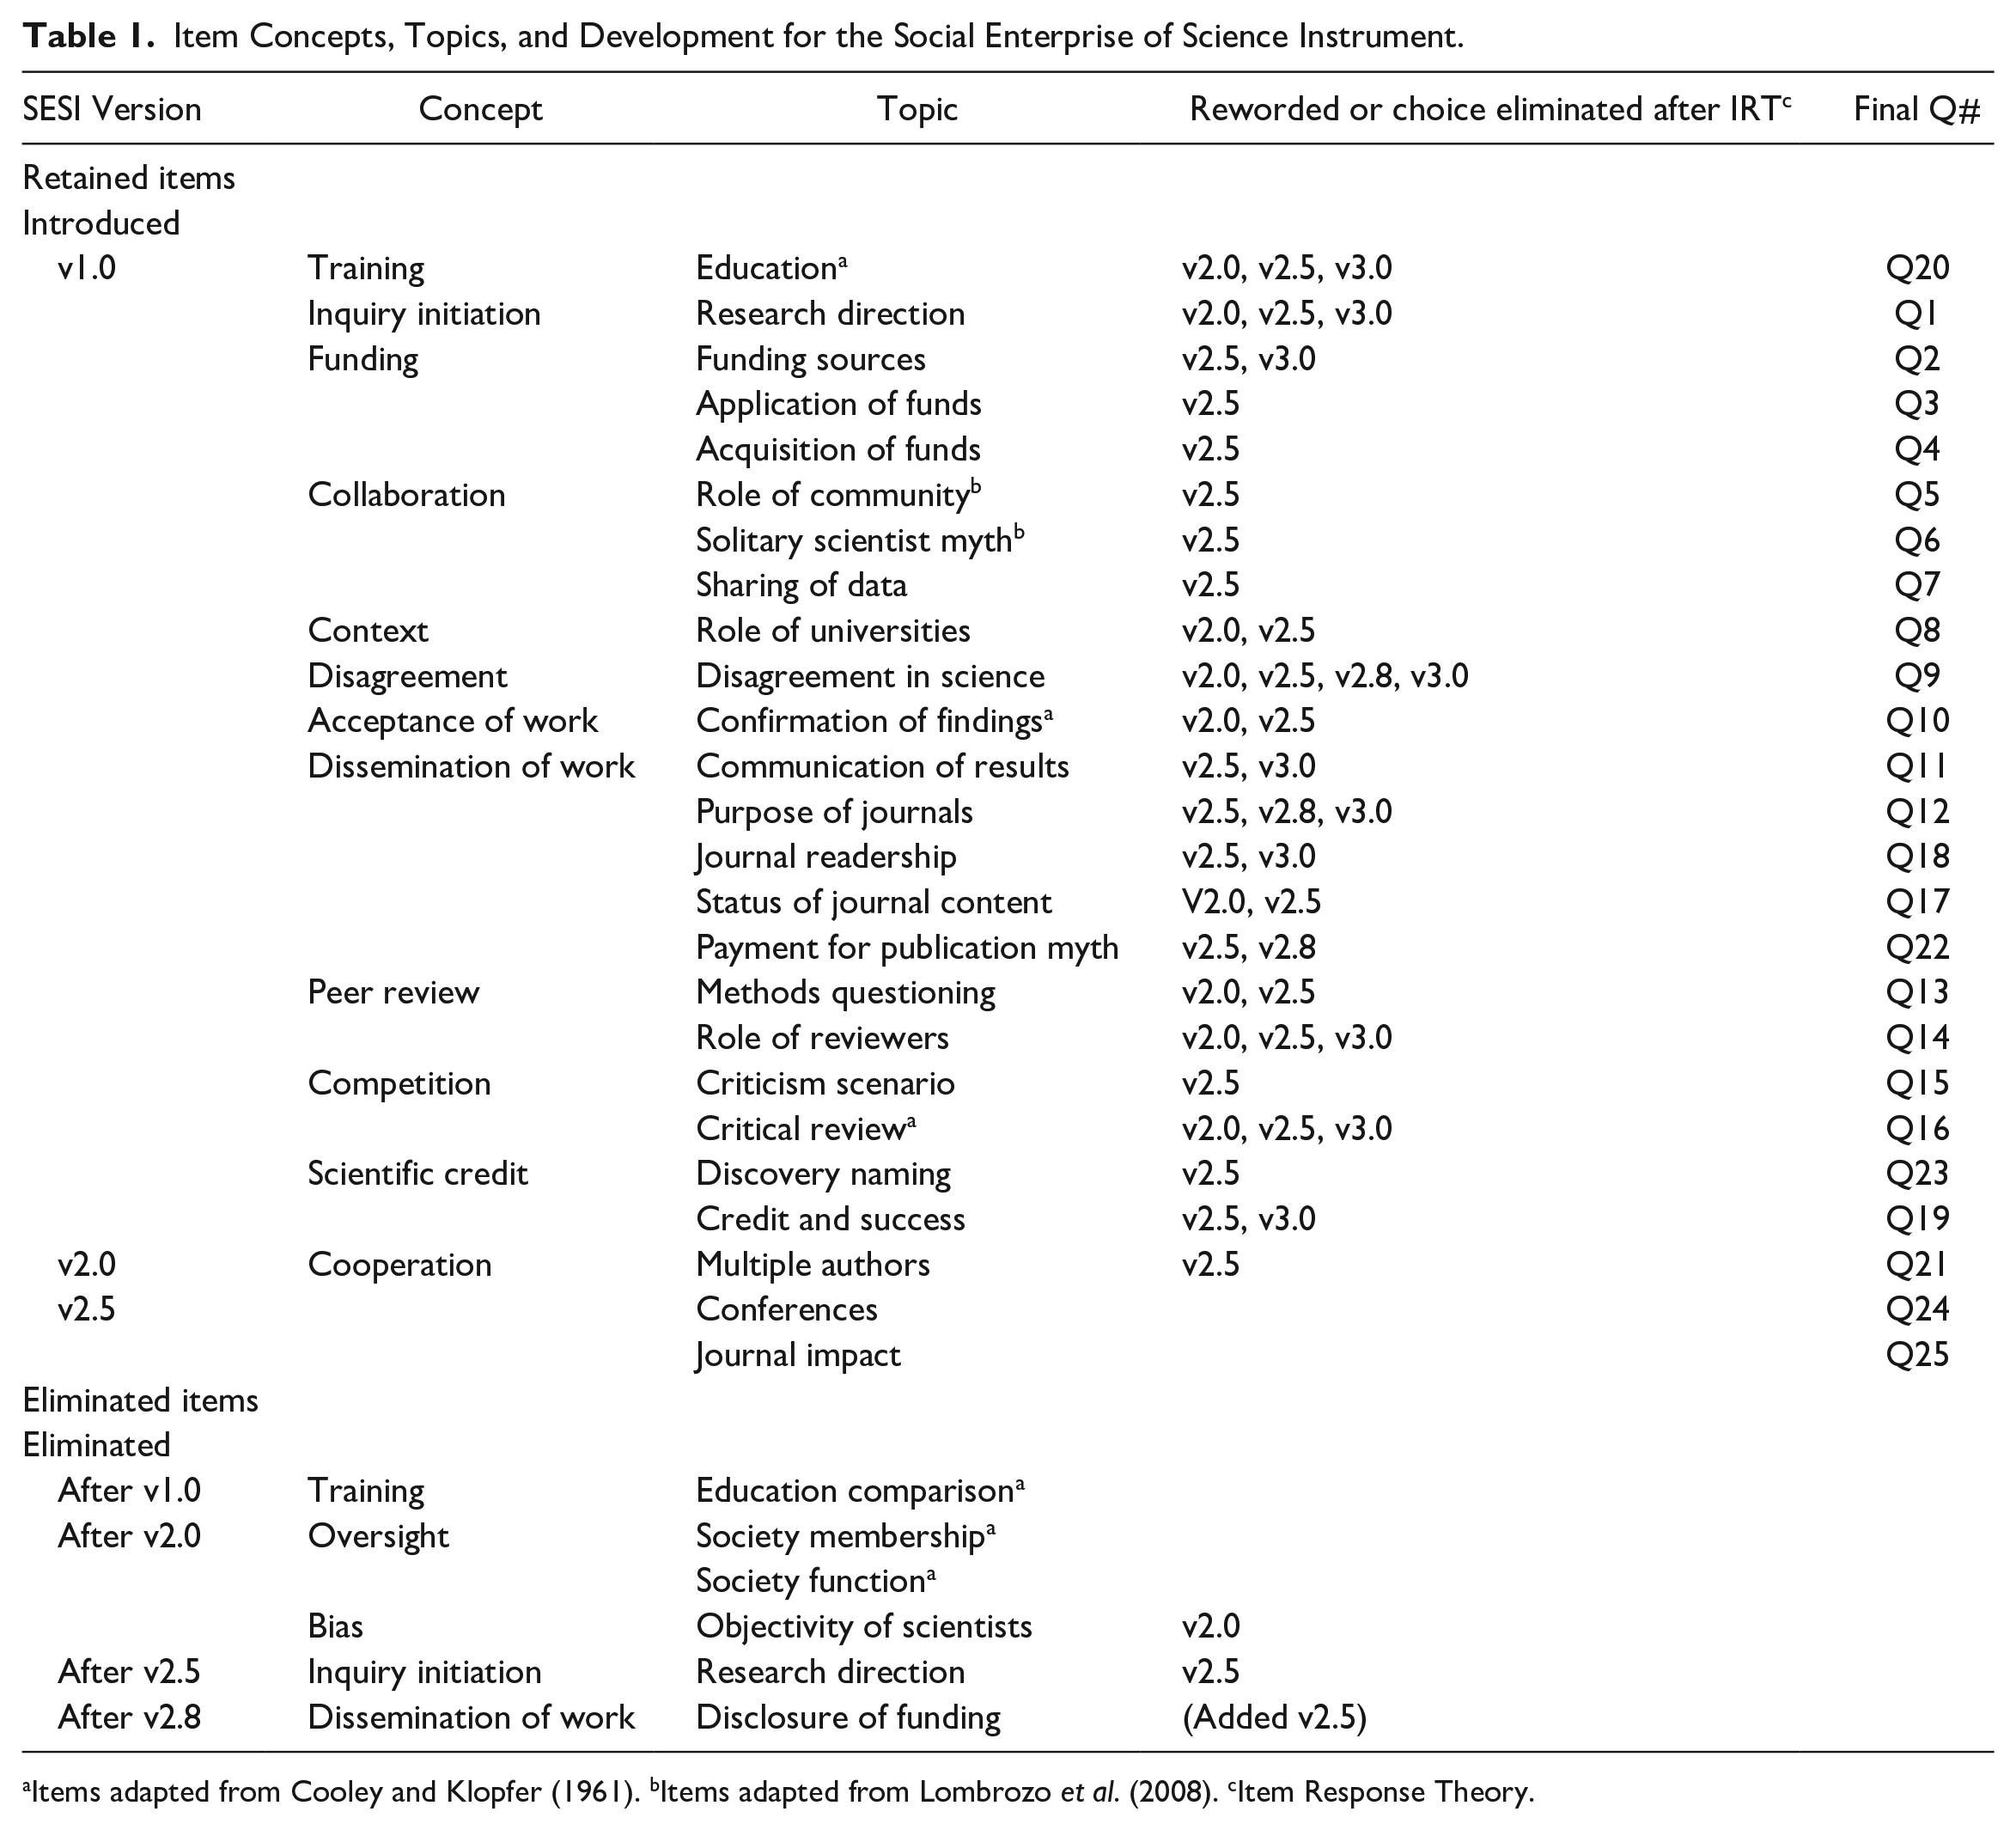
Items adapted from Cooley and Klopfer (1961). bItems adapted from Lombrozo et al. (2008). cItem Response Theory.
Criterion and convergent validity
As predicted, scores on the social enterprise of science measure were positively related to measures of other aspects of scientific literacy, including OSI scores and trust in science scores: individuals who scored highly on the SESI v1.0 also scored highly on the OSI (r = .74, p < .001) and on the Trust in Science measure (r = .59, p < .001). Similarly, those with higher self-reported levels of education scored higher on the SESI (r = .203, p = .03), but this relationship was much weaker than the others. All correlations for the pilot study can be seen in Table E1 in the supporting material.
Expert Review for Content and Face Validity
As explained in the previous sections, we created the items in our initial measure based on previous literature, semistructured interviews, and our scientific colleagues’ (and our own) expertise. However, acknowledging that many scientific fields can vary in their norms and practices, we sought validation from experts from a range of fields in science as well as experts on the history and philosophy of science. Thus, we conducted two rounds of expert review with the SESI to test content and face validity.
Round 1 of expert reviews
In the first round, a total of 16 scientists and historians and philosophers of science (recruited at the 2016 Philosophy of Science Association and History of Science Society joint meeting and via social media connections) viewed and completed the survey online as study participants would see it (M = 26.71, SD = 2.06), and then were asked to rate and comment on the 27 items. More information on recruitment and demographics for these individuals can be found in the supporting materials. We then examined the ratings for each question, and two researchers coded and analyzed the expert comments. After reviewing the comments and ratings, we substantively reworded several survey items for clarity and to better reach a general audience (Table 1). Items were also rewritten to better distinguish between topics and to render each more domain-general. We updated the SESI (v2.0) based on this first round of expert review and the results of the pilot test.
Round 2 of expert reviews
The second round of expert review examined the updated version (v2.0). The experts consisted of 35 scientists, historians of science, and philosophers of science from a variety of backgrounds recruited using the Philosophy of Science Association mailing list and snowball sampling via social media contacts of colleagues in science departments from two of the authors’ home universities. As with the first round of reviews, these experts were asked to rate the quality and accuracy of all the questions, and were encouraged to comment on the items. Again the ratings were examined and the comments analyzed by two researchers. The SESI was revised again based on this feedback (v2.5). The first field test examined this version.
Summary
The purpose of the pilot study was to examine the reliability and validity of our initial measure. The results show that the first iteration of the SESI (v1.0) has good convergent and predictive validity, as well as strong interitem reliability. The SESI was more strongly correlated with the OSI measure than trust in science or education level. Two rounds of qualitative data gathered from expert review panels helped us to refine and reword several survey items for a more domain-general measure that is also more understandable for the intended audience (the U.S. public.). The resulting, revised version of the SESI (v2.5) is used in Field Test 1.
Phase 3: Field Test 1 and Item Refinement
One common point of debate in knowledge measures is whether to include “I don’t know” as a possible response option (e.g., Feick, 1989). In some disciplines, the inclusion of “I don’t know” options in knowledge batteries is encouraged (Delli Carpini & Keeter, 1996), while in others, it is traditionally eschewed. In the social sciences, it is not common practice to include an “I don’t know” option, as people tend to select it preferentially rather than attempting to answer (Goodwin & Goodwin, 2017). Prior studies have shown that including “I don’t know” in tests of knowledge can skew scores and that women are more likely to omit an answer or choose “I don’t know” than men (Ben-Shakhar & Sinai, 1991; Mondak & Davis, 2001). Therefore, to help determine whether the SESI should include an “I don’t know” response option, we conducted field test 1 using both approaches. Field test 1 randomly assigned participants to one of two versions of the SESI (v2.5): one with the option for participants to select “I don’t know” for each question (n = 108), and one without that option (n = 103). Based on prior research, we predicted that the inclusion of “I don’t know” would decrease participants’ SESI scores by decreasing the number of times participants chose the correct answer when they had a hunch that it was correct but were not certain. Field test 1 also served to allow us to test the reliability and validity of the SESI, and to further refine the scale.
In this test, we included 1-item, self-reported measures for both trust in science and religiosity (see section “Materials and procedure.”). We predicted that the SESI (v2.5) would correlate positively with trust in science and negatively with religiosity.
Method
Participants
The sample for Field Test 1 included 239 American adults recruited via MTurk and paid $1.50 for their participation. After incomplete responses were eliminated, 211 participants remained. The sample was 53% male and 86.7% reported identifying as white, non-Hispanic. The mean age of the participants was 38 years old and 44.1% had at least a bachelor’s degree. On a scale of 1 to 7 for political ideology (where 1 = “very liberal” and 7 = “very conservative”), the mean score was 3.66.
Materials and procedure
Participants in Field Test 1 were randomly assigned one of two study groups. Each group completed the online survey via Qualtrics. One group took the SESI with an option to select “I don’t know” for every question (v2.5_IDK), while the other group took the SESI without the option to select “I don’t know” (v2.5). The survey items were presented in random order on both versions. After the demographic questions, the respondents were asked to self-report their trust in science (“How much would you say that you trust in the findings of science?” on a 5-point Likert-type scale from “A great deal” to “Not at all,” M = 3.88, SD = .88) and their religiosity (“How important is religion in your life?” on a 5-point Likert-type scale from “Extremely important” to “Not at all important,” M = 2.22, SD = 1.48).
Scoring
The SESI v2.5 was scored similarly to the first version, with partial credit being awarded for correct responses on “select all that apply” items and partial points subtracted for incorrect responses, but with no score lower than a 0 assigned per item. On the SESI v2.5_IDK, selection of “I don’t know” was scored as an incorrect answer. Separately from the SESI score, we tallied the “I don’t know” responses to create an “I don’t know,” or self-reported ignorance, score (IDK_Score), which could range from 0 to 27.
Results
Comparison of measures and “I don’t know” scores
We were first interested in whether there was a difference between SESI scores for the two treatment groups, v2.5_IDK (M = 19.13, SD = 5.35) and v2.5 (M = 19.86, SD = 4.94). An independent samples t-test revealed no significant difference between groups, t(209) = −1.04, p = .301, Cohen’s d = 0.14. A between subjects analysis of variance (ANOVA) with groups organized by gender and test version revealed a significant difference in SESI score between groups F(3,210)= 2.93, p = .04. Post hoc analysis using Tukey’s HSD indicated that female participants taking v2.5_IDK (M = 17.92, SD = 5.3) scored lower than male participants on the same version (M = 20.42, SD = 5.14) and male participants taking v2.5 (M = 20.33, SD = 4.87) but that those differences were not significant (p = .056 for both). To further explore this finding, we compared the IDK_Scores between genders. Men (n = 52) selected “I don’t know” significantly fewer times (M = 4.25, SD = 3.22) than did women, n = 56, M = 6.66, SD = 4.80, t(106) = −3.39, p < .001, Cohen’s d = 0.59. Means and standard deviations for men and women on all three of these measures can be seen in Table E2 in the Supporting Material. Given the gender difference in the use of the “I don’t know” option, we decided to not include “I don’t know” in the final version of the SESI. Therefore, further examination of the predictive validity of this scale includes only the results from the version without the “I don’t know” option (v2.5).
Scale analysis and interitem reliability
A total of 103 participants took the SESI (v2.5) survey (SESI score M =19.86, SD = 4.94, range: 6–28.67). As with the first iteration of the SESI, the distribution was negatively skewed, which was expected, given that the MTurk population is more highly educated than the general population (Paolacci & Chandler, 2014). Interitem reliability was strong (α = 0.82) but interitem correlations revealed that Cronbach’s alpha would increase to α = 0.83 if two items, Q2 and Q8, were deleted. This increase in Cronbach’s alpha alone is not justification enough for removal, but after reviewing both items and the qualitative comments made in the expert review panels, we decided to eliminate Q2, and to reword Q8 for the next version of the SESI (SESI v2.8, presented in §5, see also Table 1). Two further items were reworded for clarity. The reworded and eliminated items can be found in the supporting material for this article.
Criterion and convergent validity
The SESI v2.5 behaved mostly as predicted in correlations with demographics and other included metrics (Table 2). Those who scored higher on SESI v2.5 also reported higher levels of trust in science (r = .240, p = .02), and those with higher self-reported levels of education also had higher scores on SESI v2.5 (r = .244, p = .01). There was a negative relationship between higher self-reported religiosity scores on the SESI v2.5, but this relationship was marginal (r = −.177, p = .077).
Bivariate Correlations Between SESI, Other Metrics, and Demographic Variables in Field Tests 1 and 2.

Note. SESI = Social Enterprise of Science Index.
p <.05. ***p <.001.
Summary
The motivations for Field Test 1 were twofold. The first was to test the revised version of the SESI and to further refine the items. The second was to determine how inclusion of an “I don’t know” option affected participant scores on the measure. The results showed that the inclusion of an “I don’t know” option, while not affecting the overall score as compared to the version without an “I don’t know,” created a significant difference in the scores on the SESI v2.5 between genders. We chose, therefore, not to use the “I don’t know” option in the final version of the SESI (v3.0). Validity and reliability analyses in this field test helped to further refine the SESI for the final field test.
Phase 4: Field Test 2 and Item Refinement
Field Test 2 served as our final validation and reliability test for the refined version of the SESI (v2.8). We employed a sample that more closely approximated the U.S. population in Field Test 2 by collecting data through the digital data collection company Research Now rather than through MTurk. We also included the demographics and other metrics included in Field Test 1.
We predicted that this final version of the SESI would correlate with trust in science and that we would see a negative correlation with self-reported religiosity and conservative political ideology (Brewer & Ley, 2012; Gauchat, 2012). We also expected to see a positive correlation between education level and SESI scores, and a lower mean SESI score as the sample had a more representative education level than did the MTurk samples.
Method
Participants
Field Test 2 employed 325 participants from the U.S. population collected by Research Now (the name of this company changed to Dynata after these data were collected) with a completion rate of 83%. Participants were compensated $2.50 in online currency. The sample was 55.7% male and 75% reported identifying as white, non-Hispanic. The mean age of the participants was 46 years old and 47.9% had at least a bachelor’s degree. On a scale of 1 to 7 for political ideology (where 1 = “very liberal” and 7 = “very conservative”), the mean score was 4.35. Trust in science (M = 3.68, SD = .915) and religiosity (M = 3.11, SD = 1.42) were measured with the same items used in Field Test 1. Life Science Identifiers
Materials, procedure, and scoring
SESI v2.8 included 26 items. Participants in Field Test 2 completed an online survey, which included the SESI v2.8 with items (randomized between participants) and the same 1-item measures of trust in science and religiosity used in Field Test 1. The SESI v2.8 was scored in the same manner as the previous versions.
Results
Scale analysis and interitem reliability
The mean score for the SESI v2.8 was 16.10 (SD = 6.37, range: .33–29.15) out of 32 possible points. Cronbach’s alpha for the 26-item SESI scale was strong (α = 0.88).
Criterion and convergent
Once again, the SESI behaved as predicted (see Table 2 for reference). The SESI v2.8 was positively correlated with trust in science (r = .267, p < .001) and negatively correlated with religiosity (r = −.226, p < .001). Those participants with higher self-reported levels of education also had higher scores on the SESI v2.8 (r = .249, p < .001). The SESI v2.8 was also negatively correlated with political conservatism, meaning as participants ranked themselves higher on a scale from 1 (very liberal) to 7 (very conservative), the scores on their SESI v2.8 decreased (r = −.268, p < .001).
Item response theory (IRT) analysis
As a final evaluation of our scale, we conducted IRT analysis, employing a graded response model (or ‘GRM’; see Samejima, 1969, 1997). GRMs are used in cases in which some or all items in a scale are ordered categorical responses (e.g., Likert-type or Likert-type responses). The GRM specifies, for each question, the likelihood that someone with a given score on the SESI will choose a certain response level.
IRT assumes that the scale measures a unidimensional latent trait (here, understanding the social enterprise of science). This trait is referred to as “theta” and is often described as “ability.” The scores along theta resemble standardized scores and are often centered on 0. The unidimensionality of the scale was determined by examination of the eigenvalues in an analysis of the item covariance matrix.
A benefit of using IRT analysis methods is that we can evaluate questions along two parameters: “difficulty” and “discrimination.” Difficulty is the location along theta that is the halfway point between the minimum probability of answering correctly and the maximum probability of answering correctly where the slope is maximized. Discrimination, then, is the maximum slope, or how strongly the item discriminates between participants who do and do not answer the item correctly. By evaluating the item parameters, we can determine whether items are too difficult for our sample (e.g., item theta is >3), too easy (e.g., item theta <−3), if the item has very low discriminatory power (e.g., discrimination <.25), and/or if the likelihood of answering the item correctly is inversely related to scores on the index (i.e., a “bad” item). For the items that had multiple response options (i.e., the Likert-type items), in place of a single difficulty parameter, the GRM provides a “boundary” score. The boundary score defines the point along theta where the likelihood of choosing one of two adjacent response options is equal.
When conducting the GRM, true or false questions were coded so that 1 = incorrect answer and 2 = correct answer. Check all that apply questions were treated as binary response options and were coded just as the true or false items, where 1 = incorrect and 2 = correct. Likert-type questions were coded to start at 1 (incorrect response) to 5 (more correct response). We used the ltm package in R to run the model.
As a result of the IRT, we learned that some of the questions and some of the item response options (for the check all that apply questions) were “bad” items; that is, people who do better on the SESI as a whole, were less likely to answer these items correctly than those who do worse on the SESI as a whole. We removed these questions and response levels from the final survey and re-ran the IRT analysis (see Table 1). The eliminated items and choices from multiple-choice questions can be found in the supporting material. The distribution of the participants theta scores with the bad items removed was bimodal and slightly positively skewed. See Figure 3A.

Distribution of (A) participant theta scores on the SESI and (B) participant scores on the short form of the SESI.
Scoring and Results of Final SESI v 3.0
Scoring of the SESI v 3.0. As stated in section “IRT analysis,” we removed some items and individual responses after performing IRT analysis. The scale was scored in the same manner as previous versions. The code book for this final version of the SESI can be found in the supporting material. Scale analysis and interitem reliability
The mean score for the 25-item SESI v3.0 was M = 16.4 out of 31 possible points (SD = 6.86, range: .33–29.73). Cronbach’s alpha for the SESI v3.0 was strong (α = 0.90). Figure 4 shows the frequency distribution for the final version of the SESI. The complete item wording and individual question difficulty can be found in section A of the online Supporting Material for this article.

Distributions of scores on (A) SESI v3.0 (M = 16, SD = 6.86) and (B) SESI Short Form (M = 2.57, SD = 1.53).
Criterion and convergent validity
The final version of the SESI behaved similarly to previous versions (see Table 2). SESI v3.0 was positively correlated with trust in science (r = .256, p < .001) and negatively correlated with religiosity (r = −.227, p < .001). Those who self-reported as being more politically conservative scored lower on the SESI v3.0 (r = −.266, p ≤ .001), and those who reported higher levels of education earned higher scores on the SESI v3.0 (r = .245, p < .001).
Summary
In conducting this final field test, our intent was to test the validity and reliability of the refined version of the SESI, and to do so with a more representative sample of the American public. Our results with the Research Now sample of 335 participants show that SESI v3.0 has good convergent and predictive validity, as well as a very good level of interitem reliability.
Development of a Short Form of the SESI
Short Form Development
Although SESI v3.0 is a robust and useful new tool for measuring literacy in the social enterprise of science, its length could make it difficult or expensive to employ on longer surveys or on particular types of studies. For this reason, we developed a “short form” version of the SESI (SESI v.3.0s) that focuses not on proficiency but on capturing the widest range of variance in understanding on the SESI with as few questions as possible. To do this, we began by choosing questions across the complete range of item difficulty estimates from the results of the IRT analysis (see section “Round 2 of expert reviews”); specifically questions close to difficulty estimates of −2, −1, 0, 1, and 2 that had the largest discriminatory power. In addition, we included two Likert-type scale questions for which the boundary scores for the response options also span the range of difficulty estimates. The resulting short form includes seven questions (see section B of the supporting material).
IRT
As the item parameters can shift based on the questions included in an index, it is possible that—despite selecting items ranging in difficulty from −2 to +2—their difficulty scores would shift. Thus, we re-ran the IRT analysis with just the short form items and determined that the item parameters did not differ greatly. As with the full SESI, the distribution of theta scores was bimodal, but it was not particularly skewed (see Figure 3B). It should be noted that we did not conduct a separate data collection with the short form, and there is a possibility that the other questions on the survey may have biased individuals responses to the seven questions included here. When analyzing data on participants who have only completed the short form, the results may vary slightly.
Validation of the Short Form
Scale analysis and interitem reliability
The mean score for the SESI v3.0s was 2.89 (SD =1.67). The complete item list, wording, and difficulty can be found in the supporting material to this article.
Criterion, convergent, and predictive validity
The SESI v3.0s was highly correlated with the SESI v3.0 (r = .859, p < .001). It behaved as predicted in correlations with demographic variables and other included metrics (Table 2). The SESI 3.0s was positively correlated with trust in science (r = .302, p < .001). The SESI v3.0s negatively correlated with religiosity (r = −.221, p < .001) and political conservatism (r = −.281, p < .001), meaning that as participants ranked themselves as more conservative, their SESI v3.0s scores decreased. Those with higher self-reported levels of education had higher SESI v3.0s scores (r = .289, p < .001).
Summary
In creating this short form version of the SESI, our intent was to present a measurement that could capture variance in the general public in a format short enough to be employed on longer surveys or at less expense than our 25-item SESI v3.0. The resulting SESI v3.0s shows strong convergent and predictive validity. The reliability of the SESI v3.0 is close to the normal level of acceptability, and given the intent of the scale and the IRT results, we believe the scale is best with the inclusion of item Q7 (the removal of which would slightly increase the Cronbach’s alpha).
General Discussion and Conclusion
We conclude by considering some possible objections and misunderstandings that will hopefully lead to clarifications regarding our goals for the SESI instrument and stance concerning its development. One concern involves the novelty of the SESI. In the “Background and Motivation” section, we mentioned a study by Bauer et al. (2000) in which an instrument is developed with motivations similar to our own. We also noted some important ways in which our respective measures diverge. A key difference involves our conceptual frameworks and instrument content: while Bauer et al. focus on teamwork as the main social aspect of science, our instrument also addresses the existence of competition and disagreement in science, which we believe are relevant to the public’s trust of consensus science (Slater et al., 2019). Our measure also goes into greater depth on a number of important social–institutional concepts and processes within science (such as education, peer-discussion/criticism, and the epistemic standing of publications); Bauer et al.’s instrument is more focused on cross-national collaboration and governmental funding schemes than our instrument is. In addition, the development process for our instrument was more extensive, including the IRT analysis detailed in section “IRT analysis.” We report a stronger Cronbach’s alpha for our instrument than do Bauer et al. and have validated a short version of our measure.
Another worry we have encountered involves the extent to which the model of the scientific enterprise implicit in the SESI is really general to all corners of science. For instance, a culture of openness of data is less common in some disciplines (e.g., in the social sciences or within various industries). Or perhaps it might be seen as presumptuous to think that there are settled facts about how the scientific enterprise works. While there are of course facts about the correct answers to items in traditional measures of scientific literacy (the Earth does orbit the Sun), the correctness of items concerning the social enterprise of science are more in question and thus a matter of opinion or value.
Consider the latter version of this objection first. We agree that one should expect a certain degree of reasonable disagreement concerning which elements of the social enterprise of science ought to figure into this aspect of scientific literacy; research into subtleties of scientific practice is ongoing and sometimes contentious. Nevertheless, we believe that something approaching an “overlapping consensus” (to borrow a phrase from John Rawls) may be possible concerning a representative range of important features of the scientific enterprise at the macro scale. The most recent version of the SESI highlights what we and our expert validators believe are generally applicable items (scored in a way that we believe will be regarded as clearly correct), steering away from ongoing debates concerning nuances of the social processes inherent to scientific work and the epistemic dynamics of theory choice. While we believe that most readers will find this to be the case upon inspection of the SESI, we would also highlight the fact that the measure was refined through two rounds of expert reviews including scientists from a variety of fields, as well as historians and philosophers of science. Similar comments apply to the former version of the objection. In designing the SESI, we sought to capture a broadly applicable characterization of the scientific enterprise that will inevitably be subject to local exceptions; our aim was to ensure that such exceptions would be rare and that the instrument would do a good job of measuring individuals’ grasp of basic, general features of the scientific enterprise.
Our reliance on expert knowledge when it comes to the construction and validation of the SESI might raise questions about the extent to which the measure is relevant to the everyday experiences of average people. Here, we need to distinguish between the role that experts can play in settling (to the extent anyone can) matters of fact about general features of the scientific enterprise and settling questions of value. Pace concerns discussed in the previous paragraph, we think that the factual role of expertise should be uncontroversial.
When it comes to the questions of value, the story is more complex. Such questions can take various forms, but two salient ones are (a) whether a certain fact about the scientific enterprise is significant—whether it is important to know in order for one to count as enjoying a certain level of familiarity with the scientific enterprise—and (b) whether the grasp of the social functioning of the scientific enterprise is a worthwhile thing to have. We do believe that expert judgment concerning which features of the scientific enterprise are significant enough to play a role in measuring one’s grasp of this enterprise are possible (question 1). To a certain extent, this is obvious. There is presumably some fact of the matter about the total mass of Ph.D. students in chemistry at a given moment, but no one would be remotely tempted to think that knowing this number should reflect on one’s grasp of the scientific enterprise. That is an extreme example (expert judgment is hardly needed to make this determination), but it illustrates that such determinations are clearly possible; it seems to us quite plausible that on less obvious questions, expert judgment as to what is distinctive and important to know about the scientific enterprise to be counted as having a general grasp of that enterprise is the best that one can do.
Notice that this presumes no official stance on value question (b). Consider a parallel: it is clear that understanding the rules surrounding what constitutes a “traveling violation” in basketball is an important component for one’s understanding of the game of basketball; but this does not, of course, entail that understanding basketball should be important to anyone. Applied to a grasp of the social enterprise of science (SES-literacy, as we might call it), we do not presume that such an understanding of science is relevant to the daily lives of “average people” (cf. Wynne, 1996). It is an open empirical question whether SES-literacy would have instrumental value—for example, enabling better decision-making when it comes to questions of personal and public health or public policy—and a much broader question whether (and in what contexts) there is intrinsic value in such an understanding. The SESI is designed to make answering the former sort of question more tractable.
Along these same lines, some might question the value of developing an inventory for measuring the public’s grasp of the scientific enterprise over and above their grasp of basic scientific facts and the NoS. Isn’t the scientific enterprise already part of the NoS? In one sense it is; science, as it is practiced in recent decades in the United States (as well as many western nations), is inherently social (while there may be a sense in which an isolated researcher conducting experiments in their basement may be regarded as participating in science, this is far from the mainstream model). But as mentioned previously, we have found that most inventories of knowledge of the NoS focus on abstract concepts or very general epistemic features of the scientific process—for example, that science is, in certain ways, tentative and self-correcting, that scientific theories, while in a certain way tentative, are not mere guesses—rather than assessing individuals’ grasp of what social–institutional aspects of the scientific enterprise underlie these more abstract epistemic features of science. Such a grasp is plausibly instrumental to our trust of science as an institution. If, for example, science was “self-correcting” in the sense that a small panel of scientists had the task of deciding which findings were correct and which were not, that should plausibly reduce one’s tendency to trust in a scientific consensus on a given issue. Understanding, by contrast, that there is no such entity (and indeed that there are potential incentives for taking a critical stance toward others’ findings) may very well facilitate one’s trust in scientific consensus (at least in some cases—see Miller, 2013). The SESI thus provides researchers with a distinctive tool for investigating questions in this vicinity.
More generally, we believe that it should be uncontroversial that the epistemic respect properly owed to science—however much, and in what contexts, we deem this to be in the end—stems in large part from the workings of the communities, institutions, and norms in which scientific activities play out (Oreskes, 2019; Strevens, 2020). At present, there are a number of research questions that scholars across a variety of fields are ill-equipped to answer for want of a tool to measure subjects’ grasp of important social aspects of science. How common is this knowledge? How is it distributed? In educational contexts, how and when does it normally come about? Does a better grasp of social aspects of the scientific enterprise indeed predict greater trust of scientific consensus? What are the best predictors of such a grasp? How can educators and communicators best produce it? We submit that answering such questions is a clearly valuable endeavor, particularly in the context of persistent skepticism about the value and trustworthiness of science and the threats these tendencies pose to rational policy-making.
To sum up: this article has documented the development of a novel instrument—the Social Enterprise of Science Instrument (SESI)—for measuring public knowledge of salient, general features of the social–institutional enterprise of science that will facilitate inquiries like the ones described above. Concepts relevant to the SESI were identified through a number of means, including reflection on the Science, Technology, and Society and History and Philosophy of Science literature, interviews with academics, scientists, and members of the public. Several rounds of pilot testing, expert review, and IRT allowed us to hone the instrument to 25 items (SESI v3.0), as well as create a 7-item “short-form” version of the instrument for use in longer surveys (SESI v3.0s). Although the short form no longer contains all of the elements deemed necessary for proficiency in the social enterprise of science, it does sufficiently capture variance among the general public and thus provides a potentially useful tool for investigations into scientific literacy.
Although the described development and validation of this instrument are sufficient, in our view, for the SESI and short-form SESI to be considered useful to the field, there is always room for improvement. Future research should continue to test the reliability and validity of these measures, including those with access to large, nationally representative samples, and improve upon the measure for their and others’ use as deemed necessary.
Supplemental Material
sj-pdf-1-sgo-10.1177_21582440211016411 – Supplemental material for The Development and Validation of the Social Enterprise of Science Index (SESI): An Instrument to Measure Grasp of the Social-Institutional Aspects of Science
Supplemental material, sj-pdf-1-sgo-10.1177_21582440211016411 for The Development and Validation of the Social Enterprise of Science Index (SESI): An Instrument to Measure Grasp of the Social-Institutional Aspects of Science by Joanna K. Huxster, Matthew H. Slater and Asheley R. Landrum in SAGE Open
Footnotes
Acknowledgements
The authors would like to acknowledge the contributions of the Forney Family Foundation and Bucknell University to this research. They would also like to thank the expert panel participants at the annual meeting of the American Association for the Advancement of Science and the biennial meeting of the Philosophy of Science Association and the History of Science Society. MHS acknowledges the financial support of NSF (SES-1734616) for teaching relief and research assistance in 2018–19.
Declaration of Conflicting Interests
The author(s) declared the following potential conflicts of interest with respect to the research, authorship, and/or publication of this article: The authors declare that the research was conducted in the absence of any commercial or financial relationships that could be construed as a potential conflict of interest.
Funding
The author(s) disclosed receipt of the following financial support for the research and/or authorship of this article: This research was funded by the Forney Family Foundation, Bucknell University, and the National Science Foundation (SES-1734616).
Data Availability Statement
The data sets [generated/analyzed] for this study can be found in the [name of repository] [link]. Please see the Data Availability section of the Author guidelines for more details.
Ethics Statement
This research was approved by the Institutional Review Board of Bucknell University (approval no. 1617-047)
Supplemental Material
Supplemental material for this article is available online.
References
Supplementary Material
Please find the following supplemental material available below.
For Open Access articles published under a Creative Commons License, all supplemental material carries the same license as the article it is associated with.
For non-Open Access articles published, all supplemental material carries a non-exclusive license, and permission requests for re-use of supplemental material or any part of supplemental material shall be sent directly to the copyright owner as specified in the copyright notice associated with the article.