
Abstract
Finance literature in sports focuses on three main methods of stock price prediction in soccer: based on match results, pre-match expectations, or match importance. For pre-match expectations, betting odds is commonly used as the indicator of investors’ sentiments. We propose to include Twitter data as another indicator of this variable, and analyze the links among soccer match results, sentiments, and stock returns of the four major Turkish soccer teams. Our results show that social media can be a strong indicator of pre-match expectations and investors’ sentiments in stock price prediction.
Introduction
The size of the global sports industry is 1.3 trillion dollars (Plunkett Research, 2019), and most of the sport-related businesses depend on professional leagues which have the major share. Soccer is a global industry, involving a large number of professionals, businesses, and organizations in investing, producing, organizing, and facilitating a variety of sport activities. It is also one of the most popular sports with more than 4 billion followers, leading sports headlines in almost all the European countries. As a result of high number of consumers, soccer is not only related with sporting activities but also media coverage, advertising, and merchandising. In 2018, the cumulative worth by the Top 20 most valuable soccer teams was approximately US$1.75 billion, with a 34% increase in comparison to the previous year (Reuters, 2019). Most of the soccer clubs around the world have their own private investors, but some of them have made an initial public offering and their stock can be publicly traded over the stock exchange market. In the specific case of Turkey, soccer economy has expanded 5 times within 10 years, having more than 2.5 million audiences and more than a 400-million-dollar market size (Fife, 2019). Four major teams, which are also the focus of this study, lead the Turkish leagues: Fenerbahce (FB), Galatasaray (GS), Besiktas (BJK), and Trabzonspor (TS). They all have become public in Borsa Istanbul in the early 2000s.
The soccer clubs, with publicly tradable stocks, face many risks and challenges both in their team’s match performance and the financial markets. According to Szymanski (1998), the performance of a soccer club on the stock market is directly affected by its team’s failure or success on the field. Winning a match can increase the club’s stock price and make it a valuable asset, and on the other hand, losing a match can cause depreciation of the stock leading to millions of dollars of loss. Because investing in soccer club markets is on the rise (Birkhäuser et al., 2015), researchers have been studying the impact of the team’s match performance on the club’s stock price. Arnold (1991) performed one of the earliest empirical studies on the relation between the sports team performance and their financial status, and found that there is a strong correlation between the revenues of the English soccer clubs and their team performance from 1905 to 1985.
Another example for this correlation is the 2010 Turkish Super League finals where the champion depended on the result of the two matches: FB versus TS, and Bursaspor versus BJK, which would be played at the same hour, on May 16. If FB would win the match or tied, and if Bursaspor would lose the match, FB would have become the champion. A false announcement was made toward the end of the FB match that Bursaspor had lost its match. Following the announcement, the audience entered the stadium and began celebrating. But the reality was different, Bursaspor had won the match and was the real champion. A few minutes later FB supporters realized this mistake in the stadium and went mad, burned down the seats, and created chaos. Figure 1 displays FB’s stock prices before and after this final match against Turkey’s main stock exchange (BIST 100), and it can be observed that while the BIST 100 line is rather stable, FB stock decreases and stays in that level afterward.
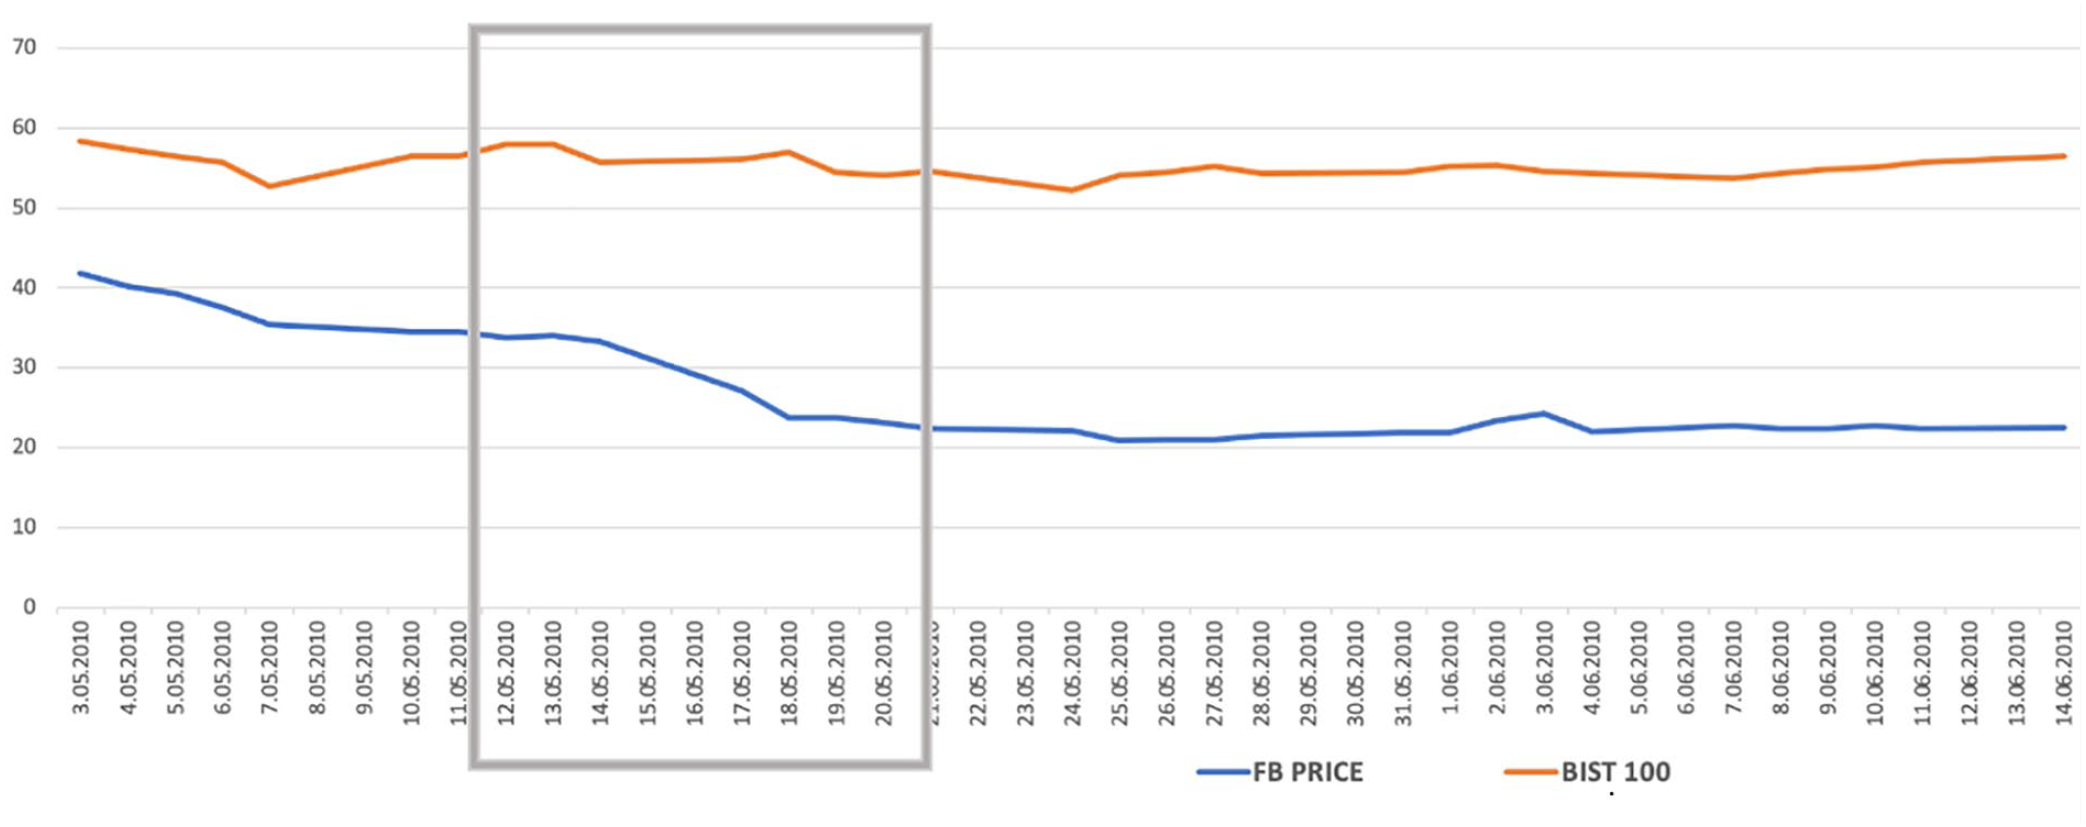
FB stock price and BIST 100, after 2010 Turkish Super League finals.
As Szymanski (1998) stated, the performance of a soccer club is not only related with its sporting performance but also with the club’s financial performance. Naturally, one of the best indicators of financial performance is how an entity (a company or a sporting club) performs in the stock markets. Consequently, the decision makers of both finance and sporting will be interested in identifying the impacting factors on a soccer club’s stock prices, and the predictive models that can be constructed based on such factors.
Based on the finance literature in sports, there are three main methods of stock price prediction in soccer (Safari Langroudi, 2019). The first method focuses on predicting the soccer clubs’ stock prices based only on their match performance. The second type of approach focuses on the impacting factors of the match importance, including the match date, team rankings at the time of the match, and the level of rivalry between the two teams. The third method focuses on the pre-match expectations and investors’ sentiments before the match, as compared with the match results. Previous work has shown that investors’ pre-match expectations and their perception of the club status have a great impact on the clubs’ stock prices.
Betting odds as an indicator of pre-match expectation and investors’ sentiments have been commonly used in the sports literature (Godinho & Cerqueira, 2018). Betting odds represent the probability of an event and show how much money one will win if his or her bet wins. Each team has odds in favor and if a team is more likely to win, its odds will be lower and so is its gain. These odds for a match are usually determined by bookmakers who work as organizations or group of people that accept and payoff the bets in sports events. These bookmakers calculate the probability of each outcome and subtract their margin from the odds to increase their profits. Although most researchers use betting odds as the representation of the pre-match expectation, it has some shortcomings that make it difficult to reflect these expectations.
Due to the recent popularity of social media and advances in Sentiment Analysis (SA) of social media outputs, we examine the public sentiment in Twitter messages as another indicator of investors’ sentiments. Today, Twitter is extremely useful in diagnosing people’s behavior and sentiments and is extensively applied in different areas of economics, business, sports, and social sciences. Jordan et al. (2018) showed that the tweets of everyday users about the U.S. presidential candidates played a role in understanding the change in shifting their electoral fortunes. Lahey (2016) presents that television partners use Twitter data to select what information is considered most relevant to their viewers. Thus, we propose to include Twitter data as another indicator of sentiments and analyze the links among soccer match results, sentiments, and stock returns of the four major Turkish soccer teams in addition to betting odds.
The foundation of this work is initially developed as a thesis (Safari Langroudi, 2019), and for testing our hypothesis, we use the financial data of the four major Turkish soccer clubs with public stocks, and the vastly available Twitter data regarding these clubs, consisting of 13 million real-time tweets. In this study, we aim to predict the amount and direction of the return in the stock price of these four clubs. To predict these variables, we run and compare three models: the first model is based on match performance and betting odds as the sentiment indicator (Model 1), the second model uses Twitter data as an alternate indicator of the sentiments (Model 2), and the third model combines Twitter sentiments and match performance data (Model 3) as the main contribution of our study. Our results display that social media can be a strong indicator of pre-match expectations and investors’ sentiments in stock price prediction. In the following sections, we will review the existing literature and related work on various approaches to predict soccer clubs’ stock prices; describe our data collection, cleaning and structuring procedures; present the methodology used in this study, discussing the predictive analysis models and their results; and finally conclude with future work and research directions.
Related Work
While stock price prediction is one of the most well-studied topics in the finance literature, predicting the financial performance of soccer clubs is a different case. Stock returns of regular companies may depend on their operational performance for which profits, financial position, or emerging product lines are some of the examples. Whereas, the operational performance of soccer clubs is a combination of financial performance and team performance reflected in match results. Thus, the results of the matches played and the extent of meeting the prior expectations of investors appear to be some of the most important determinants of stock prices for soccer clubs. As a result, previous works of research have mostly concentrated on correlational models for stock price prediction, getting use of alternative features. These features can be categorized as match-related measures (performance, importance), and investors’ post-match sentiments based on their pre-match expectations. Our contribution in this work lies in incorporating Twitter sentiments as an alternative feature to indicate pre-match expectations. We have also compared this approach with the previously proposed approaches to stock price prediction for sports clubs.
Match Performance, Importance, and Expectations
Features regarding match performance are actually the results of the soccer team’s on-field performance, which is shown by previous research to have a significant impact on the club’s stock price. Renneboog and Vanbrabant (2000) considered the effect of the weekly sportive performance on the stock price of British soccer clubs and showed that while winning a match can result in positive extraordinary returns of almost 1%, defeats or draws can result in negative abnormal returns of 1.4% and 0.6%, respectively. In the case of Turkish soccer, Devecioglu (2004) worked on the relationship between team performance and stock market price of BJK and GS, as the first Turkish soccer clubs which went public, for the 2002-2003 season. Regarding both the teams, he observed a significant increase or decrease of the stock price following a success or failure at an important event such as the league championship or derby matches. Analyzing the data of five consecutive seasons (1998–2003), Duque and Ferriera (2005) investigated the relationship between the stock price return and sportive performance of the two major Portuguese teams (Sporting and Porto) and showed that there is a positive relationship between winning and the stock price, and an association between draws and losses with negative stock returns. Samagaio et al. (2009) applied cross-correlation analysis and regression analysis for studying the link between the financial performance and sportive performance of the English soccer clubs over 1995 to 2007, and they concluded that there is a moderate correlation between stock market returns and sportive performance. As an opposite case, the study of Gollu (2012), investigating the impact of sportive performance of the four major Turkish teams BJK, FB, GS, and TS on their financial performance over the period of 2002 to 2009, indicated that there is no correlation between the sportive performances of these clubs and their financial performances in the mentioned period. However, other papers contrast these results (Demir & Danis, 2011; Sarac & Zeren, 2013).
There are also certain studies in the literature that take into account the match importance factors in addition to a mere consideration of the effect of team performance on the stock price. Type of the match, the ranking of teams playing the match, time period, and the match location are some examples of these factors. Palomino et al. (2009) analyzed a set of data for English teams in the London Stock Exchange, and for the match importance measurements split the season into the matches played before April and between April and June. They showed that matches that take place between April and June have a higher effect on the stock price.
More recently, Bell et al. (2012) observed 19 clubs in the English league from 2000 to 2007, using two variables to measure the match importance. The first variable was the “degree of rivalry” between the two clubs playing a given match: simply the difference between their current league positions and their final position in the last season. The second was their “final position,” taking into account the number of remaining games and the extent to which the club’s league position differs from the mean. The results showed that each club acts differently, but in conclusion they stated that the importance of the game seems to have a moderate impact on the returns.
Focusing on 13 European teams, Godinho and Cerqueira (2018) applied a new measure of match importance by giving weight to each match based on the expected and unexpected results obtained from the betting odds. Then, they considered both the unweighted results and the results weighted by their proposed measure of match importance and found a significant relationship between the result and the stock performance of those teams. In our work, we not only incorporate some match importance factors such as match type and venue of the match, but also the unexpected results for the three possible outcomes of winning, losing, or draw.
Besides their usage in calculating the unexpected results as in Godinho and Cerqueira (2018), betting odds also reflect the pre-match expectations and thus, the investor’s sentiments prior to the match. Stadtmann (2004) investigated Borussia Dortmund between 2000 and 2002, applying models with different dummy variables such as win, draw, and loss together with the unexpected number of points, defined as the difference between the number of points a team gains in a match and the anticipated number of points for the same match. In addition to showing that the variables are statistically significant, he also concluded that while draw and loss dummies have a negative coefficient, win dummies and unexpected points have a positive coefficient.
Similarly, Scholtens and Peenstra (2009) considered the effect of match results on the stock prices of 42 European clubs from 2000 till 2004. The study concluded that both expected and unexpected wins are followed by price increases and that both expected and unexpected losses are followed by price decreases. Demir and Danis (2011) considered three major Turkish teams and used dummies for expected, weakly unexpected, and strongly unexpected results. They found that when expectations are considered, strongly unexpected wins were followed by significant price increases, and strongly unexpected defeats were followed by larger than expected price declines.
Using features such as match type, betting odds prior to the match, the venue of the match, the lag between the match date and the market opening date and the market index return, Sarac and Zeren (2013) investigated the effect of team performance for three Turkish teams between 2005 and 2012 with a regression model to predict the stock return of these teams, similar to our work. However, they do not consider sentiments or pre-match expectations as a predictor.
Castellani et al. (2015) studied the relationships among soccer match results, betting odds, and stock returns of 23 European soccer teams. They conclude that wins usually lead to price increases, and draws and defeats lead to price decreases with defeats having a larger impact. Also, unexpected results are followed by larger price changes compared with the expected outcomes.
Finally, relating to the concept of predicting stock market prices using Twitter data, Kordonis et al. (2016) developed a framework which gathers past tweets, measures them further, and looks at the adequacy of different machine learning (ML) strategies (e.g., Naive Bayes Bernoulli classification and support vector machines [SVM]), for giving a positive or negative estimation on the tweet. Along these lines, they utilize a similar ML calculation to break down how tweets correspond with stock market price behavior. Their final results appear to be encouraging as they discovered a correlation between sentiments of tweets and stock market price. Derouiche and Frunza (2020) also study the collaboration between individuals’ sentiments on social media and stock prices from a list of sports brands. They utilize day-by-day tweets to build a sentiment score toward 18 game brands. Their discoveries show the transaction between the estimation score and the excess of log return (a) is more critical for football clubs; (b) is more significant the day preceding, which recommends a causal relationship; and (c) is less applicable for large companies.
To the best of our knowledge, previous research is mostly concentrated on correlational studies, exploring the relations among match performance, match importance, and pre-match expectation (betting odds) features. In this work, we explore the relationship between these features and the stock prices of Turkish soccer clubs, through incorporating the fan sentiments expressed on Twitter as a complimentary indicator of pre-match expectations. In the next section, we briefly explain the extraction methods for sentiments from social media and how and their application to predicting stock prices in the existing body of literature.
SA
In this study, we propose to incorporate public sentiments extracted from Twitter data as an alternative indicator of pre-match expectations, and analyze the links among soccer match results, sentiments, and stock returns of four major Turkish soccer clubs. To achieve our goal, we have applied SA, which is briefly the process of recognizing and categorizing opinions expressed in a piece of text, to understand whether the writer’s opinion is positive, negative, or neutral about a particular subject. Although previous work did not consider SA in predicting stock returns of soccer clubs, there are cases in the finance literature where the sentiments as expressed on social media were studied as an index to be included in predictive financial models.
Earlier research on predicting stock market data was based on random walk theory and Efficient Market Hypothesis (EMH; Fama, 1965). As stated by EMH, stock market prices are largely driven by new information, such as the public news. As a result of the news being unpredictable, stock prices follow a random walk pattern, and thus cannot be predicted with more than 50% accuracy (Qian & Rasheed, 2007). Following its emergence, EMH was critically examined by researchers from various fields such as behavioral economics and finance, and it was revealed that stock prices do not necessarily follow a random walk pattern and can indeed be predicted only up to a certain extent (Butler & Malaikah, 1992; Gallagher & Taylor, 2002). Moreover, recent research has shown that although news are unpredictable, social media data can be considered early indicators of news (Gruhl et al., 2005; Mishne & De Rijke, 2006; Liu et al., 2007). Studies on behavioral finance have further proved that individual financial decisions are significantly driven by emotion and mood (Nofsinger, 2005).
There are numerous cases of research incorporating public mood into the financial models to increase their predictive power. Bollen et al. (2011) analyzed daily Twitter feeds using certain mood tracking tools, and then investigated the hypothesis that public mood states are predictive of changes in Dow Jones Industrial Average (DIJA) closing values. They found an accuracy of 86.7% in predicting the daily up and down changes in the closing values and a reduction of the Mean Average Percentage Error (MAPE) by more than 6%.
Antweiler and Frank (2004) classified messages from message boards in three classes: buy, hold, and sell; and with alternative functions, they aggregated these classes into an index of bullishness. The index was then integrated into a regression model which in conclusion did not successfully predict stock returns. Vu et al. (2012) proposed a keyword-based algorithm to classify tweets as negative, neutral, and positive for stock prediction with an accuracy of 75%. Smailović et al. (2013) used Granger causality test to show that sentiment polarity can indicate stock price movements a few days in advance, and by including polarity, they improved the predictive power of their classification model. As a different approach, without extracting the overall sentiments, Nguyen et al. (2015) incorporated the sentiments of specific topics (a certain product or service) of the company into their stock prediction model. They compared the average accuracy over 18 stocks in a single year of transactions and their method achieved 2.07% better performance than the classical historical price method. The common denominator of all these articles is calculating a public sentiment index and incorporating it in regression, time series, or classification models. Our works are also inspired by this approach.
Apart from its integration with stock prediction models, SA of social media data has its own challenges proven by its fast growing body of literature. Researchers studying SA need to deal with various types of subtasks and problems, including aspect extraction, subjectivity detection, entity recognition, or sarcasm detection by applying supervised or unsupervised methodologies. They try to find ways to process raw text, convert it to a structured form, and attain information about a certain entity, like the public opinion on a certain product or a soccer club in our case. The general steps to be applied in SA are similar to any data mining application: data collection, data preparation, feature extraction, model building, and evaluation.
There are alternative ways applied in literature when collecting data from social networks. For instance, Pak and Paroubek (2010) use Twitter application programming interface (API) to collect a text corpus, and Agarwal et al. (2011) acquire labeled data from a commercial source. Ozturkcan et al. (2019) study the public usage of Twitter related with soccer by focusing on 2013 and 2019 leagues in Turkey, due to data availability. Prior to their descriptive analysis, Ozturkcan et al. get help from experts to define soccer-related keywords for purposeful sampling of tweets posted in Turkish for the 2018 and 2019 soccer leagues. We follow this data collection methodology in our work.
After the data collection phase, data should be prepared for analysis. The data preparation phase includes all the activities for converting the raw data to the final data set which is to be fed into the modeling tools. Regarding text mining, after removing all items that are not actual words (links, hashtags, URLs, numbers, stop-words, etc.), raw text data is converted into a tabular format. At this instance, each entry under examination (a tweet, a product review, etc.) becomes an observation, and each unique word (or a group of words) becomes a feature of that observation to be processed by a classification model, where the values of each feature/word can be its frequency in the document, binary representation of its existence or its calculated weight in terms of frequency compared with the other documents. In short, each document is represented as a vector of words with their calculated frequencies or weights. While single words can be features, using a combination of adjacent words is also a common approach named as n-gram representation, where n is the number of adjacent words extracted. Different values for n affect the precision of classification in different ways. Akaichi et al. (2013) tried different combinations of n and observed that SVM and Multinomial Naïve Bayes achieved the highest accuracy of classification when unigrams and bigrams are consolidated. On the other hand, in a similar study, Zhai et al. (2011) acquired less accurate results when using a mix of n-grams. They concluded that bigrams achieve better results than other n-gram features. In our study, following the phase of cleaning the text from non-words, hashtags, emoticons, and punctuation, we have achieved the best results by converting raw text to a unigram vector representation before training the classifiers.
As mentioned above, documents can be represented by a vector of words with their frequencies, by their binary representation of existence or by a special weighing that implies the importance of each word in a certain document. Pang et al. (2002) acquired the best results in their models when the feature values are set as binary representation of a word’s existence. Inspired by this work, other researchers have applied the same strategy when dealing with text sentiment classification. Some of the examples are Pak and Paroubek (2010), Barbosa and Feng (2010), Ye et al. (2009), and Habernal et al. (2014). However, it is also discussed in literature that when dealing with a corpus, in most of the cases it is not enough to represent documents as word frequency or binary vectors. Each word has a significance factor when its existence in other documents is compared. A very common word in a specific language will appear in most of the documents, thus its existence in a document will not make a significant difference when compared with other documents. Thus, a weighing strategy for the word frequencies in each document might help characterize them better. Term Frequency–Inverse Document Frequency (TF-IDF) is used to determine the significance of a word in a specific document by comparing its frequency in the whole corpus and weighing each word with a calculated index. Smailović et al. (2013), Barbosa and Feng (2010), and Barnaghi et al. (2016) are some classification examples applying TF-IDF conversion of word frequencies. In our work, prior to data training, unigram vector representation of raw text is converted to TF-IDF form and a significant gain in accuracy is achieved as a result.
Following the data preparation and feature extraction phases, it is common to apply supervised or unsupervised methodologies to extract opinions from bulk text. Supervised methodologies, as applied by this study for analyzing sentiments, mostly consist of the application of Maximum Entropy, Naïve Bayes, Logistic Regression, and SVM classifiers. These methodologies were applied by Zhai et al. (2011), Pang et al. (2002), and Barbosa and Feng (2010) previously. However, an issue about supervised methodologies is that they require human labeled data to be trained. In addition, supervised algorithms are trained on text instances with labels that differ according to the problem under study. For the case of SA, they are usually labeled as positive, negative, or neutral. Moreover, supervised classifiers perform much better when run on a huge amount of labeled data. Unfortunately, acquiring large amounts of labeled data is an expensive and time consuming task.
As Twitter messages do not contain a grading mechanism done by users, in most of the cases, researchers need to organize labeling teams prior to SA. J. Read (2005) proposed an alternative approach for annotating microblogging messages. He analyzed Usenet newsgroup messages and categorized messages according to the emoticons used in the message. Messages containing emoticons such as “ ” or “
 ” were used to create a training set for running classifiers. While happy emoticons made the message “positive,” sad or angry emoticons made the message negative. Read (2005) achieved up to 70% accuracy by applying SVM and Naïve Bayes on the “emoji” labeled data. Pak and Paroubek (2010) follow a similar strategy to construct corpora of emoji labeled positive and negative Twitter messages and run classifiers afterward. They also apply objective text classification (classification of the third class: neutral messages) with the same technique on arbitrarily large data. They collected Twitter messages using the Twitter API for positive and negative messages, and also consumed messages of news agents as “New York Times” for classification of neutral tweets. As Twitter messages are limited to a maximum of 280 characters, they assumed that “an emoticon within a message represents an emotion for the whole message and all the words of the message are related to this emotion” (Pak & Paroubek, 2010, p. 1321). They apply a mixture of these techniques: pre-classification of Twitter messages according to their emoticon content, then applying ML classifiers on the automatically labeled corpora as exactly we have done for this study.
Applying the seminal methods of SA, we extract the fan sentiments toward our selected Turkish soccer teams, expressed on Twitter. In addition to match performance, match importance, and betting odds factors, we also incorporate these sentiments in our predicative modeling phase to enhance our estimations of pre-match expectations and increase the prediction power.
Data Collection and Analysis
In this section, we present our data collection process of four major factors: match results, betting odds, stock prices, and Twitter data. We have processed these four sources and extracted certain features for training our classifiers. The focus is on the four important teams in the Turkish Soccer League, namely GS, FB, BJK, and TS, which are also the teams having the largest fan base in Turkey as introduced below.
Founded in 1905, GS is the most successful Turkish team overall, consisting of the Galatasaray High School student members. GS has won 22 Super Leagues and 18 Turkish Cups since their conception. Moreover, in 2000, GS also won the Union of European Football Associations (UEFA) Cup and became the only Turkish team acquiring this title. GS is based in Istanbul and their stocks went public in 2002. FB is also one of the most successful teams in Turkey, founded in 1907 and based in Istanbul with 19 Super League and six Turkish Cup championships. Winning the most number of national championship titles among all the Turkish teams, FB’s stocks went public in 2004. Founded in Istanbul in 1903, BJK is the first gymnastics club concentrating on soccer after 1910, as a result of the increasing popularity of soccer in the Ottoman Empire. Having one of the most socially active fan clubs called “Carşı,” BJK stocks went public in 2004. TS is a relatively new club founded in 1967 through the merger of some local teams, and it has won six Super Leagues and eight Turkish Cups. Being the first club based outside of Istanbul and winning the Super League, TS stocks went public in 2005.
Match Results, Betting Odds, and Stock Market Data
Regarding the match results, we have retrieved data from 2004 to 2019 for the four Turkish teams in our study, in April 2019 from https://us.soccerway.com. The data contain the date of the match, type of the match, and the results. We took into account different match types like Turkish Super League, Turkish Super Cup, UEFA Championship League, UEFA Europa League, and Friendly matches. We also collected the betting odds for every match appearing in our teams’ database, retrieved in April 2019 from https://www.oddsportal.com. This site calculates the average odds of different bookmakers for each match, and the features that we use from this source are match date and time, teams, match result, home team’s winning odd, draw odd, and away team’s winning odd. As it is displayed in Table 1, FB has the highest percentage of wins and the least percentage of losses by the number of Turkish League matches it has played. On the other hand, TS is at the opposite side, having the least percentage of winning and the highest percentage of losing by the number of matches played when compared with the other three teams. According to the percentages, GS and BJK have a similar on-field success rate.
Percentages of Wins, Draws, and Losses.

Note. BJK = Besiktas; FB = Fenerbahce; GS = Galatasaray; TS = Trabzonspor.
For the financial performance of the clubs, we have collected the daily stock market information for each team since the beginning of their stock’s public initiation until March 2019, from Yahoo Finance. The data contains transaction date, stock’s opening and closing prices, highest and lowest prices, and the volume of the stock sold on a given date. We have also collected the Borsa Istanbul BIST 100 on the same dates, to consider the overall market changes. Summary statistics of the closing stock prices of these four teams are displayed in Table 2, and it is clearly visible that with coefficients of variations around 61%, BJK, GS, and TS have a relatively high dispersion around the mean closing price, whereas FB with a coefficient of variation of 44% has the least dispersion.
Closing Price Summary Statistics.

Note. FB = Fenerbahce; BJK = Besiktas; GS = Galatasaray; TS = Trabzonspor.
Twitter Data
This section may be divided by subheadings. It should provide a concise and precise description of the experimental results, their interpretation as well as the experimental conclusions that can be drawn.
Following Ozturkcan et al. (2019), by getting use of Twitter’s public API, we collected purposefully selected tweets posted in Turkish for the 2018 and 2019 soccer leagues using Logstash (for collecting) and Elasticsearch (for indexing). Regarding the 2018 and 2019 leagues, 172 keywords were separately chosen by two researchers, two soccer fans, and a sports consultant, which were then used to purposefully collect streaming data from Twitter. We acquired around 20,000,000 soccer-related tweets between December 2017 and March 2019. Following the selection and clustering of the keywords specific to our four selected teams, we applied a second filter to distribute the twitter messages among these teams. As a result, a total of 12,814,581 tweets regarding these teams were collected, as shown in Table 3. We then transferred the filtered data to a distributed computing environment backed up by Apache Hadoop for further processing.
Twitter Data.

Note. FB = Fenerbahce; GS = Galatasaray; TS = Trabzonspor; BJK = Besiktas.
The majority of this filtered data belongs to FB and GS teams followed by BJK and TS, indicating the fan base for these four teams. As mentioned before, FB, GS, and BJK are clubs from Istanbul, supported by the majority of the soccer fans in Turkey. Whereas TS, although being among the Top 4 teams, is local to the Black Sea region of Turkey and has a fan base less than each of FB, GS, and BJK. Figure 2 shows the frequency of tweets in the time window of December 2017 and March 2019. Note that the data during the months of July, August, and September 2018 is missing due to server shutdown. The most obvious fact about the tweet volumes per day is that, whenever the volume exceeds 5k, an important event such as an UEFA or Turkish League match has been occurring.

Tweeting volume.
Following the data collection phase of Twitter messages, we applied a data mining approach, as detailed in the previous section, for the sentiment extraction with the phases of emoticon extraction and tweet labeling, text cleaning, feature extraction from text and finally model building, validating, and predicting. From emoticon extraction and message labeling to predicting, we used Apache Spark distributed computing engine. Processing a total of 20,000,000 soccer-related tweets, 1,131 unique emoticons were extracted. Among these, some are not representing a sentiment or are not very frequent. Finally, we selected 50 emoticons with more than 80% frequency for each class (positive, negative, and neutral). As an example, happy face emoticons are regarded as positive; angry or unhappy face emoticons are regarded as negative. Sports news accounts use flags, calendar signs, or notification signs in their tweets. Thus, the most frequently used emoticons by these accounts are regarded as neutral. Some of the most frequently used emoticons are listed in Table 4.
Top 15 Emoticons for Each Class.

After the extraction and selection of significant emoticons, we applied a rule-based approach for labeling the whole soccer-related tweets. Tweets containing at least one negative emoticon were labeled as negative; tweets without any negative emoticon and having mostly positive emoticons were labeled as positive, and finally tweets having mostly neutral emoticons were labeled as neutral. Following this process, a total number of 586,895 tweets were filtered out to be the training set, and the data are distributed as displayed in Table 5.
Distribution of Tweets After Labeling.

To check the consistency of the content with their labels, word cloud plots of the most common phrases used in the three classes are shown in Figure 3. In the positive set, words with positive sentiments such as “gol (goal),” “ustun (superior),” “çok (a lot), “basarili (successful)” can be observed. In the negative set, interestingly, “Galatasaray” and “GalatasaraySK” are the most common words which are directly related with the team GS. Apart from them, the negative set contains words such as “saklabana (an insult in Turkish),” “kanser (cancer),” and “kiralik (for rent).” In the neutral set, we observe some player names (Erhan, Emre) and words such as “lig (league),” “maclardaki (at the matches),” and “ortalama (average).” The words are consistently distributed among the three sets, and this distribution will directly affect the classifier algorithm’s tendency to classify a certain tweet. One can easily see that there is not an obvious intersection of words between these sets, which will increase the classifier’s performance. Another fact is that, in three of the data sets, words such as “1907attack,” “https,” “UU001f92a,” “nKaynak,” or “co” also appear. These words are related with user accounts, links in tweets and special characters like the emoticons, and do not directly represent the sentiment in the tweet text. This fact puts forward the necessity of cleaning the text, getting rid of such symbols or non-words. Thus, before training the classifier, all stop-words and non-words (punctuation, special characters, numbers, links, hashtags, emoticons) not representing a sentiment or a lexical meaning are removed from the text of all Twitter message instances, with the exception of exclamation marks which particularly indicate strong sentiments in Latin-based languages. Moreover, words with two characters are intentionally not removed as they are frequently used as slang and swearwords by soccer fans.

Most common words for positive, negative, and neutral data sets.
As keywords and activities vary according to soccer seasons, 2018 and 2019 Twitter data has been treated separately in the sense of labeling and modeling. It is clearly seen in Table 5 that, for both seasons, positive tweets are several times more in number than negative or neutral tweets. If any model is trained on this distribution, it is certain that it will predict the positive set much better than the others because it will experience the positive examples more frequently. To solve the unbalanced data set problem, as described in Seiffert et al. (2008), oversampling on neutral and negative sets was applied separately for the data of two seasons: Negative and neutral number of tweets of 2018 season were oversampled by 190%. For 2019 season, negative tweets were oversampled by 380%, and 2019 season neutral tweets were oversampled by 285% randomly with replacement. As a result, all classes contain a similar number of tweets in the oversampled data set. Our final model’s validation accuracy increased by 5% when we applied only random oversampling.
Predictive Modeling and Results
In simple terms, as also displayed on the flow chart in Figure 4, our methodology consists of building statistical models for two major tasks: classifying sentiments of soccer-related Twitter messages as positive, negative, or neutral, and predicting the stock price return of the corresponding soccer clubs through a combination of data sources, namely Twitter data stream, match results, betting odds, and stock market data. Naturally, we calculate alternative daily aggregate sentiment indexes from our sentiment classification model to be further used as a feature in our regression and classification models. Moreover, match data provide the match results and specifications of the matches played, and finally, stock market data provide us the daily transaction information. In this section, we will present these models and discuss the results.

Research methodology.
SA
Following the text cleaning and oversampling operations of the annotated tweets, feature extraction is applied to transform the unstructured text content of these tweets to a structured form. First, bag-of-words representation of the raw text is acquired prior to TF-IDF calculation. Similar to the work done in previous research, a dictionary is formed by all the words in the collected twitter training data, and words appearing less than 20 times in the whole corpus are omitted. The words in the dictionary are the features for each tweet, and a tweet is represented by a vector of the count of each word in this dictionary. As the importance of words is not reflected well in the word counts, a further operation was applied for each tweet to calculate the TF-IDF values with the following formulas:
Term frequency (TF) is calculated by TF(t, d) = ft,d which represents the number of times that term t occurs in document d, where each document is a tweet in our case. The inverse document frequency (IDF) is a measure of how much information the word provides, and it is basically the logarithmically scaled inverse fraction of the documents that contain the word. IDF calculation is as follows:

Finally, the TF-IDF is calculated by TF(t, d) × IDF(t), which is able to give information about both the words’ existence and its importance in each tweet. As a result of this transformation process, each tweet in our data set was represented with 2,043 most frequently occurring words. This number is quite low and shows that sports-related Twitter messages in Turkish do not contain a large vocabulary.
When the data set is ready for training, it is split into train and validation sets by 70% and 30% proportions, respectively. Naïve Bayes, SVMs, and Logistic Regression classifiers provided by Apache Spark environment were trained and tuned with validation set approach that helped attain the best hyper-parameters for these classifier algorithms. Best accuracy on the validation set was achieved by Multinomial Logistic Regression classifier which is known for its good performance on large data sets in the Spark ecosystem. The performance of the algorithms tested is displayed in Table 6.
Sentiment Classification Performance Summary.

Note. SVM = support vector machines.
While Naïve Bayes and Logistic Regression classifiers train approximately in 1 hr, SVM classifier completes training in 4 hr, which is not surprising as SVM applies kernel transformation and increases the feature size. In our experiments, Logistic Regression model with a regularization parameter of 0.01 and 100 iterations at most was the best classifier acquired both in terms of performance and processing time. The Logistic Regression model was further trained on the whole data without splitting the validation set, on 2018 and 2019 data sets separately as the keywords differ between the two seasons.
In Figure 5, learning curves of our Logistic Regression classifier for the first 25,000 training examples is presented on the left, and the confusion matrix provided by model’s prediction on the validation set on the right. As it is clearly observed from the learning curve of the classifier’s performance, the model stabilizes after being trained with 10,000 observations. Training accuracy is slightly higher than validation accuracy but without a large gap, which proves that the model does not overfit the training data. Moreover, when the model’s performance on each class is separately examined, it is obvious that the model predicts the neutral class at best with 78.86% accuracy. It is followed by 78.5% accuracy for the positive class and 65.54% accuracy for the negative class. Data augmentation applied with oversampling of the negative and neutral sets has worked well to increase the model’s performance on the scarcer classes. Interestingly, even though the oversampled number of observations for the negative and neutral sets are close to each other in the training data set, the model predicts the negative class 10% worse than the neutral class.

Learning curves and confusion matrix. (A) Training and validation accuracy curves and (B) confusion matrix.
Following the model selection and training, we ran the classification algorithm on the complete data set of 20,000,000 tweets and regenerated the word clouds to find out the trending words in each data set, as displayed on Figure 6. Naturally, as our data set contains purposefully selected Twitter messages of the four major teams, the trending words for each class mostly consist of these team names. When further analyzed, “galatasaray” and “fenerbahce” are more dominant in the positive set when compared with “besiktas” and “trabzonspor.” Moreover, team name “fenerbahce” is the most common team word in the negative set whereas others appear much less than the words “gol” (goal), “bir” (one), “yok” (none), and “transfer” (transfer).

Most common words following the labeling of the complete data set.
To validate the performance of the final model, a ground truth data set was prepared. We sampled a total of 10,150 tweets from 2018 and 2019 data sets and distributed them randomly to 18 graduate students for labeling. The students labeled the twitter texts in three categories: positive, negative, and neutral. As shown on Table 7, our final model achieved an accuracy of 70% on the ground truth, which is not very different than the performance of the model on validation data of the automatically labeled tweets. However, when the performance on each class is considered, recall values show us that our classifier algorithm performed best on the positive set and worst on the neutral set. As the last step of the work, after ensuring the performance of the model on ground truth data, the two models for the 2018 and the 2019 season were used to predict all of the 12,814,581 tweets for the four major teams.
Sentiment Classification Performance on Ground Truth Data.

Predictive Modeling of Stock Price Return
Prior to constructing predictive models of stock price return, we first tested the hypothesis to check if a match has an effect on the stock price. For this purpose, we divided the days based on the stock trade and labeled them as follows:
First stock traded after the match: 0.
Last stock traded before the match: –1.
Stock traded 1 day after the match: 1.
Other days: 2.
We ran Welch’s two-sample t test on the difference between the means of stock prices before and after the match. As shown in Table 8, regarding all the four teams, the last stock traded before the match is significantly different than the first stock traded after the match, which explains that the match events have an impact on the stock price returns. Herewith, we can proceed to present our models and predict the stock price return based on the match factors, betting odds, and SA.
Welch t Test p Values.

Note. FB = Fenerbahce; BJK = Besiktas; GS = Galatasaray; TS = Trabzonspor.
Our models are built to predict two major dependent variables: the daily return in the stock’s closing price for each team, defined as the numeric percentage change between the first stock traded after the match and the last stock traded before the match divided by the first stock traded after the match, referred to as “change”; and the binary direction of the stock price return as “up” or “down,” referred to as “changedummy.” For the daily return, we have applied linear regression as it proved to be an effective and simple method, whereas regarding the direction of change, we have built alternative classification models using linear discriminant analysis (LDA), quadratic discriminant analysis (QDA), and logistic regression methods. For both the regression and classification models, we have removed the outliers which fall outside of ±1.5 times interquartile range (IQR) of the stock data for better analysis. For all the analysis regarding the prediction tasks, we have used the R Ecosystem.
To predict these two variables, we have built three different models and compared their results to find the effect of match performance, betting odds, and SA, individually and together, on each club’s stock price return. The first model is based on match performance and betting odds (Model 1), the second one is built only on Twitter data as an indicator of the sentiments (Model 2), and the third model combines Twitter sentiments and match performance (Model 3). We run each model on each team, then merge all the teams’ data and finally run another model on the merged data. Regarding variable selection for both the regression (predicting the magnitude of change) and classification (predicting the direction of change) models, we have followed a stepwise selection approach from both sides and selected the variables based on R-squared/root mean squared error (RMSE) and Akaike Information Criterion (AIC). Following variable selection, we tuned and validated our models using 10-fold cross-validation with three repetitions. Table 9 show variables selected for each classification and regression sub-models. In the following subsections, our models and their results will be discussed in more detail.
Model Variables.

Note. All variables are numeric. FB = Fenerbahce; BJK = Besiktas; GS = Galatasaray; TS = Trabzonspor; LDA = linear discriminant analysis; QDA = quadratic discriminant analysis; LR = logistic regression.
Types are c: categorical, n: numeric, and b: binary.
Model 1
The first model we propose for the soccer teams’ “stock price return” and “the direction of return” prediction is built on features extracted from match performance and betting odds data. This model helps infer the effect of match performance and betting odds features on the change and “changedummy” dependent variables.
Regarding the linear regression model for predicting the magnitude of change of the stock price return, we have attained a better accuracy than the previous study by Sarac and Zeren (2013), as shown in Table 10. The linear regression model for Fenerbahçe stocks, while having the highest explanatory power, is also the most significant and has the best multiple R-squared (22.5%) and adjusted R-squared (21.5%) performance outcomes. Compared with the previous studies, this result with only match performance and betting odds as the indicator of pre-match expectation is noteworthy. Moreover, BJK’s model has an explanatory power of 12.8% and adjusted R-squared of 12.2%, which is also higher than the values reported by Gollu (2012). Having a relatively low RMSE and mean absolute error (MAE), GS’ model is also statistically significant with an explanatory power of approximately 9%. In TS’ model, the explanatory power is 8%, and the model is statistically significant. When we combine all the teams’ data together, the model built on the merged data (Total model) is also significant with an explanatory power of 11%.
Linear Regression Prediction Performance.

Note. CV = cross validated.
To predict the direction of each team’s stock return, we achieved the highest accuracies running LDA, QDA, and Logistic Regression methods. As we have done with the stock return prediction task, all of the teams’ data are merged to run a Total model. Performance outputs are presented in Table 10. For FB and BJK, all the models work better than the baseline (prior probabilities from past data), and are statistically significant. Regarding GS, LDA and Logistic Regression models work better than the baseline, but QDA model has a lower cross-validation accuracy below the baseline. While LDA and Logistic Regression models work better for TS, QDA model has a lower cross-validation accuracy than the baseline. For the Total model, QDA performs better than the other predictive methods.
Regarding both the classification and prediction tasks of Model 1, one can easily see on Table 9 that the common variables for all teams and the Total model appear to be goal difference, change in Borsa Istanbul, the lag between the match date and the next trade date, match being played home or away, unexpected draw when win is expected, unexpected loss when win is expected, and if the match is a championship match.
Model 2
As already mentioned, Model 2 predicting the stock return and the direction of return is built on only the aggregate daily sentiments extracted from Twitter data. To find the effect of Twitter sentiments on the stock price returns individually, neither the match performance nor the betting odds features are used in this model. We also run the Total model on the overall data to compare the results.
Regarding the stock return prediction task, when compared with Model 1, accuracies of Model 2 built on only the sentiments for FB, BJK, and TS are lower than Model 1. Whereas for GS, this model works about 1% better than Model 1. All models being statistically significant, FB’s explanatory power is 14% which is 8% lower than Model 1 results; BJK has an explanatory power of 9%; and GS having an explanatory power of 9.9%, which is higher than Model 1 results; and finally TS’ model has an explanatory power of 6.6%. The Total model is also significant, but its explanatory power is lower than that of the other models.
Regarding the classification of direction of return (as up or down), as shown in Table 11, similar to Model 1, we have run LDA, QDA, and Logistic Regression models on each team’s data separately and together. For FB, all three prediction methods are statistically significant, LDA having the highest accuracy and QDA having the highest cross validated (CV) accuracy. For BJK, the model does not appear to be significant, having p values higher than 5%. However, the models’ CV accuracies are higher than the baseline, LDA being the classifier with the highest accuracy. For GS, the accuracies are not satisfactory, and based on the p values, the models are not statistically significant with CV accuracies lower than the baseline. For TS, the QDA model works well in the training accuracy, but not in the CV accuracy. The TS model has CV accuracies lower than the baseline and p values higher than 5%, thus making it insignificant. The Total model is also not significant, and CV accuracies are lower than the baseline. In conclusion, for predicting the direction of return, Model 1 works better than Model 2 based on performance outcomes.
The Direction of Return Prediction Performance.

Note. LDA = linear discriminant analysis; QDA = quadratic discriminant analysis; CV = cross validated.
For both the classification and prediction tasks of Model 2, we observe a decrease in the prediction performance. The common variables for all teams and the Total model appear to be goal difference, change in Borsa Istanbul, lag between the match date and next trade date, match being played home or away, unexpected draw when win is expected, unexpected loss when win is expected, and if the match is a championship match.
Model 3
This model is built on a combination of variables from Twitter sentiments, match performance, and betting odds data. For the linear regression model, regarding the prediction of stock price return as shown in Table 10, the multiple R-squared and adjusted R-squared of Model 3 are higher than both previously discussed Models 1 and 2. One can easily show that, the Twitter sentiments in addition to match performance and betting odds data can improve the prediction of the amount of soccer clubs’ stock return for our four Turkish teams. While all being statistically significant, the models’ RMSE and MAE values are also lower than the previous models. As expected, the Total model has the lowest explanatory power, as each teams’ stock acts differently. Thus, combining all the data would not necessarily increase the R-squared value. Model 3 for predicting the change for BJK appears as the best achieved model in this study, with an explanatory power of 83%, which is higher than Model 1, Model 2, and the previous studies.
Regarding the prediction of direction of change of stock returns, as we have done previously, LDA, QDA, and Logistic Regression methods have been applied, and in Table 11, the significant best performing methods are summarized. For FB’s models, the accuracies are better than the baseline significantly, with the best model appearing as Logistic Regression having 0.81 CV accuracy. For BJK, while QDA has the highest CV accuracy, Logistic Regression has the highest training accuracy. In the GS’ models, as we can see the accuracies are more than the baseline, with the best model as Logistic Regression with 0.76 CV accuracy. In terms of accuracy, Logistic Regression method works better than LDA and QDA models for TS, but in terms of CV accuracy LDA has the highest. Regarding Model 3, the Total model is also significant having higher accuracies than the baseline. To conclude, based on Model 3 accuracy and CV accuracy results for the prediction of the stock return direction, it can be stated that the combination of the match performance, betting odds, and Twitter sentiments can predict the direction of the return better than the two previous models. This means incorporating Twitter sentiments to the match performance and betting odds data can improve the model accuracy for predicting the direction of the stock price return.
For both the classification and regression tasks of Model 3, we observe an increase in the prediction performance, while the most common variables for all teams and the Total model appear to be Score 1 ([number positive tweets – number negative tweets]/sum), Score 2 ([Positive – Negative]/[Sum – Neutral]), Score1 with 1 day lag, positive change between two days, number of positive tweets per day, total number of tweets per day, change in Borsa Istanbul, change in ISE with 1 day lag, and unexpected loss when win is expected.
Conclusion and Future Work
In this work, we have examined the hypothesis that fan sentiments expressed on social media can improve the prediction accuracy of football club stock prices in addition to betting odds, as a secondary indicator of pre-match expectations. Through a methodological process, we have shown that adding the processed sentiments expressed on Twitter to the previously proposed methods can improve the accuracy in predicting the amount and direction of change in the stock prices of the four major Turkish soccer clubs.
We first tested the hypothesis that whether a match has an effect on a soccer club’s stock price and found that the mean stock prices before and after a match are significantly different. Subsequently, we proposed the inclusion of fan sentiments expressed on Twitter in addition to betting odds as an indicator of the pre-match expectation and hypothesized that it could improve the prediction models. Running three alternative models, we have observed that the first one, built on match performance and betting odds data, could explain the variance of change in the stock price of the four major Turkish teams on average, 6% better than the previous studies. However, running the second model, built solely on Twitter sentiments to predict the amount and the direction of stock return, our results showed that sentiments individually are not good predictors for such dependent variables. Finally, we merged match performance and betting odds data with Twitter sentiments to check whether adding these sentiments to our initial predictive model could improve the results. As a result of our analysis, it is evident that Twitter sentiments in addition to match performance and betting odds data can improve the prediction of both the magnitude and direction of change in the stock prices, significantly. On average, respectively, for FB, BJK, GS, and TS, the best classifiers performed 10.67%, 11.78%, 7.27%, and 12.82% better than the first model.
In conclusion, we have shown that adding Twitter sentiments to betting odds as another indicator of pre-match expectations can improve the prediction accuracy of stock prices for Turkish soccer clubs. Although our case study examines the Twitter sentiments on the four major Turkish soccer clubs, our proposed methodology detailed in Figure 4 is general and can be applied to other soccer clubs as well, using fan sentiments extracted from other social media outlets based on the sentiments analysis methodologies explained in section “Related Work.”
This work has several limitations that should be addressed in future works following this line of research. First, we have only studied the daily direction and returns; however, the weekly and monthly returns of the stock price can provide managerial insight for the club owners and shareholders. Second, considering more alternative match importance factors such as the ranking of the playing teams, division of the season and giving more importance to the final matches, as well as the division of the on-season and off-season periods should be examined to increase the performance of such models. Finally, other influential factors of the stock markets, such as the interest rates, number of investors, dividends, and overall economic situation, should be taken into account in building a more specific prediction model.
Footnotes
Declaration of Conflicting Interests
The author(s) declared no potential conflicts of interest with respect to the research, authorship, and/or publication of this article.
Funding
The author(s) received no financial support for the research, authorship, and/or publication of this article.