
Abstract
This study aims to examine the impact of different capital ratios on Non-Performing loans, Loan Loss Reserves, and Risk-Weighted Assets by studying large commercial banks of the United States. The study employed a two-step system generalized method of movement (GMM) approach by collecting the data over the period ranging from 2002 to 2018. The study finds that using Non-Performing loans and Loan Loss Reserves as a proxy for risk, results support moral hazard hypothesis theory, whereas the results support regulatory hypothesis theory when Risk-Weighted Assets is used as a proxy for risk. The results confirm that the influence of high-quality capital on Non-Performing loans, Loan Loss Reserves, and Risk-Weighted Assets is substantial. The distinctive signs of Non-Performing loans, Loan Loss Reserves, and Risk-Weighted Assets have indications for policymakers. The results are intimate for formulating new guidelines regarding risk mitigation to recognize Non-Performing loans and Loan Loss Reserves and the Risk-Weighted Assets for better results.
JEL Classification: G21, G28, G29
Introduction
Since the order of the Basel-I Accord in 1988, followed by Basel II in 2004 and most as of late the Basel III Accord in 2010, the definitions of bank capital has advanced significantly in an exertion to improve banking framework soundness and fill the harmonization hole that had caused past monetary crises. The 2007 to 2008 economic crisis accurately interpreted that capital provisions alone are lacking to forestall bank distresses.
The weaknesses of prior Basel Accords provoked the Basel Committee on Banking and Supervision (BCBS) to execute one more arrangement of rules for banking guidelines. The BCBS’s endeavors brought about the Basel III rules (Basel III recommended conservative buffer 2.5% of risk-weighted assets (RWAs) to enhance the loss absorption capacity during stressful conditions. For detail see: http://www.bis.org/bcbs/basel3.htm.), which expect banks to be increasingly thorough by rethinking capital structure. The Basel III Accord intends to improve the quality and increment the size of a bank’s core capital base. Likewise, the new regulations consider three related ratios of capital as fundamentals. (a) the first is a risk-based capital ratio (TRBCR), which requires a base ratio of 8% against risk-weighted-assets; (b) the Tier 1 capital ratio (T1RBR), which requires a base ratio of 6% of Tier 1 capital to RWAs; and (c) Tier 1 Common equity ratio (T1CER), which requires a base ratio of 4.5% of RWAs. In this paper, we look at the effect of capital on the risk of large commercial banks. In particular, we thoroughly scrutinize different definitions of bank capital (risk-based and non-risk-based capital and capital buffer ratios). Capital fills in as a security component to absorb losses. In this way, it ought to be quite compelling to experts and regulators in the United States because, from one perspective, a holding of a higher capital ratio intensifies the bank’s loss absorption potential. The holding of excessive funds skewed economic enlargement and increases bank risk (Bitar et al., 2018). In recently published studies, scholars explore the importance of capital ratios and their impact on banks risk-taking (Bitar et al., 2016, 2018; Brandao-Marques et al., 2020; Cohen & Scatigna, 2016; Ding & Sickles, 2018, 2019). The contradictory conclusion of the recent literature motivates us to explore and fill this gap.
Most of the previous studies use basic definition of bank capital (equity to total assets) to interpret the impact of capital ratio on risk-taking (Shrieves & Dahl, 1992). This study use and analyze the newly evolved definitions of bank capital like total risk-based capital ratio, tier one risk-based capital ratio, tier-one risk-based Common equity capital ratio, total risk-based capital buffer ratio, tier-one risk-based capital buffer ratio, and Common equity buffer ratio. The measurement of risk using the bank balance sheet remains contradictory. Some studies use loan loss reserves, and others apply for non-performing loans and RWAs. We use the above three definitions of bank risk in this study for the robustness of the relationship. This methodology permits us to explore which types of capital definitions are most useful to drive which kind of risk measure of large commercial banks in the United States. The study starts by investigating which risk-based capital ratios are more useful for which type of bank risk measure (loan loss reserves, non-performing loans, and RWAs). Then followed the non-risk-based capital ratios connection with loan loss reserves, non-performing loans, and RWAs. The previous theoretical and empirical literature casts suspicions over the adequacy of risk-based capital ratios (Dermine, 2015). We explore whether high-quality capital, such as tier one risk-based capital ratio, is more useful to absorb losses than non-risk based capital ratios (Distinguin et al., 2013). The study also explores whether tier one common equity risk-based capital buffer ratio is more useful to absorb losses than tier one risk-based capital buffer and total-risk-based capital buffer ratios. The findings of this study have significant implications for experts and decision-makers for the development of capital guidelines for the financial system stability in the United States.
The study contributes both theoretically and methodologically in the following ways to the existing literature. In previous studies, some researchers advocated the use of RWAs as a portfolio risk proxy relative to non-performing loans (NPLs) and loan loss reserves (LLRs). The other justifies in favor of LLR and NPL against RWA. We here contribute to the existing literature by using these three risk proxies at a time to resolve the contradiction of superiority. The study used three risk measures on a fundamental information basis, includes NPL, LLR, and RWA. In the theoretical context, the study contributes to the debate of the impact of different capital definitions on a various measure of bank portfolio risk (Altunbas et al., 2007; Bitar et al., 2018; Ding & Sickles, 2018; Jacques & Nigro, 1997; Lee & Hsieh, 2013; Shrieves & Dahl, 1992) by investigating the impact of different risk-based capital ratios, non-risk-based capital ratios, and capital buffer ratios on various proxies of bank risk. The findings of this study allow regulators and governments to control which types of capital ratios are more considerable to reduce the risk of commercial banks. The outcomes obtained from the comparison of risk-based capital, non-risk-based capital, and capital buffer ratios are significant for policymakers to know whether the recommendations for holding of higher capital are useful. In the methodological context, the study contributes to the empirical literature and uses a two-step system GMM approach, which indicates that the results hold when we apply different ratios of bank capital. The rest of the study is structured as follows: The next section contains a literature review and hypotheses development. The third segment is consists of data sources and econometric techniques. The fourth section reports the results and discussion, and the final section is about the conclusion and policy implications.
Literature Review and Hypotheses Development
The question of how different bank capital ratios affect loan loss reserves, non-performing loans and RWAs is far from being settled. The financial theories document various estimations about the influence of capital ratios on bank portfolio risk-taking. In recently published studies, scholars explore the importance of capital ratios and their impact on banks’ risk-taking (Bitar et al., 2016, 2018; Brandao-Marques et al., 2020; Cohen & Scatigna, 2016; Ding & Sickles, 2018, 2019). The contradictory conclusion of the recent literature motivates to explore and fill this gap. Anginer and Demirguc-Kunt (2014) argue that the purpose behind high capital ratios is to increase their resistance against unexpected economic shocks and meet the demand for deposits withdrawals. They claim that the presence of a higher capital buffer ratio enhances the owner’s investment behavior.
Jacques and Nigro (1997) opine that increasing the capital against RWAs may reduce bank risk-taking; other factors held constant. Correspondingly, Aggarwal and Jacques (1998) explain that the holding of a higher capital ratio than regulatory capital ratios protects from distress in crisis conditions. Berger and Bouwman (2013) uncover that the presence of capital is favorable to small banks in adverse economic conditions. Tan and Floros (2013), Lee and Hsieh (2013) reveal an inverse connection between various capital ratios and bank risk-taking. Eventually, more efficient bank management may play a crucial part in adjusting depositors and owners’ benefits in decreasing agency issues. Abusharba et al. (2013) demonstrate an increase in non-performing loans leads to a decrease in the bank capital adequacy ratio. Konishi and Yasuda (2004) find that regulatory capital decreases the risk-taking of commercial banks. This argument favors the negative relationship between bank capital and risk-taking.
The corresponding set of arguments posits that banks take higher risks to maximize the owner’s wealth at the cost of depositor’s money. The deposit insurance plan motivates bank managers to engage in risky projects. The depositor’s money remains secure due to insurance guarantees. The theory of too-big-to-fail follows a similar argument in which the systemic banks involve in excessive risk-taking due to government bailout options (Kim & Santomero, 1988). These arguments favor the “regulatory hypothesis” theory, which suggests an increase in capital ratio with the increase in a risky portfolio. Koehn and Santomero (1980) conclude that the rise in capital leads to an increase in banks’ risk. Avery and Berger (1991) reveal that risk-based capital and bank risk-taking move in the same direction. J. Blum (1999) documents a positive relationship between an increase in bank capital and portfolio risk in the short run. In a specific context, Iannotta et al. (2007) provide that there is a positive relationship between loan loss provision and bank capital. In a most recent study of Bitar et al. (2018) validate a positive relationship between loan loss reserves and non-risk-based capital ratios. Altunbas et al. (2007) uncover that there is a positive connection between loan loss reserves and capital ratio. Likewise, we develop the following hypothesis:
In recent literature, various studies investigate the usefulness of risk-based and non-risk-based capital ratios. Most of those studies’ findings cast doubts on the effectiveness of risk-based capital ratios to reduce risk. J. M. Blum (2008) concludes that the own determination of banks’ risk exposure provides an incentive to express lower risk to limit regulatory capital requirement. These conditions favor involving in riskier activities. Dermine (2015) suggests that there should be a complementary risk-based capital in the real sense to avoid the problem of riskiness. Cathcart et al. (2015) report that banks with higher risk-based capital ratio than regulatory requirements are unable to survive in financial crisis. Haldane and Madouros (2012), the study provides inconclusive findings of the effectiveness of risk-based capital ratios to influence bank risk-taking. Rime (2001) concludes that the relationship between bank risk-taking and regulatory capital is not clear and conspicuous. Bitar et al. (2018) reveal that risk-based capital ratios fail to reduce portfolio risk by using the sample of Organisation for Economic Co-operation and Development (OECD) countries banks. In a specific context, they find that when RWAs measure risk, the influence of capital ratios is insignificant. In the context of the above debate, the hypothesis is:
Different researchers have examined the relationship between capital buffers and bank risk. Jokipii and Milne (2008) concluded in their study conducted in Europe that banks usually create a higher amount of buffer due to the higher cost of capital adjustment. They found an inverse relationship between the economic cycle and capital buffers for large commercial and for saving banks. They also revealed that small banks incline to increase their capital buffer during economic booms. Jokipii and Milne (2011) found that bank capital and risk have a positive and causal relationship in the U.S. banking sector. They indicated that banks usually use capital buffers amount to adjust capital and risk. This relationship signifies that banks increase their capitalization with the increase in their risk. Guidara et al. (2013) explored the relationship between bank risk and bank capital buffers using the data of commercial banks of Canada, and they found that higher capitalized banks follow the market discipline. Anginer et al. (2014) showed that higher capital provides greater power to resist earning shocks. They demonstrated that higher capital buffers provide more confidence to stockholders to make full investment choices. Examples of other studies conducted to explore the bank buffers are Ayuso et al. (2004), Fonseca & González (2010), and Valencia & Bolaños (2018).
Data and Econometric Model
In the data structure of the present study, the Federal Deposit Insurance Corporation (FDIC) institutional directory was used for extracting detailed information about the financial system necessary to analyze the data in the long-run according to the reports of FDIC call/TFR, which is updated quarterly by FDIC. The annual dataset provided for financial institutions and covered the long period of the current research study between 2002 and 2018. The sample of the present research study is balanced to comparable panel data containing insured commercial banks of the United States, as described in FDIC reports.
Furthermore, the assets are also based on a consolidated theme. There were many banks in nearly 1806 in the mentioned list on December 31, 2018, which were listed by FDIC. However, for appropriate and reliable data analysis, the inclusion of the study sample units was based on the following criteria: the listed banks should have been active on the reported date. There must not be any missing observations for any specific study variables of at least 2 years in the studied period. The total assets of banks must be higher than $300 million on the December 31, 2018. After filtration of properly used criteria, there were 942 banks selected for the study sample size.
Dependent Variable Definitions
Bank risk
In previous studies, some researchers favor the use of RWA as a portfolio risk proxy superior to NPL and LLR. The other justifies in favor of LLR and NPL against RWA. We here use these three risk proxies (see Table 1) at a time to resolve the contradiction of superiority. The study used three risk measures on a fundamental information basis, includes NPL, LLR, and RWA. The NPL is used by Ding and Sickles (2019), Jiang et al. (2020), Ozili (2019a, 2019b), Shim (2013), and Shrieves and Dahl (1992). The RWA is used by Ding and Sickles (2019), Jacques and Nigro (1997), and Shrieves and Dahl (1992). The LLR is employed by Altunbas et al. (2007), Bitar et al. (2018), and Lee and Hsieh (2013). The reason for using these three proxies is to find out the robustness of relationships in the present conditions of the United States. Besides, the purpose includes the measures and risk theories clarification and association and reexaminations.
Variables and Data Sources.

Note. TCAPR = total Capital ratio; CERBR = common equity risk-based ratio; CEBR = common equity buffer ratio; LIQ = liquidity; LG = loan growth; BE = bank efficiency; ID = income diversification; FD = funding diversity; MP = market power.
Capital ratios
Bank capital ratio is an independent variable. We use several capital ratios, including risk-based capital ratios and non-risk-based capital ratios reported in Table 1. The study also uses the capital buffer ratios for the robustness and more in-depth understanding between the relationship of different risk measures and real increase and decrease in capital ratios. The rates taken for capital are consistent with many studies (Abbas, Butt, et al., 2019; Abbas & Masood, 2020b; Bitar et al., 2018; Jacques & Nigro, 1997; Jiang et al., 2020; Jokipii & Milne, 2011).
Control variables definitions
The profitability is measure with net income to total assets similar to Lee and Hsieh (2013) and Shrieves and Dahl (1992). The higher profits required higher risk due to this assumption; there may exist a positive relationship between profitability and NPLs. The negative relationship is also not less applied. We are implying that the increase in NPL leads to a decrease in bank profits (Ozili, 2019b). The loan growth ratio and risk are related, and the proxy measure is consistent with (Abbas, Butt, et al., 2019; Abbas, Iqbal, & Aziz, 2019). We control the bank size by taking the natural logarithm of bank total assets similar to many studies (Ding & Sickles, 2018; Lee & Hsieh, 2013; Shrieves & Dahl, 1992). The size is used for economies of scale as a whole and for “too big to fail” hypothesis for banks. The liquidity always remains crucial in the banking industry to meet the demand for depositors. We followed the measurement of liquid assets to total assets like Ding and Sickles (2018) and Jiang et al. (2020). The market share role is reflected in the behavior of commercial banks for risk-taking (Jiang et al., 2020). The market share represents the market power of the banks. The cost to income ratio is used for bank efficiency control, which is consistent with Abbas, Butt, et al. (2019) and Jiang et al. (2020). There are several aspects which explore the connection of bank efficiency and proxies of risk (NPL, LLR, RWA). Efficient banks control the problem of higher NPL and riskiness. The funding diversification is relevant to risk. Here we use the proxy similar to Nguyen (2018). It indicates that higher diversification of funding may encourage to take a greater risk. The income diversification measure is consistent with Nguyen (2018). The more diversified banks have more options to earn profits which may encourage to take higher risk to increase returns.
Model Specifications
The dynamic model is applied in this study. There are several reasons for applying GMM (Generalized method of movement)., it controls the endogeneity of the lagged reliant variable in a dynamic setting. GMM controls the measurement error problem, reduces omitted bias issues, and controls the unobserved heterogeneity problem in panels. The means of the dynamic panel regression models have p lags of the dependent variable and comprise unobserved panel effects, which may be fixed or random. The correlation between unknown panel effects and the lagged value of dependent variables makes the estimators inconsistent. Arellano and Bond (1991) provide a method called the generalized method of moments as the solution to make the estimators consistent. They argue that the use of a one-step and two-step approach in large instrument matrix and robust standard errors for a one-step GMM approach are to be found severely biased. To overcome this severe biasness, Windmeijer (2005) presented a robust estimator for the two-step GMM approach, which is more efficient and is a biased-free method to calculate estimators. Later, Blundell and Bond (1998) worked on it further, and their findings have been used by various studies in the field of banking (Fiordelisi et al., 2011; Lee & Hsieh, 2013; Tan, 2016; Tran et al., 2016). we use the two-step system GMM in this study, as its more efficient than the one-step system GMM, and two-step system GMM can capture the maximum values to calculate the estimators.
System GMM Model Specifications
The basic model of the system GMM approach is the following form:

It is assumed that the above specification is a random walk equation, and the dependent variables are persistent. Accordingly, the results of difference GMM produce an inefficient and biased parameter, particularly in finite samples. The empirical literature explains that the bias and poor performance of difference GMM are due to poor instruments (Blundell & Bond, 1998). The system GMM uses one equation in levels form with the first differences as instruments, whereas the second equation is used in the first differences form with levels as instruments. The system GMM approach implicates a greater number of instruments. Still, Monte Carlo evidence recommends that where the period is limited, and the dependent variable is found to be persistent, the use of system GMM reduces the bias of a small sample. There is another feature of system GMM; if there are autocorrelation and heteroscedasticity in the data, a two-step system GMM should be applied by developing a weighting matrix using residuals from the first step. It is also argued that in limited samples, the standard errors were found to be downward biased. In this situation, researchers recommend applying the robust standard error approach developed by Windmeijer (2005), which corrects the sample bias.
Difference or system GMM to be used
The basic model equation:

What is better to apply for consistent and unbiased parameters? The rule of thumb provided by Bond et al. (2001) suggests the ordinary least squares (OLS) is to be applied first, and the least-squares dummy variables (LSDV) method is used second to find out the estimators. The panel OLS estimator ϕ should be the upper-bound estimate, whereas the fixed effects estimator is considered a lower-bound estimator. The decision is taken based on difference GMM estimates; if the estimates are close to or below the estimators of the fixed effects method, the former estimators are considered to be a downward biased due to the weak instruments, and system GMM is to be preferred as the best choice to apply instead of difference GMM. The following model is used in this study under the condition elaborated above:

Here, the Y is a dependent variable, which is bank risk (NPL, LLR, RWA) in this study
Results and Discussion
Table 2 contains the summary statistics information for dependent, independent, and control variables. The details include the number of observations, average value, and standard deviation from the mean, minimum, and maximum level of proxies. The information explores that the reported values for proxies are in line with the previous studies (Abbas & Masood, 2020a; Ding & Sickles, 2019). Table 3 reports the correlation between explanatory variables. The sign and significance are as per the economic theory and consistent with (Abbas & Masood, 2020a; Ding & Sickles, 2019). The correlations matrix confirms that there are no high correlations exits among explanatory. The low correlation also indicates that there is no problem of multicollinearity.
Descriptive Statistics.

Source. (Authors calculations using Stata Output).
Note. TA = total assets; GL = gross loans; TIRBR = Tier I risk-based ratio.
Matrix of Correlations.

Source. (Authors calculations using ‘Stata’s’ Output).
Note. LLRGL = loan loss reserves to gross loans; RBCR = risk-based capital/risk; LIQ = liquidity; LG = loan growth; ID = income diversification; BE = bank efficiency; FD = funding diversity; MP = market power.
We first analyze the impact of different capital ratios on NPL for the large commercial banks sample applying a two-step system GMM approach. A two-step system GMM approach is employed to provide consistent estimates. The Hansen test is reported for the confirmation and validation of instruments used. The Sargen test statistics are presented for the over-identification and autocorrelations check among residuals (Ding & Sickles, 2018). In the first turn, we will address the influence of total capital ratio (TCAPR) and total risk-based capital ratio (RBCR) on NPL, LLR, and RWA in Tables 4 to 6, respectively. For the effect of total risk-based capital ratio and total capital ratio on NPLs coefficients, see Table 4 Columns 1 and 4.
Impact of Capital Ratios on NPLs.
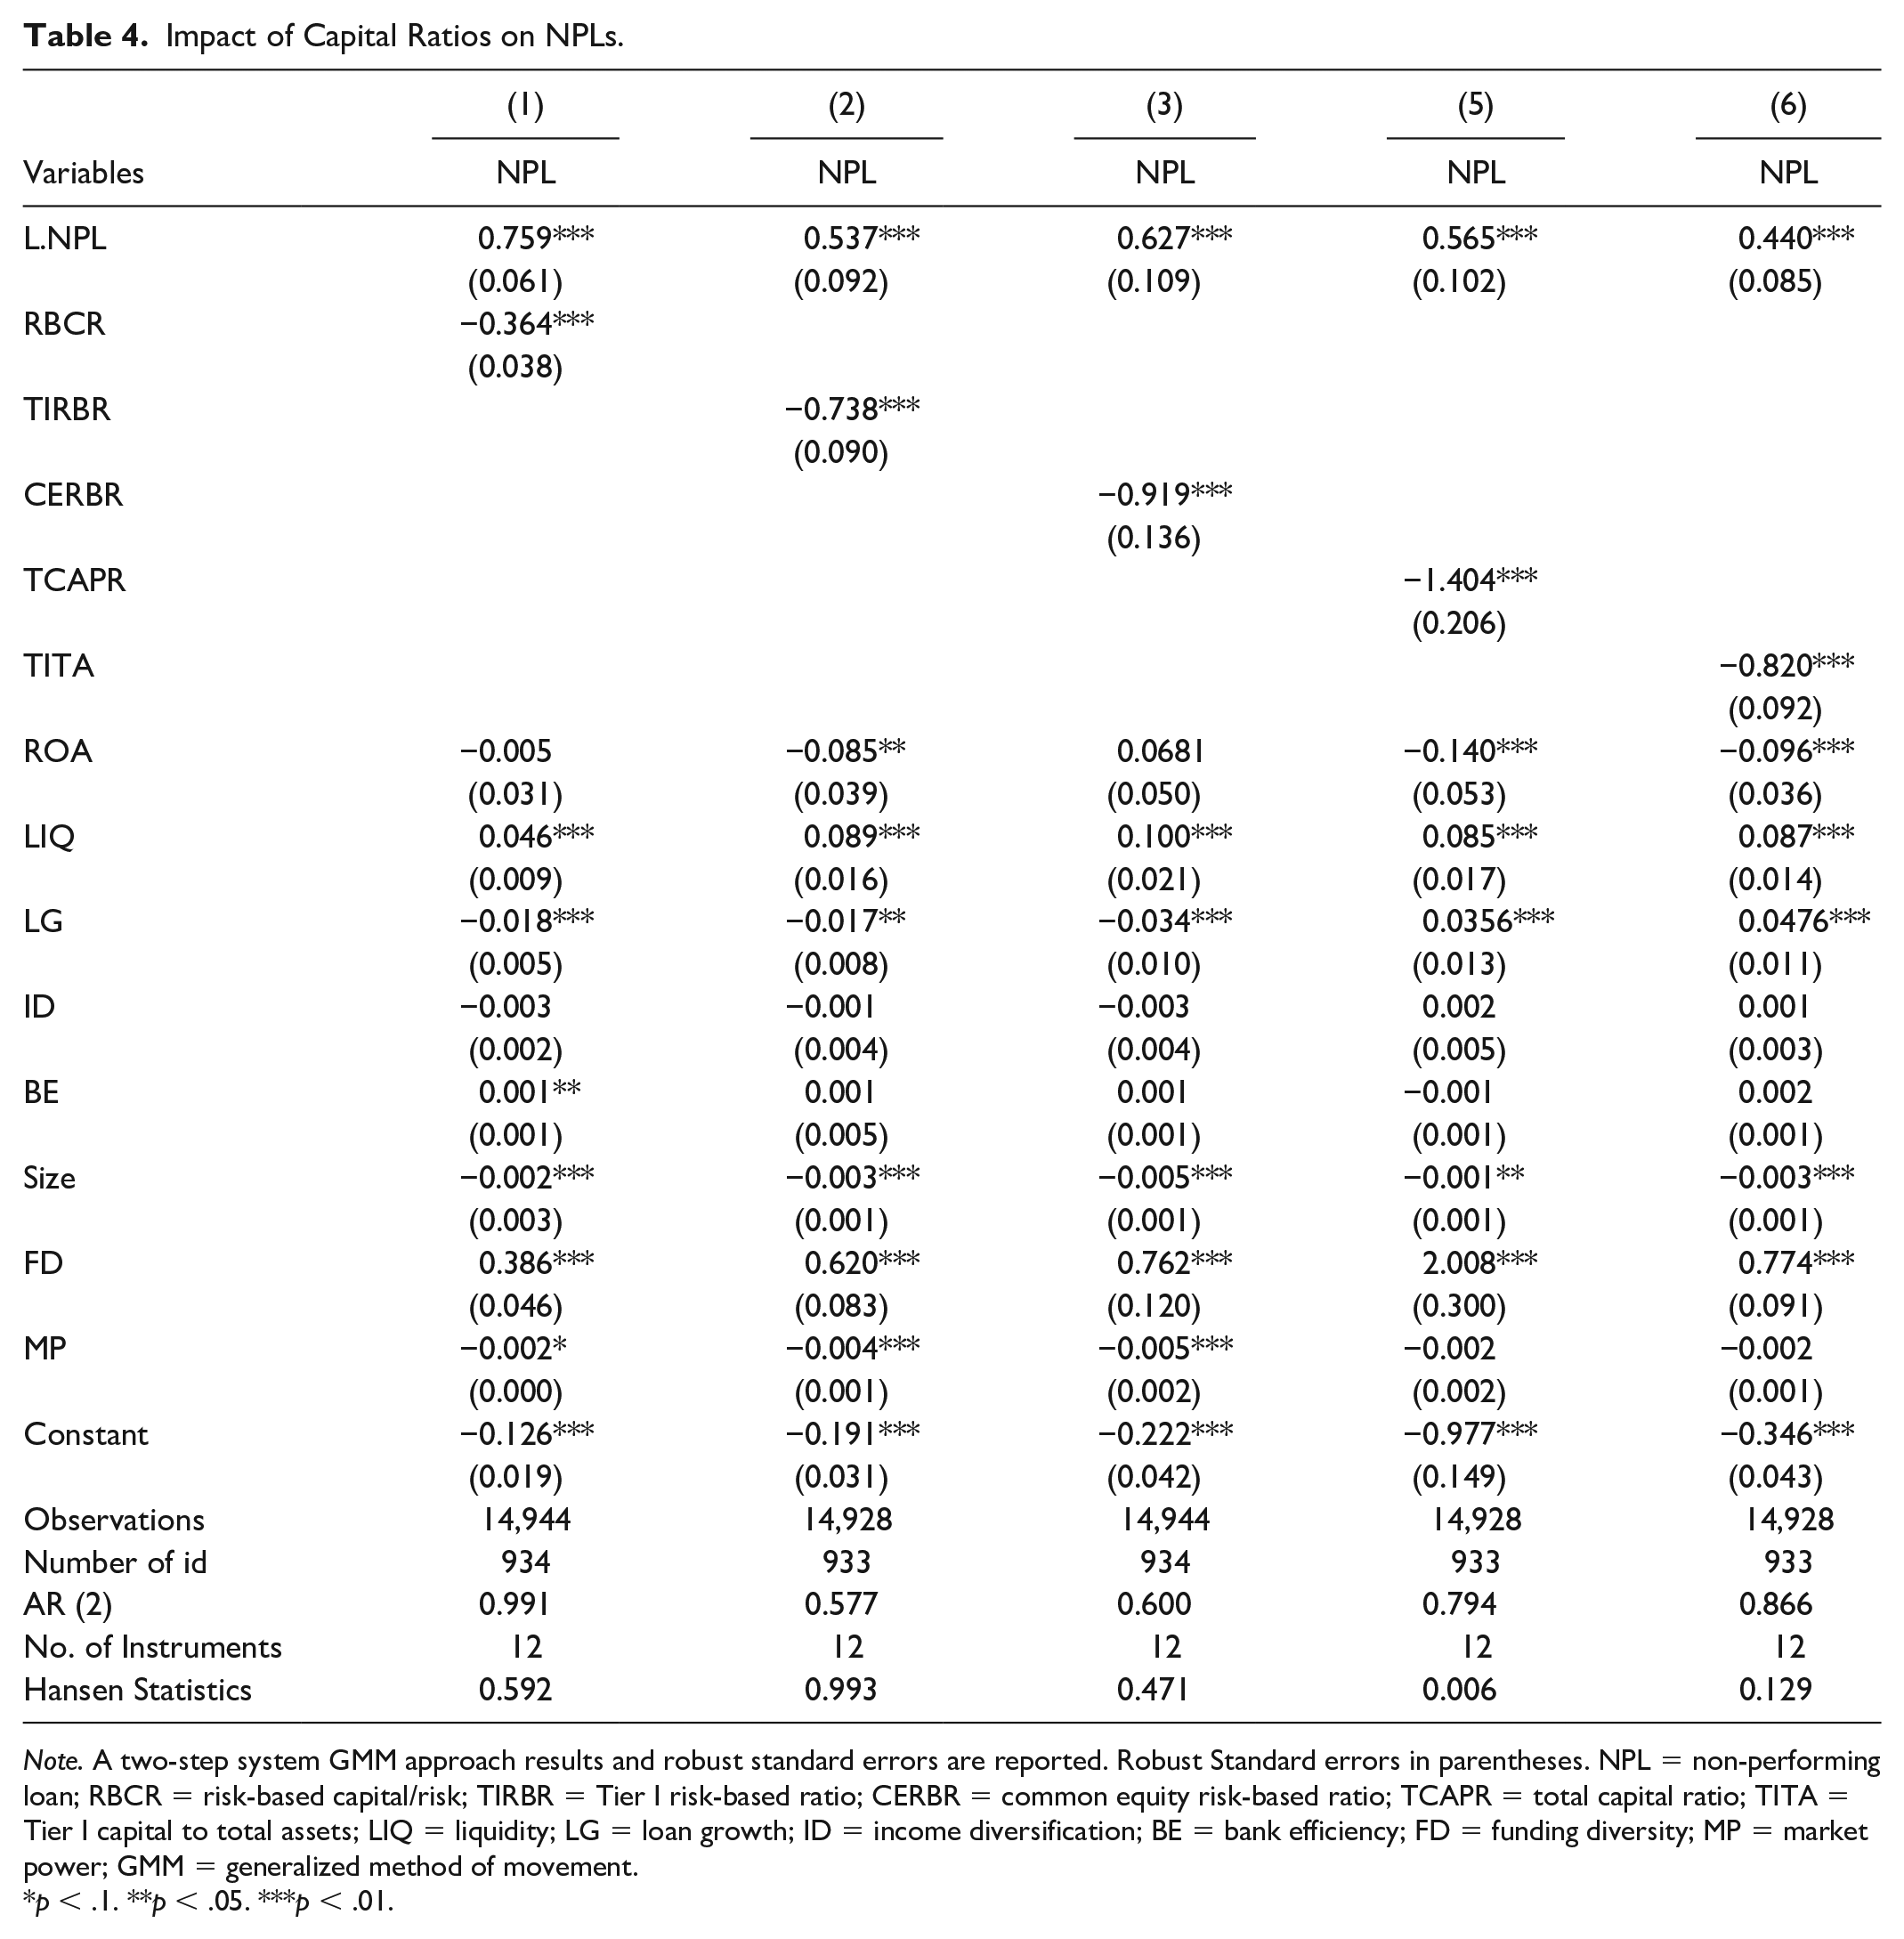
Note. A two-step system GMM approach results and robust standard errors are reported. Robust Standard errors in parentheses. NPL = non-performing loan; RBCR = risk-based capital/risk; TIRBR = Tier I risk-based ratio; CERBR = common equity risk-based ratio; TCAPR = total capital ratio; TITA = Tier I capital to total assets; LIQ = liquidity; LG = loan growth; ID = income diversification; BE = bank efficiency; FD = funding diversity; MP = market power; GMM = generalized method of movement.
p < .1. **p < .05. ***p < .01.
Impact of Capital Ratios on LLR.

Note. A two-step system GMM approach results and robust standard errors are reported. Robust standard errors in parentheses. LLR = loan loss reserve; RBCR = risk-based capital/risk; TIRBR = Tier I risk-based ratio; CERBR = common equity risk-based ratio; TCAPR = total capital ratio; TITA = Tier I capital to total assets; LIQ = liquidity; LG = loan growth; ID = income diversification; BE = bank efficiency; FD = funding diversity; MP = market power; GMM = generalized method of movement.
p < .1. **p < .05. ***p < .01.
Impact of Capital Ratios on RWA.

Note. A two-step system GMM approach results and robust standard errors are reported. Robust Standard errors in parentheses. RWA = risk-weighted asset; RBCR = risk-based capital/risk; TIRBR = Tier I risk-based ratio; CERBR = common equity risk-based ratio; TCAPR = total Capital ratio; TITA = Tier I capital to total assets; LIQ = liquidity; LG = loan growth; ID = Income diversification; BE = bank efficiency; FD = funding diversity; MP = Market power; GMM = Generalized method of movement.
p < .1. **p < .05. ***p < .01.
The empirical findings explore that there is a negative and statistically significant relationship between bank capital ratios and NPL. In the context of risk theory, higher NPLs show higher risk, an antagonistic relationship with capital ratios are similar to the argument of Bitar et al. (2018) and Jacques and Nigro (1997). The negative relationship between capital ratios and NPL is contradicting the findings of Shrieves and Dahl (1992) but consistent with (Jiang et al., 2020). There are several justifications for the disagreement between the present study results and Shrieves and Dahl (1992) study. First, there were different economic conditions in the 1990s, and now the economic conditions entirely change. The second reason for the difference is the present strict regulations and monitoring of commercial banks compared to the 1990s. The negative relationship supports the regulations for capital. The higher regulatory capital experience fewer NPLs were consistent with the argument of Ozili (2019a). One of the justifications for the negative association between NPL and capital ratios indicates that banks with lower capital take higher risk, which upsurges the chances of NPL consistent with Klein (2013). The banks having a higher capital ratio reports lower NPL, as argued by Boudriga et al. (2009). The empirical findings of the present study are supporting the moral hazard hypothesis theory. The moral hazard theory suggests an inverse relationship between capital and portfolio risk. The negative sign between NPL and capital ratios indicates that banks hold lower capital when NPL is augmented, similar to the argument of Altunbas et al. (2007) and Ding and Sickles (2018). There is an inverse relationship between bank profitability and bank NPLs. The simple theory is that NPL generates lower income for lending firms due to that the profit remain lowers. The lower profits due to the charge-off NPL may decrease bank capital ratios, as argued by Ozili (2019b). The findings conclude that the availability of higher liquidity increases the ratio of NPL. The role of loan growth is decisive; the findings of NPL is consistent with the results of Ozili (2019b). The increase in bank size causes a decrease in the NPL. The one possible justification of bank size and NPL is that larger banks tend to take a higher risk, as argued by Ding and Sickles (2018). Funding diversity and NPL are positively connected. The market share and NPL are negatively related.
For the effect of total risk-based capital ratio and total capital ratio on LLR coefficients, see Table 5 Columns 1 and 4, respectively. There is a negative relationship between capital ratios and LLR. The negative relationship between risk-taking and capital ratios are in line with the conclusions of many studies (Altunbas et al., 2007; Bitar et al., 2018; Jacques & Nigro, 1997). The one possible justification for an inverse relationship between capital ratios and LLR, indicating an aggressive reserve policy based on moral hazard hypothesis theory, and these results are contrary to the findings of Altunbas et al. (2007). One more channel for this connection may be due to an increase in LLR; the profitability of the bank decreases, which may cause to reduce the capital ratios. The general debate provides that higher LLR indicates the higher expected risk in a portfolio. In this regard, an inverse relationship is supported by Aggarwal and Jacques (1998) and Jacques and Nigro (1997). In the specific context, higher regulatory capital experience less LLR, consistent with the argument of Ozili (2019a). One of the reasons for a negative relationship between LLR and capital ratios indicates that banks with lower capital take higher risk, which upsurges the chances of LLR consistent with Klein (2013). The banks having a higher capital ratio reports lower LLR, as argued by Boudriga et al. (2009). The negative relationship is consistent with moral hazard theory and supported by many studies (Aggarwal & Jacques, 1998; Altunbas et al., 2007; Jacques & Nigro, 1997).
The results indicate that an increase in LLR pushes banks’ profitability downward (other things held equal). The increase in liquid assets increases the loan growth, which leads to moving LLR of banks upward. Income diversity provides excessive profits than lending due to that the demand for LLR decreased. The improvement in bank efficiency decreases the proportion of LLR. The funding diversity and LLR have a negative relationship. The market share has a positive impact on LLR. For the effect of total risk-based capital ratio and total capital ratio on RWA, coefficients see Table 6 Columns 1 and 4. The results show that bank capital ratios and RWA are positively associated. The relationship is weak and in line with the recent developments of (Bitar et al., 2018). One more crucial explanation is not less compelling between RWA and capital ratios. The more complicated regulations for bank capital ratios permit to manipulate their risky portfolio for the adjustment of required capital. Due to this reason, the bank’s actual risk exposure does not expose in line with the studies of Cathcart et al. (2015) and Dermine (2015). The positive relationship is favoring the regulatory hypothesis theory. The results show that profitability, loan growth, income diversity, and market share push forward to increase the RWA. Liquidity and RWAs have a negative relationship.
Robustness
In this part, we discuss the impact of tier-one risk-based capital ratio, common equity risk-based capital ratio, tier one capital ratio on NPL, LLR, and RWA. In the first turn, we use to test the impact of the tier-I risk-based capital ratio on NPL. The relationship between the tier-I risk-based capital ratio and NPL is negative. In absolute terms, the coefficient is more substantial concerning the total risk-based capital ratio. The impact of tier one risk-based common equity ratio is more significant than the tier one risk-based capital ratio. The findings provide economic sense to understand this connection. It means higher the quality of capital and lowers the NPLs. For the robustness of the non-risk-based capital ratio, we use tier one capital ratio, and results are consistent concerning sign and significance. The similar capital ratios are used to test the robustness of LLR and RWA. The findings remain consistent and confirm that LLR is favoring the moral hazard hypothesis, and RWA supports the regulatory hypothesis theory. The study further uses the capital buffer ratios for a deeper understanding of the relationship. Table 7 shows the results of the impact of total capital buffer ratio, tier one risk-based capital buffer ratio, and common equity buffer ratio on RWA and LLR. The results confirm that RWA and capital buffer ratios are positively associated, whereas the relationship is negative in the case of LLR. The findings explore for robustness checks are also in line with the previous studies like (Abbas et al., 2020; Aggarwal & Jacques, 1998; Altunbas et al., 2007; Bitar et al., 2018; Ding & Sickles, 2018; Jacques & Nigro, 1997; Jokipii & Milne, 2011; Lee & Hsieh, 2013; Rime, 2001; Shrieves & Dahl, 1992).
Impact of Capital Buffer Ratios on Risk-Weighted Assets & Loan Loss Reserves.
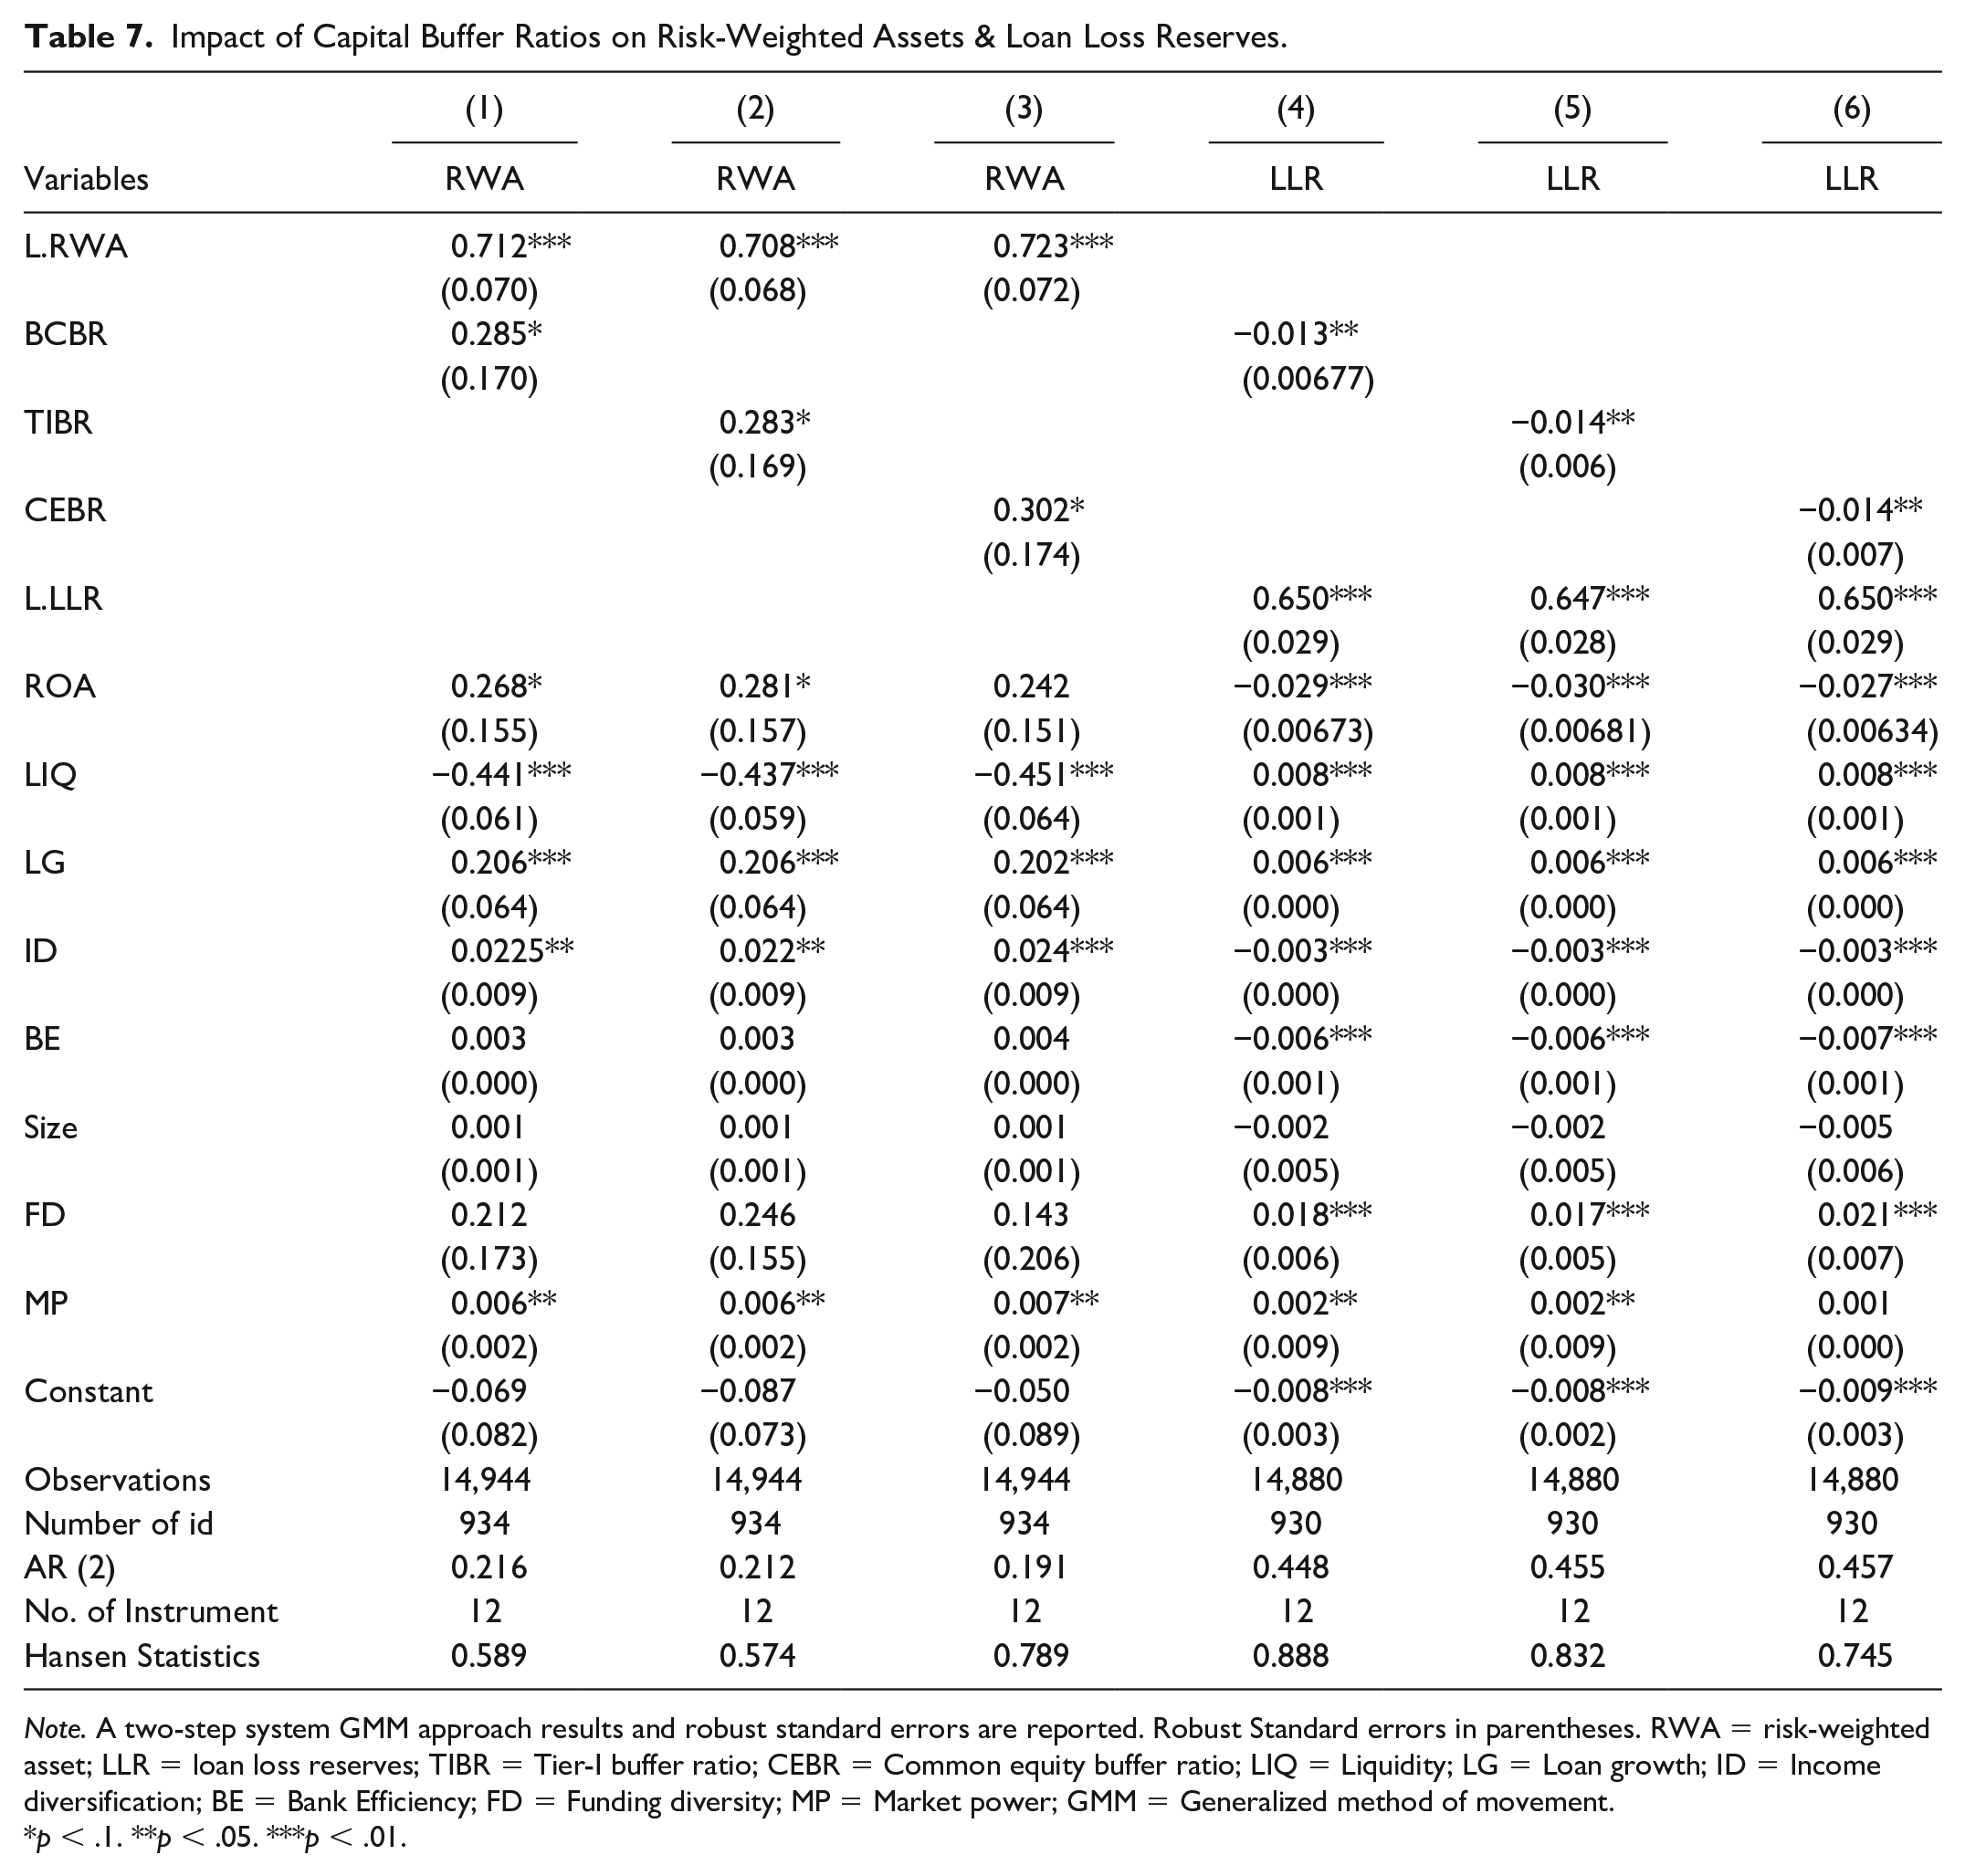
Note. A two-step system GMM approach results and robust standard errors are reported. Robust Standard errors in parentheses. RWA = risk-weighted asset; LLR = loan loss reserves; TIBR = Tier-I buffer ratio; CEBR = Common equity buffer ratio; LIQ = Liquidity; LG = Loan growth; ID = Income diversification; BE = Bank Efficiency; FD = Funding diversity; MP = Market power; GMM = Generalized method of movement.
p < .1. **p < .05. ***p < .01.
Conclusion
In the present research, we explain the effect of capital ratios on bank risk-taking of large insured commercial banks in the USA, covering the extensive period ranging from 2002 to 2018. Our results indicate that the risk proxies LLR and NPL are following the moral hazard hypothesis, and RWA is consistent with regulatory theory. The study concludes an inverse relationship between LLR, NPL, and bank capital ratios. On the other, the hand RWA and capital ratio are positively connected. The findings are robust when using capital buffer ratios to explain the connection with LLR, NPL, and RWA. The outcomes have significant importance for regulators and policymakers. These results cast doubts to rely on one of the proxies as a risk measure. The risk-weighting approach carries similar in Basel III, which may provide conspiracy to manipulate the portfolio for the adjustment of regulatory capital ratios. The results suggest that regulators must include LLR and NPL in their consideration for formulating new regulations for risk mitigation. The sole reliance on required capital ratios base on RWA is not enough to control risk-taking. In general, the development of capital buffer ratios and risk-based capital ratios are right but not enough to control the risk-taking of commercial banks. There is a need to revise the risk-weighted criteria and use NPL and LLR as a supplement for the mitigation of risk-taking in commercial banks for the future.
Footnotes
Declaration of Conflicting Interests
The author(s) declared no potential conflicts of interest with respect to the research, authorship, and/or publication of this article.
Funding
The author(s) received no financial support for the research, authorship, and/or publication of this article.