
Abstract
Today, the world is witnessing an enormous new economic wave, which has become an important and growing contributor to economic development. However, few studies compare the overall development of all new economic sectors in different cities or countries. Therefore, the purpose of this study is to contribute to the literature on the 21st century new economy in China, which is viewed as a crucial development direction. Accordingly, the new economic situation in 2018 in 15 major cities of China is evaluated by constructing an index system and adopting some new big-data technologies, whereby a new economy comprehensive index (NECI) for each city is obtained. This study finds that the cities ranked from high to low in the NECI are Beijing, Shanghai, Shenzhen, Guangzhou, Hangzhou, Wuhan, Chengdu, Nanjing, Chongqing, Suzhou, Zhengzhou, Wuxi, Tianjin, Qingdao, and Xi’an. Among them, Beijing, Shanghai, and Shenzhen belong to the first hierarchy. The findings provide a nuanced perspective on the intercity comparison of the new economy, and the index system presented in the study is urgently-needed for policy makers. Finally, based on the case study of Chengdu the study offers rich insights to city administrators in terms of how to promote the new economy.
Introduction
Most people think that a new economy is described by new, high-tech, and high-growth industries—particularly the increasingly powerful internet and chips (Gordon, 2000; Nordhaus, 2001; Swan, 2015). Today, the world is witnessing a new enormous technological wave, typified by big data, biomedicine, new energy, block chain, and artificial intelligence, which have promoted the new economy of the 21st century (Fernald & Jones, 2014). In this study, the development of the new economy is compared between major Chinese cities. The comparison is significant for cities to make clear their own shortcomings in the new economy and formulate relevant initiatives, strategies, and policies.
Up to now there is no clear definition for the new economy, but many economists argued that “information technology, the internet, ultra-high-tech companies and globalization had created a completely new type of economy” (Hall, 2007), which is called the new economy in this study. Specifically, this study defines the new economy by the following four characteristics: First, the typical characteristics of the new economy are high human capital and technology inputs, but relatively few assets (especially fixed assets). Second, the new economy can be characterized by aggregation and sharing, cross-border integration, rapid iteration, and high-speed growth, and it is an important driving force for current world economic growth. Third, the new economy often relies on information technology such as big data and cloud computing, and is closely related to innovation and entrepreneurship (I&E) activities. Fourth, the new economy can be summarized as five new—driven by new technologies, supported by new industries, serviced by new organizations, promoted by new types of operation, and advanced by new business models.
In 2015, the Chinese government defined the key fields of the new economy as the new generation information technology industry, high-end computer numeric control (CNC) machine tools and robots, aerospace equipment, marine engineering equipment and high-tech ships, advanced rail transit equipment, energy-saving and new energy vehicles, electric power equipment, agricultural machinery equipment, new materials, biomedicine and high-performance medical equipment, and the corresponding producer services. In 2018, the National Bureau of Statistics formulated the Statistical Classification of New Industries, New Operation Types, and New Business Models. This classification divides new economy industries into the following nine categories: modern agriculture, advanced manufacturing, new energy activities, energy conservation and environmental protection activities, internet and modern information technology services, modern technology services and I&E services, modern producer services, new life services, and modern integrated management activities. This study also considers these fields as more appropriate and more general for the new economy than the definition proposed by Nordhaus (2001) and Gordon (2000), who considered only machinery, electric equipment, telephones and telegraphs, chips, and software.
Although Van Ark (2016) claimed that “the new economy is still in its initiation phase,” a large body of literature focuses on new economy-type fields. Among them, Einav and Levin (2014), George et al. (2014), and Varian (2014) researched the application of big data in economics and management; Deng and Tian (2020) researched the development and governance of China’s new energy vehicle industry; Adjei et al. (2010), Merrilees et al. (2011), Li and Penard (2014), and Chiu et al. (2014) researched new business models such as B2B, B2C, and C2C; and Carrick (2016) and Böhme et al. (2015) focused on bitcoin and blockchain. In addition, there are also scholars who quantitatively researched some new economy problems. For example, Bostrom and Yudkowsky (2014), Parkes and Wellman (2015), Russell et al. (2015), and Acemoglu and Restrepo (2017, 2018) researched a few possible artificial intelligence considerations.
However, few articles compare the overall development of all new economy sectors in different cities or countries. The only new economy index (NEI) in China, which is published by the Mastercard Caixin BBD firm, evaluates the development of the new economy from the one-sided perspective of labor, capital, and technology inputs. Hence, this study aims to construct a new and more comprehensive index of 46 indicators, namely, the new economy comprehensive index (NECI), to evaluate the development of the new economy in Chinese cities, rather than researches any specific new economy fields.
In 2019, almost all the major cities in China actively applied to be a national digital city. In future, more new economy resources, especially the preferential policies from the central government, will be allocated among the cities. Meanwhile, the cities are competing fiercely to attract high-quality new economy enterprises and talents. Therefore, it is of great practical significance for the local governments to make clear the current situation of the new economy development in various cities and their own shortcomings. In a word, based on the existing literature and Chinese situation, on the one hand, this study aims to contribute to the new economy literature in terms of evaluation system construction; on the other hand, we hope this study could help the development of new economy industries in China and other similar countries. These two motivate this analysis.
The study makes two contributions: first, it constructs a new economy evaluation index system and the corresponding NECI, which is urgently needed by urban policy makers; second, it uses this index system to evaluate the new economy status in 15 major Chinese cities in 2018. According to the evaluation, the cities are ranked from high to low by NECI as follows: Beijing, Shanghai, Shenzhen, Guangzhou, Hangzhou, Wuhan, Chengdu, Nanjing, Chongqing, Suzhou, Zhengzhou, Wuxi, Tianjin, Qingdao, and Xi’an.
The remainder of this paper is structured as follows. In the second section, a research framework is proposed, and an index system is constructed based on the framework. In the third section, the index system is evaluated using Chinese city-level data, and is applied in a case study of Chengdu. The final section concludes and outlines policy recommendations.
Research Framework
The Sample Cities
When building an index system to compare the new economy development in city level, we need to ensure the sample cities are comparable. Each city has its own comparative advantage in different sectors (which may not be related to “new economy”); therefore, it is unjust using all the prefecture-level cities as samples. Considering data availability and comparability, two kinds of cities could be used as research samples. The first category is the central cities of the country. In February 2010, the Outline of National Urban System Planning (2010–2020), issued by the Ministry of Housing and Urban-Rural Construction, put forward the planning and positioning of five national central cities, including Beijing, Tianjin, Shanghai, Guangzhou, and Chongqing. After that, from May 2016 to February 2018, the National Development and Reform Commission and the Ministry of Housing and Urban-Rural Construction further supported the construction of national central cities in Chengdu, Wuhan, Zhengzhou, and Xi’an. Therefore, there are to date nine national central cities in this category, including Beijing, Tianjin, Shanghai, Guangzhou, Chongqing, Chengdu, Wuhan, Zhengzhou, and Xi’an.
The second category is trillion-yuan-club cities, that is, cities with a gross regional product (GRP) that exceeds one trillion yuan. According to the 2017 data, the trillion-yuan-club cities include Shanghai, Beijing, Shenzhen, Guangzhou, Chongqing, Tianjin, Suzhou, Chengdu, Wuhan, Hangzhou, Nanjing, Qingdao, Wuxi, and Changsha.
This study used the national central cities and trillion-yuan-club cities as research samples. After excluding Changsha because of a lack of data, Beijing, Shanghai, Shenzhen, Guangzhou, Chongqing, Tianjin, Suzhou, Chengdu, Wuhan, Hangzhou, Nanjing, Qingdao, Wuxi, Zhengzhou, and Xi’an remain (15 cities in total). We consider these 15 cities as comparable: On the one hand, these 15 cities have strong motivation to develop their new economy; on the other hand, it is the first choice for these cities to develop the new economy given China’s situation that per capita land and other natural resources are relatively scarce (C. Ding & Lichtenberg, 2011).
Table 1 shows the GRP and resident population of the 15 cities in 2018. It indicates that the GRPs of the cities, except Xi’an, were more than trillion yuan in 2018, and that those of Beijing and Shanghai were more than 3 trillion yuan. Eleven cities—except Wuxi, Nanjing, Qingdao, and Hangzhou—have more than 10 million people; Chongqing has the largest resident population (up to 31.12 million), which is mainly the result of multiple administrative regionalization reforms. According to the regional economic indicators in Table 1, excluding the absolute advantages of Beijing and Shanghai in terms of economic volume, the selected sample cities in this study have a certain degree of horizontal comparability.
Main Indicators of the Sample Cities in 2018.

Data source: statistical bulletin of 2018 of each city. Units of measure: gross domestic product (GDP): billion yuan; GDP growth rate: %; resident population: million people; GDP per capita: thousand yuan; per capita disposable income of urban residents (PCDI): thousand yuan; value-added in services: billion yuan; proportion of services: %; and growth rate of services: %.
The Analytical Framework
This study compares the new economy development from four perspectives: development performance, development environment, development efficiency, and development potential. The relationship between them is illustrated in Figure 1. Positive interaction between development environment, potential, efficiency, and performance can promote a rapid, efficient, and sustainable development of local new economy. On the contrary, if there are shortcomings in any one of the four aspects, it would be difficult for the new economy to achieve a high-quality development.
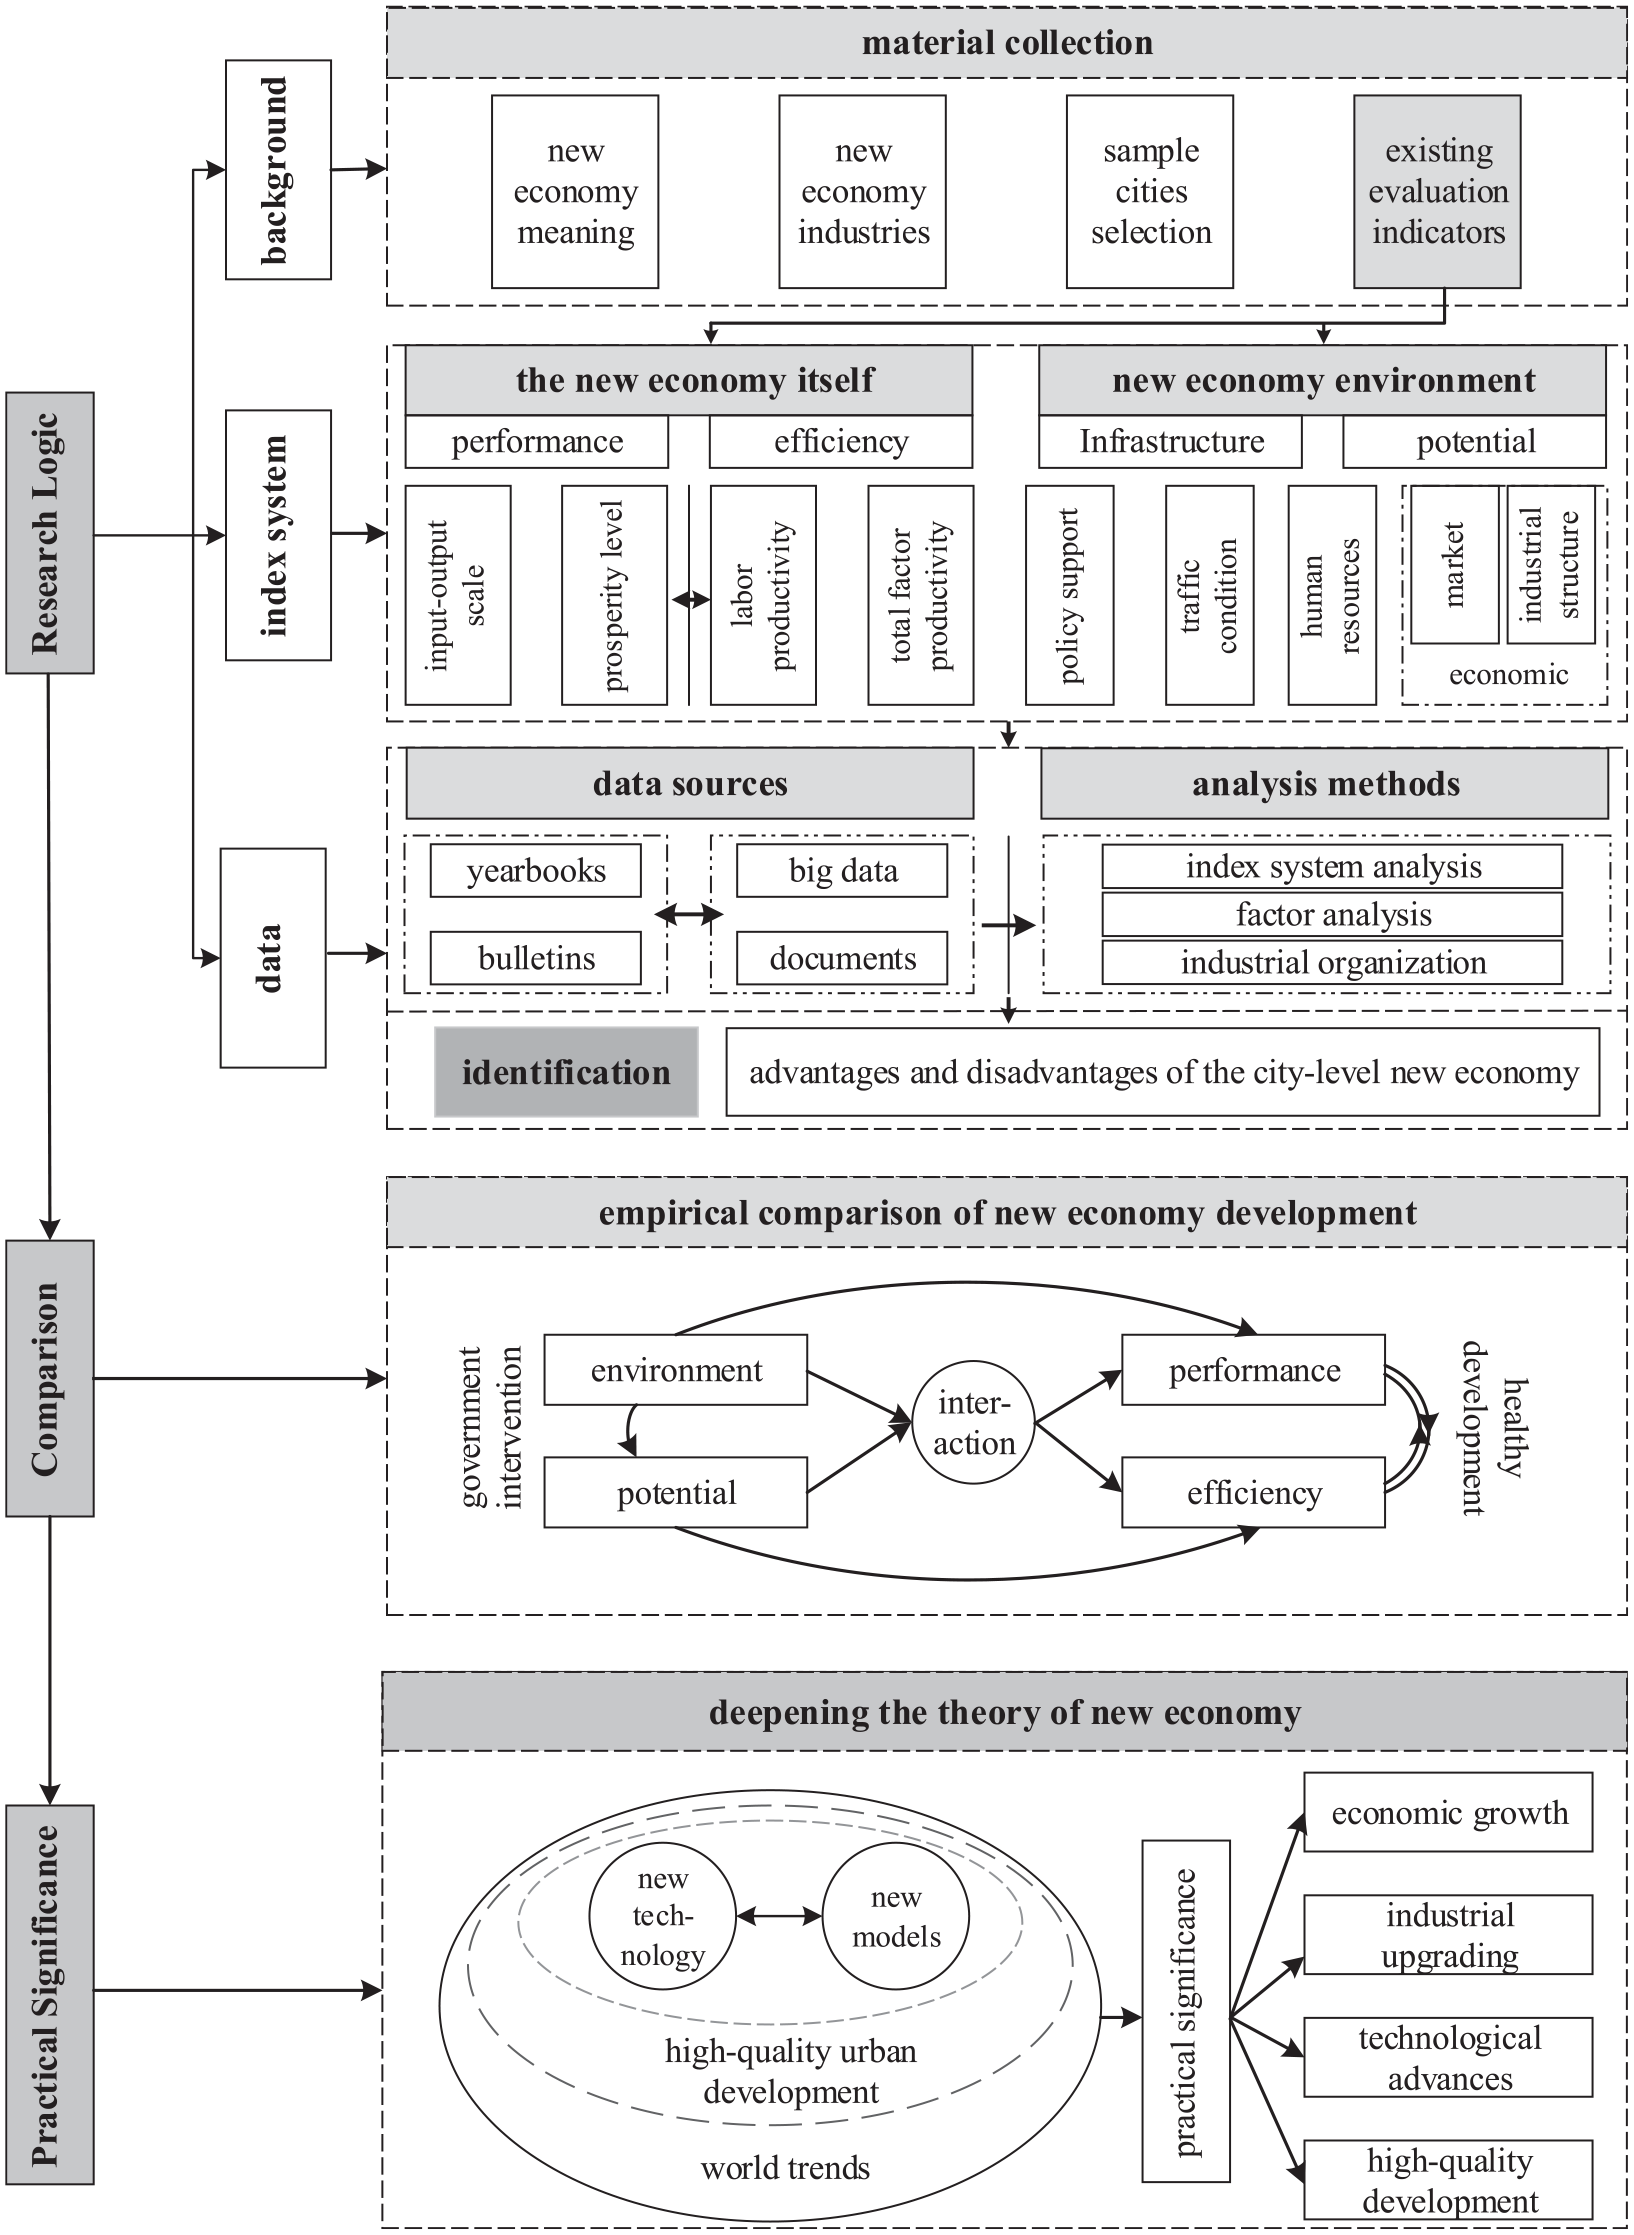
The research framework.
In order to carry out these comparisons, the existing literature, research results, and business reports on the new economy were reviewed and summarized, after which a research framework was proposed (see Figure 1).
The new economy trend of the world forces high-quality city development; this urgently needs a benign interaction between new technologies and new business models. During this process, the major Chinese cities need to find their policy directions and industrial positioning, which are discussed in this study by intercity comparison. As shown in Figure 1, the authors mainly used index system analysis, factor analysis, and industrial organization methods based on the available data from yearbooks, bulletins, policy documents, and big data retrieval.
The Index System
As shown in Table 2, our index system includes 4 primary indicators, 14 secondary indicators, and 46 tertiary indicators.
The Index System of New Economy Development.

Note. Indicator weights are in parentheses. GRP = gross regional product; TFP = total factor productivity.
The bold values are weights, not estimated values.
The indicator weights are indicated in parentheses. We referred to some existing evaluation systems to determine the weights of most indicators, including the Digital Economy Statistics Index of the Organisation for Economic Co-operation and Development (OECD), New Economy Statistical Information System of the European Union, State New Economy Index of the United States, Global Innovation Index of the United Kingdom, National Innovation Index of the Ministry of Science and Technology of China, Innovation Index of the National Bureau of Statistics of China, Zhongguancun Index, and New Economy Index of the Mastercard Caixin BBD firm. For the weights of the remaining indicators, we adopted an expert-evaluation method to determine. The experts were mainly government officials of Chengdu’s new economy administrative departments, including the Municipal Development and Reform Commission and New Economic Development Commission. In November 2018, Chengdu New Economic Development Commission held an important conference to discuss the development of the new economy. After the conference, we invited nine experts to give corresponding importance ratings of the indicators with grade set from 0 to10. The indicators are elaborated in sections 2.3.1 to 2.3.4.
Development performance
Because the new economy mostly comprises small- and medium-sized enterprises, there are no relevant statistical data in China at present, and it is not easy to obtain data on the gross output value or added value of these enterprises. Therefore, big data technology was used to obtain data on the number of new economy enterprises, employment, wage level, and others from recruitment websites. This is a relatively accurate micro-data measurement method for new economy development under the current conditions. In addition, the data of the tertiary industry were supplemented by the existing official statistical data (mainly using the statistical yearbooks and periodic statistical bulletins of the cities). Specifically, the performance of new economy development is identified by three secondary indicators: output scale, input scale, and prosperity degree of the new economy.
The output scale mainly measures the outputs of new economy enterprises (including the number of new economy enterprises, the number of new economy listed enterprises, and the number of unicorn enterprises—privately held startup company valued at over $1 billion). At the same time, considering the high proportion of new economy industries contributing to service industry growth, the growth rate of the tertiary industry’s added value was also incorporated in the evaluation system.
The input scale mainly measures the inputs of new economy enterprises, including labor, capital, and technology inputs. Labor input is measured by the total number of recruits in new economy enterprises, capital input is measured by the total amount of financing of new economy enterprises, and technology input is measured by the number of national projects obtained by scientific and technical personnel in the cities in 2018. Among them, capital input is very important to reflect industrial trends and prospects (Cumming & Zhang, 2016). In recent years, the growth of new economic investment such as venture capital (VC), angel investment, and private equity (PE) in Chinese markets is very obvious. Technology input is very important to reflect innovation, which is a source of firm-specific advantages (He et al., 2019).
The prosperity degree reflects the boom of the local new economy industries. A high prosperity degree shows a lot of promise of a rapid boom and usually is an important signal of sunrise industries. In this study, the prosperity degree is evaluated by four indicators: the average wage premium of new economy workers (measured by dividing the average wage of the new economy workers by the per capita disposable income of urban residents), the degree of favor of labor in the new economy sectors (measured by dividing the number of candidates by the number of recruits), the number of new economy words that appear on the network, and the degree of specialization of new economy industries (measured by the location entropy). Among them, average wage premium and the degree of favor of labor reflect labor market prosperity, the number of new economy words that appear on the network reflects the degree of social preference for the new economy, and location entropy reflects the specialization of the local new economy.
Based on a large number of existing studies, the location entropy index of industry

where
Development environment
This primary indicator includes five secondary indicators: traffic facilities, policy support, industrial foundation, market environment, and geographical and demographic environment. Traffic facilities are a prerequisite for the development of industries, especially new economy industries (Duranton & Turner, 2012). In this study, the traffic facilities were measured by three indicators: intra-city traffic, inter-city traffic, and air passenger transport. The intra-city traffic data came from the 2018 report on the Traffic Situation in China’s Major Cities, which is jointly published by Gaode Map and Chinese Academy of Social Sciences; utilizing the factor analysis method, a common factor is proposed from the peak travel delay index and peak average speed (km/h) to measure the degree of urban traffic congestion. The inter-city traffic data were crawled from the 12306 website (https://www.12306.cn/index/) to calculate the traveling time between cities by high-speed rail, allowing one station interchange. The convenience degree of air passenger transport is based on the throughput of each airport. If cities have multiple airports (such as Beijing and Shanghai), the index is calculated by the total throughput. However, Suzhou and Wuxi represent special cases. Besides their proximity to Shuofang International Airport, the two cities are very close to Pudong International Airport. Therefore, half of the throughput of Pudong International Airport is allocated to Suzhou and Wuxi in this study.
Policy support is an important driving force of the new economy and I&E activities, especially within the context that most cities have introduced numerous preferential policies. The relative attractiveness of policies is an important aspect for local new economy development (Phonthanukitithaworn et al., 2019). This study evaluates policy support by three indicators: the strength of local government’s support to the new economy, the institutional construction situation of the management organization of the new economy, and the proportion of science and technology expenditure in public finance.
Industrial development is the objective basis of the new economy’s construction. First, from the Hoffman ratio of industrial evolution, the increase in the added value proportion of the tertiary industry reflects industrial structure improvement. Thus, we use the proportion of added value of tertiary industry as an industrial foundation indicator. Second, the larger the industrial volume, the easier it is for cities to support the supply and demand of the new economy. Thus, we also use gross industrial output of enterprises above scale as an industrial foundation. Finally, infrastructure construction is important for new economy. Because traffic infrastructure has been included above, we compare it mainly from the perspective of the logistics industry, which is crucial for the new economy (Farooq et al., 2019). That is, by extracting a common factor from two indicators associated with the degree of development of the logistics industry (the proportion of added value of the logistics industry to GDP, and the total volume of goods transported).
About the market environment, five conventional indicators are selected, where the degree of financing constraints (negative indicator) is estimated as follows.
Assume that the investment function of firm

where
According to location theory, the new economy relies little on natural resources, but pays more attention to the demand-side market environment and the industrial environment. Therefore, the urbanization rate is an important factor when analyzing the new economy development environment. Higher urbanization rates are associated with more concentrated urban populations, where it is the easier to create the environment to foster the new economy. In addition, traditional economic theory considers the degree of freedom of trade and financial development as playing important roles in influencing the urban economy (Sehrawat & Giri, 2016). While the concept of trade freedom has been weakened through the rapid development of economic globalization, this study still takes it into account (but with less weight). About the estimation of trade freedom, we adopt the method developed by Redding and Venables (2004), Head and Mayer (2006), and Au and Henderson (2006).
Development efficiency
Development efficiency includes two secondary indicators: input-output efficiencies and efficiency changes. Efficiency and productivity analysis is an indispensable part of economic analysis; hence, the efficiency of the new economy sectors, which makes a significant contribution to economy-wide productivity (Nordhaus, 2001), should be considered in the index system. Regardless of the size of the new economy, if high-efficiency development cannot be achieved, new economy development is extensive.
This study compares input-output efficiency from two perspectives: labor productivity and total factor productivity (TFP). Labor productivity mainly measures the ability of labor to create output, while TFP measures the ability of all input factors to create output. Due to the lack of micro data, this study can use only the data of the listed new economy enterprises to calculate efficiencies.
TFP measures the input-output efficiency of enterprises, industries, or regions. It is considered as a good measure of technological level (Buera et al., 2011; Deng et al., 2019). At present, there are three kinds of methods to measure TFP: parametric, non-parametric, and semi-parametric methods. Considering robustness, convergence, and accuracy, this study uses the directional distance function of slack-based measure (SBM)—a non-parametric method—to measure TFP; see Deng et al. (2019) for details.
This study involves three levels of TFP, namely, the TFP of new economy enterprises, the TFP of the whole new economy, and the TFP of each city. When calculating firm-level TFP, the operating income is chosen as output variable, and the operating cost, net fixed assets value, and number of employees are selected as input variables. In addition, this study also considers the TFP of the whole new economy, that is, it uses the total score of output scale in the index system as output variable and the total score of input scale as input variable, where after the TFP of the whole new economy is measured by the ratio of the two.
When measuring efficiency changes, we consider not only the changes over time but also the changes in various cities (namely misallocation). According to the studies of Hsieh and Klenow (2009) and Asker et al. (2018), misallocation of resources can be measured by the dispersion coefficient of TFP.

where the subscripts
Development potential
This primary indicator includes four secondary indicators: human resource reserve, market potential, strategic planning, and urban competitiveness.
Human resources are key to the success and sustainable growth of I&E and the new economy. The reserve of human resources directly restricts the development potential of the new economy. This study evaluates the urban human resources reserve by three conventional and widely used indicators: the number of regular colleges and universities, the number of students in regular colleges and universities, and the number of full-time teachers in regular colleges and universities.
New economy development cannot be achieved without a good business environment. The bigger the market potential, the better the new economy development tends to be in the future. This study evaluates the market potential of the new economy in terms of three indicators: GRP, stable economic growth expectation (measured by the fluctuation of economic growth), and fixed investment in real estate. The regional gross product measures market size, stable economic growth expectation measures market stability, and fixed investment in real estate measures market prospects.
Whether the government’s strategic planning for the new economy is appropriate or not is an important factor that determines whether or not the new economy can achieve rapid and sustainable development. This study evaluates the strategic planning of the government from three perspectives: whether the planning is scientific, effective, reasonable, and operable; the construction situation of the new economy supervision department; and the number of keywords about the new economy mentioned in each city’s Report on Government Work. The first two items are subjectively evaluated by consulting relevant policies and government portals, and the last item is directly retrieved from the Report on Government Work with the search keywords including new economy, new business models, new format, big data, internet of things, internet, artificial intelligence, biomedicine, new energy, 5G, UAV, equipment manufacturing, e-commerce, software, chip, ecological agriculture, and others. The Report on Government Work directly reflects the work situation of the local government in the past year and the work arrangement in the next year. Therefore, if the number of words related to the new economy mentioned in the report is more, the local government will pay more attention to the development of the new economy, and enterprises will change their strategic behaviors in response to governmental orientation (Y. Ding et al., 2016; Phonthanukitithaworn et al., 2019).
Urban competitiveness is an important manifestation of urban development potential, and is also an important factor affecting the potential of new economy development. Because the economic and talent situations have been reflected by other secondary indicators, city competitiveness is evaluated by four tertiary indicators: the number of authorized invention patents, the city TFP, the number of listed enterprises, and the average air quality index (AQI). The number of authorized invention patents and TFP reflect the technological competitiveness of the city, the number of listed enterprises reflects the enterprise competitiveness and industrial agglomeration of the city (Foghani et al., 2017), and the average AQI reflects the urban environmental conditions.
The Technical Regulations for Environmental AQI (Trial Implementation) (HJ633-2012) issued by China’s Ministry of Environmental Protection defined the AQI of pollutant item

where
The
Data
The data of this study were mainly obtained as follows: crawled with big data technology, collected from urban statistical yearbooks and bulletins, and obtained by modeling and calculation based on raw data. A small amount of data came from research reports of authoritative institutions. The new economy data obtained by big data crawling can compensate for the shortage of micro data and the poor timeliness of yearbook data. Detailed data sources are shown in Table 2. Specifically, the number of new economy enterprises, labor input, technology input, average wage premium of the new economy workers, degree of favor of labor, number of new economy words appearing on the network, inter-city traffic, air passenger transport data, and number of the keywords about new economy mentioned in the Report on Government Work are crawled from relevant websites and documents. The proportion of science and technology expenditure, proportion of added value of tertiary industry, gross industrial output of enterprises above scale, development of modern logistics system, per capita GRP, actual amount of foreign capital, number of regular colleges and universities, number of students in regular colleges and universities, number of full-time teachers at regular colleges and universities, GRP, added value of the tertiary industry, economic growth rate, urbanization rate, total import and export, total deposits and loans of financial institutions, fixed investment in real estate, and number of authorized invention patents are obtained from statistical yearbooks and bulletins of the cities. The number of unicorn enterprises, capital input, intra-city traffic, average AQI are obtained from authoritative reports and government websites. The data of new economy list enterprises come from the listed enterprise database. The data on new economy policies are obtained by policy combing and expert evaluation. The degree of financing constraints, trade freedom, labor productivity, TFP, and misallocation are calculated by the authors based on the enterprise and city data.
Because the units of the variables are not comparable, all the data in this study are standardized with mean 0 and variance 1. Because the data are standardized, some data may be negative, which does not affect the horizontal comparison among cities. For the negative-direction indicators that exist in the index system (i.e., the lower the value, the better), this study takes the additive inverse before standardizing the data, so as to convert the negative-direction indicators into positive-direction indicators (i.e., the larger the value, the better).
In Table 2, the top 10 tertiary indicators by weight are: labor input (0.063), the number of new economy enterprises (0.055125), the number of new economy listed enterprises (0.055125), capital input (0.055125), the average wage premium of the new economy workers (0.04725), the degree of favor of labor (0.04725), the TFP of new economy enterprises (0.045), technology input (0.039375), the growth rate of the tertiary industry’s added value (0.0315), and labor productivity of new economy enterprises (0.027). All these indicators are directly related to the development of the local new economy; thus, although the index system presented in this study considers 46 factors at the city level, it is mainly used to examine the development of the new economy itself.
Evaluation Results for New Economy Development
The New Economy Comprehensive Index (NECI)
According to the index system shown in Table 2, this study evaluated the new economy development of 15 major cities in China from 4 perspectives: performance, environment, efficiency, and potential. Most core indicators adopted the 2018 data, some of which came from the statistical yearbooks of each city. Table 3 shows the NECI of the 15 cities in 2018. The cities ranking from high to low in NECI are Beijing, Shanghai, Shenzhen, Guangzhou, Hangzhou, Wuhan, Chengdu, Nanjing, Chongqing, Suzhou, Zhengzhou, Wuxi, Tianjin, Qingdao, and Xi’an. The recognized first-tier cities, Beijing, Shanghai, Guangzhou, and Shenzhen, rank in the top four of the NECI; Hangzhou, Wuhan, and Chengdu also show strong momentum; Nanjing, Chongqing, Suzhou, Zhengzhou, and Wuxi are relatively weak in new economy development; and Tianjin, Qingdao, and Xi’an lag obviously behind the other 12 cities in terms of the new economy development. The above 15 cities can more rigorously be divided into three hierarchies according to the NECI, by using the statistical system clustering analysis method.
The New Economy Comprehensive Index of the 15 Major Cities (2018).

Note. Negative indicators result from the standardization of data. NECI = new economy comprehensive index.
Beijing, Shanghai, and Shenzhen belong to the first hierarchy, with an average NECI of 0.761. These cities started early with new economy development, have achieved significant scale, and perform better in urban resources, technology accumulation, industrial agglomeration, and other aspects. Therefore, the other cities should take a differentiated path to avoid direct competition with the first hierarchy cities when they aim to develop the new economy.
Guangzhou, Hangzhou, Wuhan, Chengdu, Nanjing, Chongqing, Suzhou, and Zhengzhou belong to the second hierarchy, with an average NECI of −0.054. In recent years, the new economy development momentum in these cities has been strong, and many new economy planning and supporting measures have been introduced successively. For example, in 2018 alone, Hangzhou issued more than 15 new economy policies. At the same time, Guangzhou and Hangzhou have formed their own comparative advantages and characteristics in specific new economy industries such as e-commerce and internet finance.
Wuxi, Tianjin, Qingdao, and Xi’an belong to the third hierarchy, with an average NECI of −0.462. The relative lag of Xi’an’s new economy might be related to its geographical location and urban comprehensive strength. While Wuxi, Tianjin, Qingdao, and Xi’an have also actively been exploring the new economy development path in recent years, there is still a lack of representative industries and enterprises with new economy characteristics. The attraction of relevant policies in these cities are not yet strong, compared with the other 12 cities. Therefore, it is necessary to change the development strategies from traditional original-equipment-manufacturer mode to high-end industrial chain integration.
Comparison of new economic inputs
For labor input, this study only considered the number of undergraduates and above, because it can better reflect the high-tech nature of the new economy. Beijing, Shanghai, Guangzhou, and Suzhou account for more than 40% of the total recruitment in the 15 cities. In terms of education background, Nanjing is the city with the highest proportion of postgraduates, followed by Xi’an, Hangzhou, and Beijing. Capital input includes VC, angel investment, PE, stockjobber direct investment, and strategic investment in all new economic industries. In Figure 2, capital input in Beijing, Shanghai, Wuxi, Nanjing, Shenzhen, and Hangzhou is relatively high, while that in Tianjin, Xi’an, Qingdao, and Zhengzhou is relatively low. In terms of capital input types, VC investment is mainly related to the high risk attribute of the new economy, so it has a bigger share. In terms of capital input industries, the capital mainly flows into internet, IT, logistics, telecommunications and value-added services, biomedicine and health care, internet of things, entertainment media, clean technology, and others. In addition, Figure 2 indicates that there are more technology inputs in Beijing, Shanghai, Guangzhou, Nanjing, Wuhan, and Xi’an, where scientific research institutions are relatively concentrated.

New economy inputs in the 15 cities (2018).
Comparison of new economic outputs
In Figure 3, the enterprise number of Beijing, Shanghai, and Shenzhen is relatively outstanding, especially in Beijing and Shanghai, where there are more total new economy enterprises, new economy listed enterprises, and unicorn enterprises. Shenzhen has a relatively large number of new economy listed enterprises, at 4.03 times and 9.62 times that of Chengdu and Xi’an, respectively. In terms of the number of unicorn enterprises, Beijing accounts for 42%, Shanghai for 21%, Shenzhen for 11%, and Hangzhou for 11%, while the remaining 11 cities account for only 16%. Overall, Beijing and Shanghai already have considerable scale in the new economy; other cities should therefore avoid direct competition with Beijing and Shanghai, and explore a differentiated development path to cultivate local representative enterprises.

The number of new economy enterprises in the 15 cities (2018).
Comparison of industrial foundation and market environment
Figure 4 indicates that both the industrial foundation and market environment in Beijing, Shanghai, and Shenzhen are better; in Tianjin and Chongqing, the industrial foundation is good, but the market environment is weak; in Chengdu and Xi’an, both the industrial foundation and the market environment are weak. Due to space limitations, this paper uses Chengdu alone as an example of analysis of the reasons for its weak industrial foundation and market environment. Chengdu’s weak industrial foundation is mainly due to the low proportion of the tertiary industry and the low gross value of industrial output. Chengdu’s weak market environment is mainly due to the relatively low per capita GDP (13th) and market openness (14th), and the relatively strong financing constraints (13th in financing convenience). Nonetheless, land is relatively cheap in Chengdu, which represents an advantage.

New economy industrial foundation and market environment in the 15 cities (2018).
Comparison of new economy prosperity degree
In the 15 sample cities, the average wage of new economy workers is 1.5 times higher than the per capita disposable income of local urban residents (see Figure 5). The relative wage level in Chongqing, Chengdu, Shanghai, Guangzhou and Wuhan is much higher, about 3 times; while the relative wage level in Suzhou is the lowest, but it is still 1.66 times. Thus, the wage level of workers in new economy industries is relatively high, which shows promise of a rapid boom and usually is an important signal of sunrise industries. In addition, the degree of favor of labor in new economy sectors is more than 5 times, with an average of 8.27 times. Shenzhen and Beijing are the highest with 13.95 and 10.98, respectively, while Zhengzhou is the lowest—5.25 times (see Figure 5). This also shows that China’s new economy employment market is relatively prosperous.

Two new economy prosperity indicators in the 15 cities (2018).
NECI vs. NEI
Figure 6 compares the NECI to the NEI, and indicates that the NECI presented in this study is different from the NEI, but that they have a similar ranking. Regardless of the index used, Beijing and Shanghai rank first and second; the rankings of Hangzhou, Chengdu, Chongqing, and Xi’an are also quite consistent, with Hangzhou ranking fifth, Chengdu about seventh, Chongqing about ninth, and Xi’an the lowest.

The NECI and NEI ranking for the 15 Chinese cities.
In Figure 6, the difference between NECI and NEI is relatively large in Shenzhen and Wuhan. In the NECI ranking, Shenzhen ranks 3rd, while in the NEI ranking Shenzhen ranks 6th; in the NECI ranking Wuhan ranks 6th, while in the NEI ranking Wuhan ranks 11th. The main reasons for the difference in the NECI and NEI rankings are as follows: First, the NEI only considers new economy inputs, while the NECI is the result of comprehensive consideration of the 46 indicators. Second, the time periods covered by the indices are different; the NECI mainly uses 2018 data, while the NEI is the average result of some months in 2017 and 2018. Third, the indicator selection and indicator weights of the NECI and NEI are different. Finally, both the core data of the NECI and NEI are acquired by a big data method, and there are inevitable errors in the acquisition process. In summary, although there are some differences between the NECI and NEI, they show relatively consistent results, and the authors consider the NECI as more comprehensive and helpful in revealing the specific advantages and disadvantages of the new economy in various cities. Besides the NEI, compared with other indices we referred to, the NECI focuses not only on digital economy fields but also on all new economy sectors; is a more comprehensive system which assesses the development of all relevant industries, enterprises and government departments; and collects timely data by a big data method which uses modern web standards for marking up datasets for discovery.
An Illustration Using Chengdu as an Example
Index application
In November 2017, the Chengdu government held a new economy development conference, and issued the following documents: Opinions on Creating New Ecological, Developing New Economy, and Cultivating New Growth Drivers. In the opinions, the Chengdu government has introduced numerous supporting plans to clarify the development goals, paths, spatial patterns, and key enterprises, and formulated more than a dozen policies to support the development of the new economy. As a result, Chengdu, as a representative western city in China, achieves good results in new economy construction, even under relatively unfavorable geographical conditions, with a NECI ranking of seventh, following closely after Beijing, Shanghai, Shenzhen, Guangzhou, Hangzhou, and Wuhan. Provided that the location conditions remain unchanged in the short term, how should Chengdu overcome the geographical constraints and achieve more rapid new economy development?
Figure 7 shows the scores of all the primary and secondary indicators of Chengdu and their rankings in the 15 cities. The development potential in the lower part of the figure represents the advantage of Chengdu’s new economy, which needs to be maintained; the development environment on the left part is the disadvantage of Chengdu’s new economy, which needs to be further promoted and improved; the development efficiency and performance on the upper and right parts of the figure represent neither advantages nor disadvantages; and need to be further explored.

Advantages and disadvantages of developing the new economy in Chengdu.
Advantages of Chengdu’s new economy
Figure 7 indicates that the advantages of Chengdu’s new economy construction results from its relatively high efficiency level, relatively reasonable strategic planning, strong policy support, large human resources reserve, and high prosperity degree. Specifically, Chengdu has four advantages in the process of new economy construction.
First, the relatively high level of efficiency reflects the intensive model of Chengdu’s new economy construction, which is the inherent requirement of high-quality urban development, which needs to be further maintained, but, Chengdu also needs to explore effective ways to continuously improve its efficiency level.
Second, Chengdu’s strategic planning for the new economy is relatively scientific and effective, and its policy support is relatively strong and actionable. However, the attraction of policy is relative. Only by constantly improving can the city continuously attract and provide high-quality factors for the construction of the new economy.
Third, Chengdu’s new economy prosperity degree is relatively high and its development potential is relatively large. This is due to the vigorous cultivation of the city’s business environment by the Chengdu municipal government in recent years, which is conducive to attracting new economy enterprises and technicians into Chengdu. According to China’s Top 100 Urban Development Potentials in 2019, published by the Hengda Research Institute, Chengdu’s comprehensive index of urban development potential scored 80.6, ranked fifth, showing that the evaluation results of Chengdu’s development potential in this study is relatively robust.
Finally, Chengdu is located in the southwest of China and has access to the vast market of the west. In contrast, although the eastern cities possess the coastal advantages, the competition among themselves is particularly fierce. Chengdu can make full use of the resources and market advantages of the western region, integrate into the construction of the Belt & Road and the Yangtze River Economic Belt, and enhance its own regional and international status in the process of new economy construction.
Disadvantages of Chengdu’s new economy
It is evident from Figure 7 that the disadvantages of Chengdu’s new economy are not the new economy itself, but the new economy environment provided by the city. The development of any industry is inseparable from the environment in which it is situated; the new economy is no exception, especially the market and technological environments. However, compared with the other 14 cities, Chengdu’s industrial and market environment is not dominant, which has restricted the development of its new economy. At the same time, Chengdu’s traffic conditions, especially inter-city traffic, still have room for improvement. This is of course related to the geographical location of Chengdu and, with the completion of the nine metro lines under construction and Tianfu International Airport, Chengdu’s traffic conditions will be greatly improved. From the perspective of the new economy itself, the Chengdu government should pay more attention to promoting the continuous improvement of efficiency and attracting the inflow of talents, capital, and technology into the local new economy industries.
Conclusion and Recommendations
Conclusion
According to the data released by the National Bureau of Statistics, the added value of the new economy in China in 2017 was 12,957.8 billion yuan, accounting for 15.7% of GDP; further, its growth rate was 14.1%, which was 2.9 percentage points higher than the GDP growth rate. The development of the new economy is not only conducive to promoting economic growth, but also relates to capturing the technological highlights and world markets for an extended future period. This study examined the development of China’s new economy, structured a NECI to measure it, and conducted an empirical comparison among 15 Chinese major cities.
For practical implications, the presented index system provides a nuanced perspective on the intercity comparison of the new economy. For theoretical value, this is one of the few studies which evaluate the new economy development between cities or countries. Specifically, the following conclusions are obtained.
According to our evaluation results, the cities ranked from high to low in the NECI are Beijing, Shanghai, Shenzhen, Guangzhou, Hangzhou, Wuhan, Chengdu, Nanjing, Chongqing, Suzhou, Zhengzhou, Wuxi, Tianjin, Qingdao, and Xi’an. Among them, Beijing, Shanghai, and Shenzhen belong to the first hierarchy, with an average NECI of 0.761; Guangzhou, Hangzhou, Wuhan, Chengdu, Nanjing, Chongqing, Suzhou, and Zhengzhou belong to the second hierarchy, with an average NECI of −0.054; and Wuxi, Tianjin, Qingdao, and Xi’an belong to the third hierarchy, with an average NECI of −0.462.
With Chengdu as illustration, it can be concluded that the advantages of Chengdu’s new economy construction lie in its relatively high efficiency level, relatively reasonable strategic planning, strong policy support, large human resources reserve, and high prosperity degree, while the disadvantages are not the new economy itself, but the new economy environment provided by the city. Therefore, Chengdu should pay more attention to the industrial and market environment of the new economy, as well as the traffic conditions, especially inter-city traffic.
Recommendations
Based on the above conclusions, the following recommendations are made: First, the new economy includes not only the new industries, but also the combination of traditional industries and new technologies, as well as new models. Therefore, cities should not develop the new economy in isolation; conversely, it is necessary to combine the construction of the new economy with the high-quality development of the cities. Second, Beijing, Shanghai, and Shenzhen already have a large scale of new economy. Other cities should adopt a strategy of differentiated competition to cultivate their comparative advantages in the new economy, and avoid vicious competition among cities and similar industrial layouts. Third, the industrial norms and standards of the new economy are not perfect (e.g., the property rights, privacy rights, and inheritance rights of digital products; the traffic regulations for low-altitude unmanned aerial vehicles and other new low-altitude vehicles; and the access system of the mobile app market), and have restricted the development of the Chinese new economy. Therefore, the government should work with enterprises to formulate relevant industrial norms and standards as soon as possible. Finally, with the case of Chengdu, this study finds that the disadvantages of Chengdu’s new economy are not the new economy itself, but the new economy environment provided by the city. This teaches other cities a lesson that the development of new economy industries is inseparable from the environment in which they are situated.
Limitations and Future Work
A limitation of the study is as follows. Since micro data are not easy to obtain, this study used big data methods to collect data, and combined some statistical yearbook and bulletin data, which may have produced some errors. With the development of big data technology, it will be easier to obtain micro data and develop more accurate evaluation results. The new economy is in the process of dynamic development with new technologies appearing often fortuitously. However, it is difficult for us to consider these fortuitous factors when evaluating the development potential of the new economy. In addition, our index system is mainly designed to evaluate the new economy development of Chinese cities. The index system should be adjusted for application to other countries or for international comparison. Nonetheless, this study could provide helpful experience. On the one hand, to better evaluate the development of a new economy industry so as to promote it, the country or region needs to select some reasonable evaluation indicators; in this regard, our index system could provide references. On the other hand, our above four recommendations could also provide actionable references for other countries and regions to develop the new economy.
Footnotes
Acknowledgements
We gratefully acknowledge the New Economy Survey Team of Sichuan University and Wenxin Li for providing us data. Zhongqi Deng acknowledges the Philosophy and Social Sciences Planning Project of Sichuan Province.
Declaration of Conflicting Interests
The author(s) declared no potential conflicts of interest with respect to the research, authorship, and/or publication of this article.
Funding
The author(s) received no financial support for the research, authorship, and/or publication of this article.