
Abstract
Spatial and spatio-visual analysis are space syntax analysis techniques that examine spatial configuration with graphs and numeric data. This study is based on spatial and spatio-visual analyses of traditional residences and comparison of these analyses. The historically and strategically important city of Bitlis in eastern Turkey was chosen as the study area. The most important structures that constitute the historical urban fabric within this protected area are the traditional residences in Bitlis. The spatial integration values obtained by the accessibility graphs and the visual integration values obtained by the visibility graphs are compared in 15 traditional residences plans using space syntax analysis techniques. For “accessibility” graphs, “Agraph” software and for “visibility” graphs, “Depthmap” software were used. Both programs are based on the theoretical and conceptual basis of space syntax analysis techniques. This research is important in terms of interpreting the existence of social and cultural information as well as environmental factors behind the space configuration of Bitlis traditional residences by examining them using scientific data.
Introduction
One new method in the architecture discipline that aims to present information on space compositions with numeric analysis data is the space syntax theory. This theory is a new syntactic theory that has been constructed with a different point of view for space organizations of each scale from a single building on a settlement scale, developed with the intention of understanding the relationship between space and social life (Hillier & Hanson, 1984). The examination of relationships between spaces with only space syntax analyses rules out space openness and sizes. Space perception differs depending on not only the physical movements of the users but also their visual perceptions. Space syntax analysis techniques, which are constitutively built on movement-based accessibility and the perception of the moving observer, attempt to analyze and understand the status of residential areas’ control, privacy, social structure, and user–visitor relationship (Atak, 2009). Concept of visible area, which enables the visual accessibility of spaces to be examined, as well, was first proposed in 1967 by Tandy and refers to the polygon formed by all spots that are visible from one particular chosen spot in the space (Benedikt, 1979).
Space is a gap that separates the person from the environment to a certain degree and is sufficient for them to maintain their actions in that environment (Hasol, 2016). Residential spaces are units that reflect social and cultural values with various arrangements. A different spatial model is present in each culture because cultural values reflect the space and spatial construct. Space syntax analysis techniques are methods for analyzing the relationship between space and culture numerically, apart from predictions and assumptions. With these techniques, based on space arrangement, users’ space movements and visual perceptions, relationships between spatio-social structure and spatio-cultural structure are pointed out scientifically.
The aim of the study is to research the social and cultural information behind the traditional residences by revealing spatial and spatio-visual structures with the obtained analysis data and to interpret the relationship between the residential culture and the spatial configuration of the residences.
Within the scope of the study, it was evaluated as spatial and spatio-visual in 15 officially registered residences on plan scale in Zeydan district where the most original examples of Bitlis traditional residences were found.
As a scientific method, space syntax analysis techniques which are spatial analysis and spatio-visual analysis were made in the study. This study will be supported with mathematical and concrete results, which allows analysis and evaluation using space syntax analysis techniques for space configuration studies conducted with traditional research methods. In addition, the work is important in terms of presenting a solution that can be used as a design tool in the future besides interpreting the existing spatial configuration.
This type of case studies is important as a preliminary preparation for re-functionalization, conservation, restoration, and sustainability decisions to be taken by designers or local authorities on traditional buildings and settlements.
Space Syntax Analysis Techniques
It is stated in the space syntax theory, which reveals the existence of a strong relationship between external effects that produce forms and social power, that buildings and large-scale accommodation units have spatial features that affect relationships between people and social structures (Hanson, 1998).
In the space syntax analysis techniques, relationships between spaces are modeled with numerical and graphical language and examined with scientific language. Space syntax was developed for spatial constructs to be defined and analyzed. In this method, it is emphasized that spaces have a more complex structure than a simple form. In addition, this method is based on the relationships among spaces, system structures, and functioning of the system (Özyılmaz, 2007).
Space syntax changes depending on how the relationships between two spaces link any one or both of these spaces with another space (Hillier, 1996). A spatial construct does not occur arbitrarily, and spaces are put together with certain rules to generate certain social outcomes (Hillier & Hanson, 1984).
The structure of the spatial construct is expressed using transitional graphics. This expression is described in Figure 1.
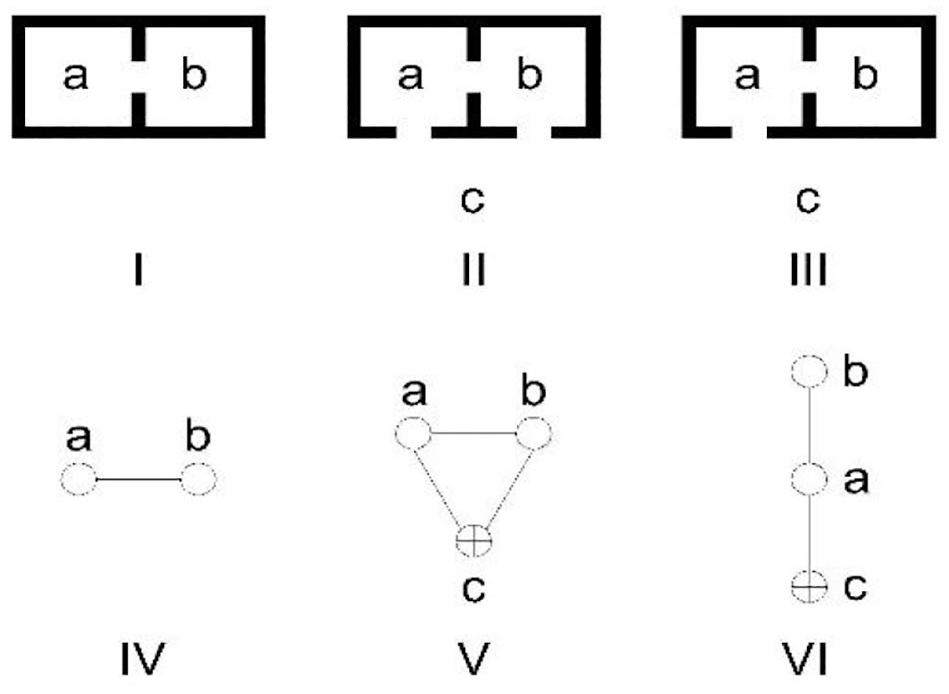
Spatial construct example (Hillier, 1996).
In Figure 1-I, a permeability relationship is established through a transition between the a and b subspaces in a basic space. Subspaces a and b are mutual neighbors, and there is a symmetrical relationship between them. In Figure 1-II, a relationship is established with the addition of space c to subspaces a and b. While space a and subspace b are related to each other, they are also directly related to space c. In Figure 1-III, although subspaces a and b are directly related to each other, space c is only directly related to a. To get from space c to space b, it is necessary to stop at subspace a. Therefore, there is an asymmetric relationship. Figure 1-IV, V, VI are the examples stated in terms of access relationships of the relationships in Figure 1-I, II, III (Hillier, 1996).
Spatial Configuration Parameters
With the space syntax analysis techniques, relationships between spaces are interpreted by obtaining the control value (CV), connectivity, relative asymmetry (RA) (integration) value, external and internal integration value, and spatial depth.
The valuation of a space involves the number of spaces passed while reaching that space, while the number of topological steps is the number of surpassed spaces. The overall depth value of a space is regarded as the average of the number of topological steps of all spaces (Figure 2).
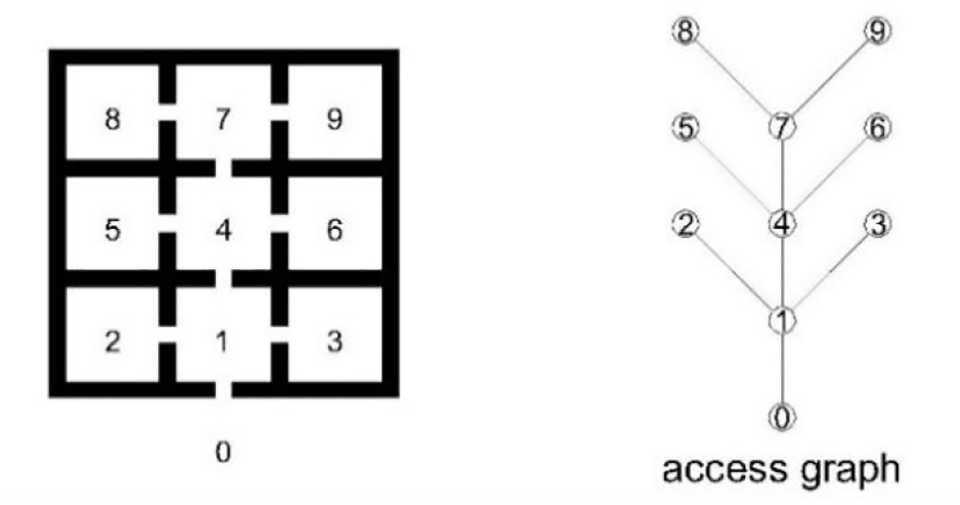
Access graph created according to a building and its outdoor space (Hillier, 1996).
Topological steps to the outdoor are: 1 from Space 1, 2 from Space 2, 2 from Space 3, 2 from Space 4, 3 from Space 5, 3 from Space 6, 3 from Space 7, 4 from Space 8, and 4 from Space 9.
CV
The CV is a dynamic local measurement. The CV indicates the degree to which a line controls access to its neighbors and neighbors to others (Hillier & Hanson, 1984). It describes the comparative level of control over the connected components (Wu & Guo, 2014).
Connectivity
The connectivity is the number of neighbors directly connected to a space and it is a static local measurement.
RA (integration) value
Depth-dependent variability is expressed in transition charts in a mathematical form called “integration.” The integration value of a space is that space’s relative depth within all other spaces in the graphic (Hillier & Hanson, 1984):

The integration value “dort” in the formula states the average depth of all the spaces from the investigated space, while “k” states the total number of spaces. To calculate the average depth of all the spaces from the space in question, a depth value is given to each space depending on how many topological steps away they are from the starting space. These values are added up and divided by a subtraction of one from the total number of spaces (starting place) in the system (Özyılmaz, 2007):

The RA value is valued between 0 and 1. Low values indicate that the space tends to integrate with the system, while high values indicate a tendency to leave the system (Hillier & Hanson, 1984).
External and internal integration values
The external and internal integration values, which are values calculated to investigate the relationship between indoor and outdoor spaces, may not show a significant difference when outdoor space is neglected, but they can make an important impact. The calculation and investigation of the external and internal integration values of residential spaces help to explain the occupant–occupant and occupant–visitor relationship in the planning and organization of the spatial model (Korkmaz et al., 2004).
Spatial depth
This depth is related to the transitions formed by doors in the architectural plan. It is defined as the total depth and the mean depth. The total depth is defined as the sum of the topological depth from any a node to all the others (Hillier & Hanson, 1984). The mean depth is expressed by “MD” and it is obtained by dividing the depth of all the spaces according to the start/root space by the total number of places.
Accessibility Analysis and Agraph Software
The accessibility graph was developed to express differences in spatial models. It is a graph that is reconstructed by positioning a specific space at the starting point. In the study, accessility graphs obtained by Agraph software were used for the spatial analysis.
Agraph is developed by Bendik Manum and his colleagues, Espen Rusten and Paul Benze. It is a software for drawing accessibility graphs and for doing space syntax calculations and made for drawing graphs on the basis of imported background images such as floor plan drawings. By a “snap to grid” option and “click-and-drag” commands justified graphs are easily made. Agraph calculates the basic space syntax parameters of the graph-nodes but has also the option of excluding selected nodes from the calculation. Agraph has several coloring modes. There are many different color modes for each space. One of these modes is a special mode created by coding each ring with a color. Another mode is colored according to two of the space syntax parameters, the CV and RA value. Colors are used on the access graphs obtained from Agraph, and these colors indicate whether the spaces are integrated or divergent. Red indicates the most integrated space, while dark blue indicates the most divergent space. The colors are sorted as red < orange < yellow < green < blue < dark blue according to the integration values of the spaces shown in Figure 3 (Manum, 2006).

Agraph circle and color display (Manum, 2006).
Spatio-Visual Analysis and Depthmap Software
The concept of visible area, which was proposed as a way of subtracting a permanent record from the architectural space based on memory and a large number of annotative photographs, was first introduced in the field of architecture in 1967 by Tandy (Atak, 2009). In Figure 4-I, a hypothetical indoor space environment is shown; in Figure 4-II, the visible area is colored according to a given stagnation point inside the space, and in Figure 4-III, the visible area result is defined (Wiener & Franz, 2004).

Production of visible areas (Wiener & Franz, 2004).
Benedikt was the first to use visible area as a method for space. Visible area, according to Benedikt, is a set of all points visible from a point designated in the space. The shape and size of the visible field vary according to the observer’s point of view and stance. Visible area is a polygon formed by all the spots visible from a spot determined in space (Benedikt, 1979).
The visible area method is used in the investigation of the local features of the space on the scale of the building, the investigation of the spatial analysis tools, the development of techniques to create a socially good life, and the construction studies of the spaces related to the residence (Atak, 2009).
In the visible area analysis, a surrounding three-dimensional environment is defined as “E.” The area limited by a convex boundary is defined as “D” (Figure 5). The points that form D refer to a true surface that is opaque, substantial, and perceivable by the user (Benedikt, 1979).

Visible areas in D that are formed by E (Benedikt, 1979).
The apparent area Vx is formed from a selected “x” point in the D convex area. A set of points formed by completely visible surfaces from this point is a path that also identifies the visible area (Atak, 2009).
This visible area can be divided into three as the true surface Sx, the invisible area Rx, and the regional border surfaces Dx (Figure 6). These borders are perceived individually (Benedikt, 1979).

Visible area components (Benedikt, 1979).
In the visible area, the polygon area is expressed as Ax, the environmental surface parameters of the visible area are expressed as Px, and the invisible area sum is expressed as Qx (Benedikt, 1979). In the case of Qx = 0, the space can be fully perceived. In the case of Qx > 0, the space cannot be fully perceived (Figure 7).

Evaluation of the Qx value according to the visible area measure (Benedikt, 1979).
A number of basic measurements are developed to investigate the visibility features for performing a visible area analysis. These are the clustering coefficient, environmental measure, point depth entropy, and controllability measurements. Within the scope of the study, visibility graphs were obtained, and visual integration values were calculated.
Spatial construct relationships are investigated using the visibility graph analysis (VGA). Depthmap, which is to be used in the analysis, enables the open spaces to be filled with grids by performing a two-dimensional (2D) drafting operation in the “dxf” format, which is an extension of the Autodesk software. After the graph is created, several analyses can be made on the spatial system. Analyses help define the spatial construct definition of the visible residence. It can also give information on navigation, movement, and usage of space. Visualization of the gap is made by the user, consciously or unconsciously. Therefore, the relationship between visibility and permeability is important in terms of how the constructions of residential spaces are carried out by the users (Tahar & Frank, 2003).
Openness measures are not important in the spatial analysis because accessibility between spaces is examined. In the visible area analysis, the measures of the gaps between spaces are calculated, and the visibility integration values are determined. With these values, the gaps are objectified and expressed. For this reason, the visible area analysis suggests some additional measurements that the spatial analysis excludes (Güney, 2007).
Benedikt (1979) has theorized that visible areas are somehow suitable for people’s movement patterns, and Hillier (1996) has revealed that the relationship between the lines throughout the space complies with the movement patterns inside the space. The visible area must be combined with space syntax analyses to provide a measurement of how successfully visible areas can integrate among themselves within the plan of a space. For this reason, the visible area method has been modeled to be simple operations such as the VGA (Atak, 2009).
Depthmap, which was developed to analyze the visibility structures of architectural systems, was developed by Alasdair Turner to incorporate the space syntax theory, which was proposed by Hillier and Hanson, and the visible area analysis was proposed by Benedikt. Depthmap allows 2D plans in the “dxf” format to be imported into the software and allows the plan to be filled with grid points. These points are later used to create a visibility graph. After the graph is created, Depthmap enables the user to make many different analyses. Depthmap colorizes blue, light blue, green, yellow, orange, red for low values and the inter-spectral values between blue and magenta for high values. In this study, UCL DepthmapX version 0.6.0 was used (depthmapX Development Team, 2017).
Depthmap enables the user to make visible area, convex space, and axial line analyses (Turner, 2004). Within the scope of the study, visibility graphs were created and visible area analyses were made.
Case Study: Bitlis, Zeydan District, and Traditional Residences in Bitlis
Bitlis is a historical city in the Eastern Anatolia region of Turkey (Figure 8). It has been a settlement area since ancient times due to proximity to an important trade route that historically connects the Western and Eastern regions; consequently, the city was designated an archeological, urban, and natural protected site. The city, which has developed linearly along narrow valleys and transportation axes due to its physical thresholds, has a spatial structure formed by the historical development process (Sönmez, 1996).

Bitlis’ location in Turkey (by authors).
The geographical structure of Bitlis has determined the old urban texture of the city (Figure 9). The extreme slope in the city has prevented the formation of organized streets and avenues, causing the city to sustain its organic development. The traditional residences, which were built in a discrete or adjacent order with flat, arched wooden doors that provide access to the street, came together to form residential areas. Residences with yards or gardens are separated from the street by high walls. The street connections in the settlements include stairs in most places due to the extreme slope of the land (Öztürk & Sayan, 2001).
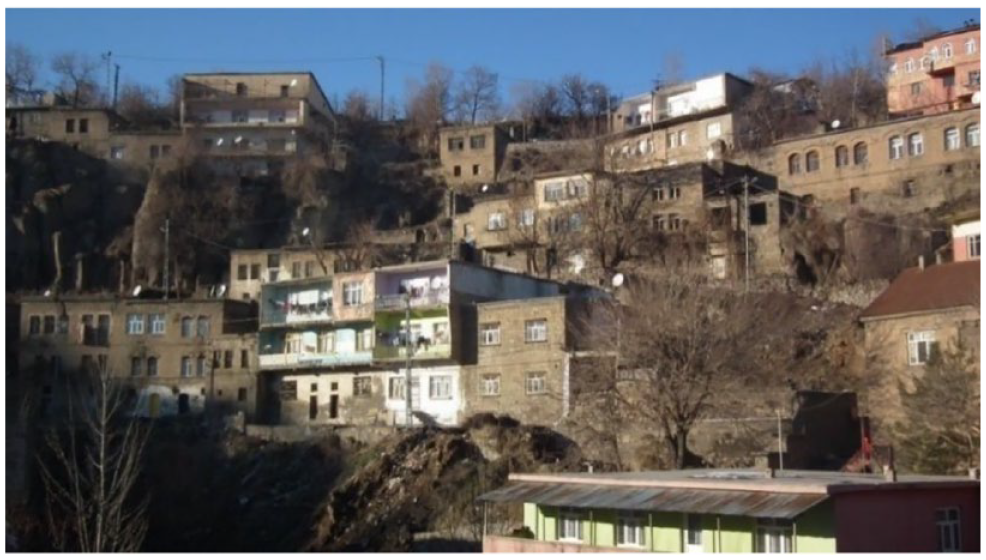
Traditional residences in Bitlis (by authors).
Bitlis castle, which is the center of today’s settlement and one of the indispensable features of the city, is built on high rocks and has a full view of the city. The castle, which has repeatedly been emphasized to be built by Alexander the Great, has been used by different cultures until the late Ottoman period due to its important geopolitical location. It is understood from the records of Evliya Çelebi that the main settlement surrounding the castle, which we specify as the lower city, is also surrounded by an outer fortification wall. Evliya stated that the “lower castle,” which reportedly could not encircle suburban residences, consisted of unstable plain walls and had two walls to the east and west (Baş, 2010).
Examples of monumental architecture are located in certain parts of the city, along with the castle and residences from the 18th and 19th centuries, most of which are still being used today. These buildings form the skeleton of the historical urban texture. This texture creates the settlements through interconnection with streets. The historical streets, although largely damaged by the introduction of motor roads in the mid-20th century, still retain their original structure in certain regions (Baş, 2010).
Apart from the existing settlement area in Bitlis castle, new settlement areas were established depending on the increase of the urban population. One of the first settlements established in the castle hills outside the castle area is the Zeydan district, which was designated a protected area and features historical residences that are densely concentrated (Figure 10).

Location of the Zeydan district in the Bitlis central settlement (by authors).
In Bitlis, one of the four protected urban sites registered by the Cultural and Natural Heritage Preservation Board is an area containing residential areas and cemeteries located to the east of the Zeydan and Müştakbaba districts. The Zeydan district is one area where traditional residences, which are the main structures that form the urban texture, are concentrated. There are many registered traditional residences in the district (Figure 11).
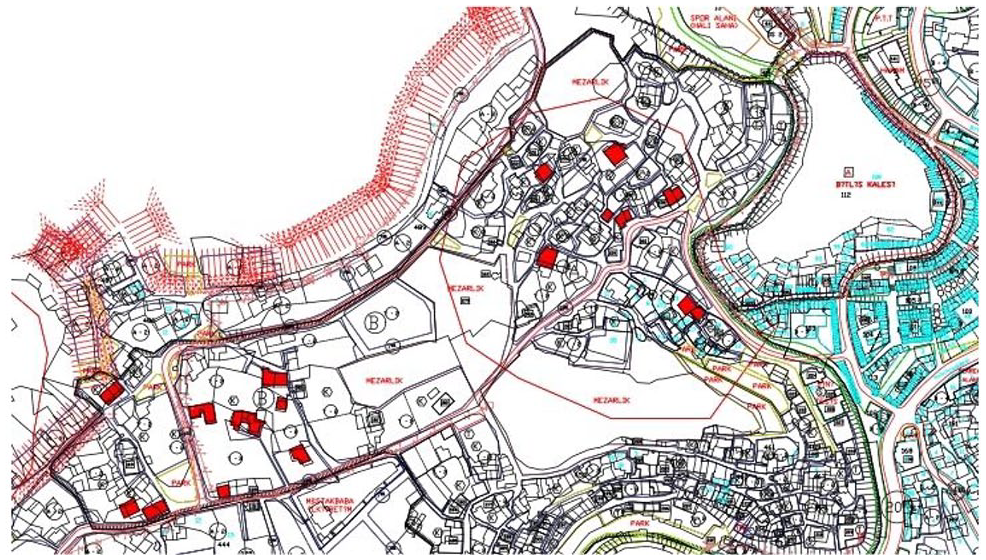
Zeydan district spreading over Bitlis castle and officially registered traditional residences (by authors).
It is possible to find traces of social and cultural factors aside from geographical and physical data in traditional residences in Bitlis. Bitlis is a migratory city. In this region, where the tribal system is commonly present, people prefer to live in closely affiliated groups in neighborhoods. Although there are not many in Bitlis, extended families consisting of mothers, fathers, married male children, brides, grandchildren, unmarried male and female children, grandfathers, and grandmothers still exist. Some traditional residences are designed according to this family structure. It is thought that composite constructions, which look similar to single structures from the outside and have construction elements such as entrances on different floors, interior restrooms, and bath, are designed or developed according to the extended family structure the layout of separate rooms for each family offers private units. Traditional Bitlis residences are designed as closed mechanisms where their inhabitants can have their needs met within the structure (Oğuz & Aksulu, 2016). The upper floors are based on the principal of the privacy of domestic life, while the entrance floors of the residence are designed for incoming guests.
The residences usually have internal hall layouts. Internal halls are common areas for activities such as resting, eating, guest reception, and so on. Common events take place in the courtyard and garden in the summer and in internal halls in the winter. Bitlis residences are built with a flat roof using traditional Bitlis cut limestone (Öztürk & Sayan, 2001).
The walls of Bitlis residences, which are stacked structures, are quite thick. This thickness creates an advantage in terms of warming the residences in the winter months in a region where severe weather conditions prevail. Likewise, the windows and doors are small due to the constraints imposed by the construction technique and the harsh weather conditions. Men and women live separately in some Bitlis residences given the influence of Islamic religious beliefs. In Bitlis residences, the outer building plan is constituted by yards and gardens. In two- or three-story residences, the lower floors consist of units such as winter rooms, stables, cellars, and closet sections, while the upper floors consist of halls or rooms opening to the corridor, kitchens, and Turkish baths.
Traditional residences in Bitlis, which have modest outer views, are generally designed as outward facing. Contrary to the inward-oriented courtyard residences of Southeastern Anatolia, traditional residences in Bitlis are externally oriented, as in Central and Coastal Anatolia residences (Oğuz, 2012).
Findings
In this research, the residence which mutually interacts with the social and cultural structure is analyzed based on 15 traditional residences in Bitlis, which are the main constructions shaping the urban fabric. Areas where most residences are declared part of an urban protected area are examined and are in a narrow field on the hillside of Bitlis castle, which was the first residential area in Bitlis.
Within the scope of the research, whether the spatial analyses of the examined residences and data of spatio-visual analyses have mutual properties are analyzed. The spatial and spatio-visual analyses are prepared in the scale of traditional residence using analysis techniques from Agraph and Depthmap softwares. To perform the analyses and to provide the necessary file format, residence plans are drawn with a computer-enhanced program. In the research, these plans are used.
The examined residences are evaluated with accessibility graphs that are prepared in Agraph in the spatial context. With those graphs, the maximum depth, minimum, maximum and average integration, and main diversity factor values are obtained. In the spatio-visual context, they are evaluated by the visibility graphs and convex space maps that are prepared in Depthmap. All the residences are analyzed separately by excluding and including the outdoor space. With the maps including and excluding the outdoor space in Depthmap, integration, involvement, average depth, entropy, and controllability values are obtained. With convex spatial maps based on transparency and visible area maps with visual integration, involvement, visual average depth, visual modulus aggregation, visual controllability, and visual entropy values are also obtained. The values obtained about residential space are expressed both visually and statistically. Thereafter, spatial arrangements and visual area structures are examined using those data.
Accessibility Analyses of Traditional Residences
The exterior accessibility graphs for each residence are obtained by analyzing residences with the techniques that Agraph has provided. While accessibility graphs are being prepared, each represented space was enumerated. The plans that belong to residences and accessibility graphs are shown in Table 1.
Residence Plans and Accessibility Graph Analysis.


The entrances of Bitlis traditional residences are from different elevations based on topography. In the study, due to the preparation of an integrated accessibility graph of different floors, the stairs were evaluated considering the interconnected spaces.
With the accessibility graphs of residences where the exterior space is included, the maximum depth, minimum, maximum and average integration, and basic diversity factor values are obtained. Of all these values, the minimum, average, and maximum RA, integration (i) and CV data are given in Figure 12 and Table 2.

Visualization data of minimum, average and maximum RA, i, and CV of the residences.
Analysis Values Based on Minimum, Average, and Maximum RA, i, and CV Data of the Residences.

Note. RA = relative asymmetry; i = integration; CV = control value.
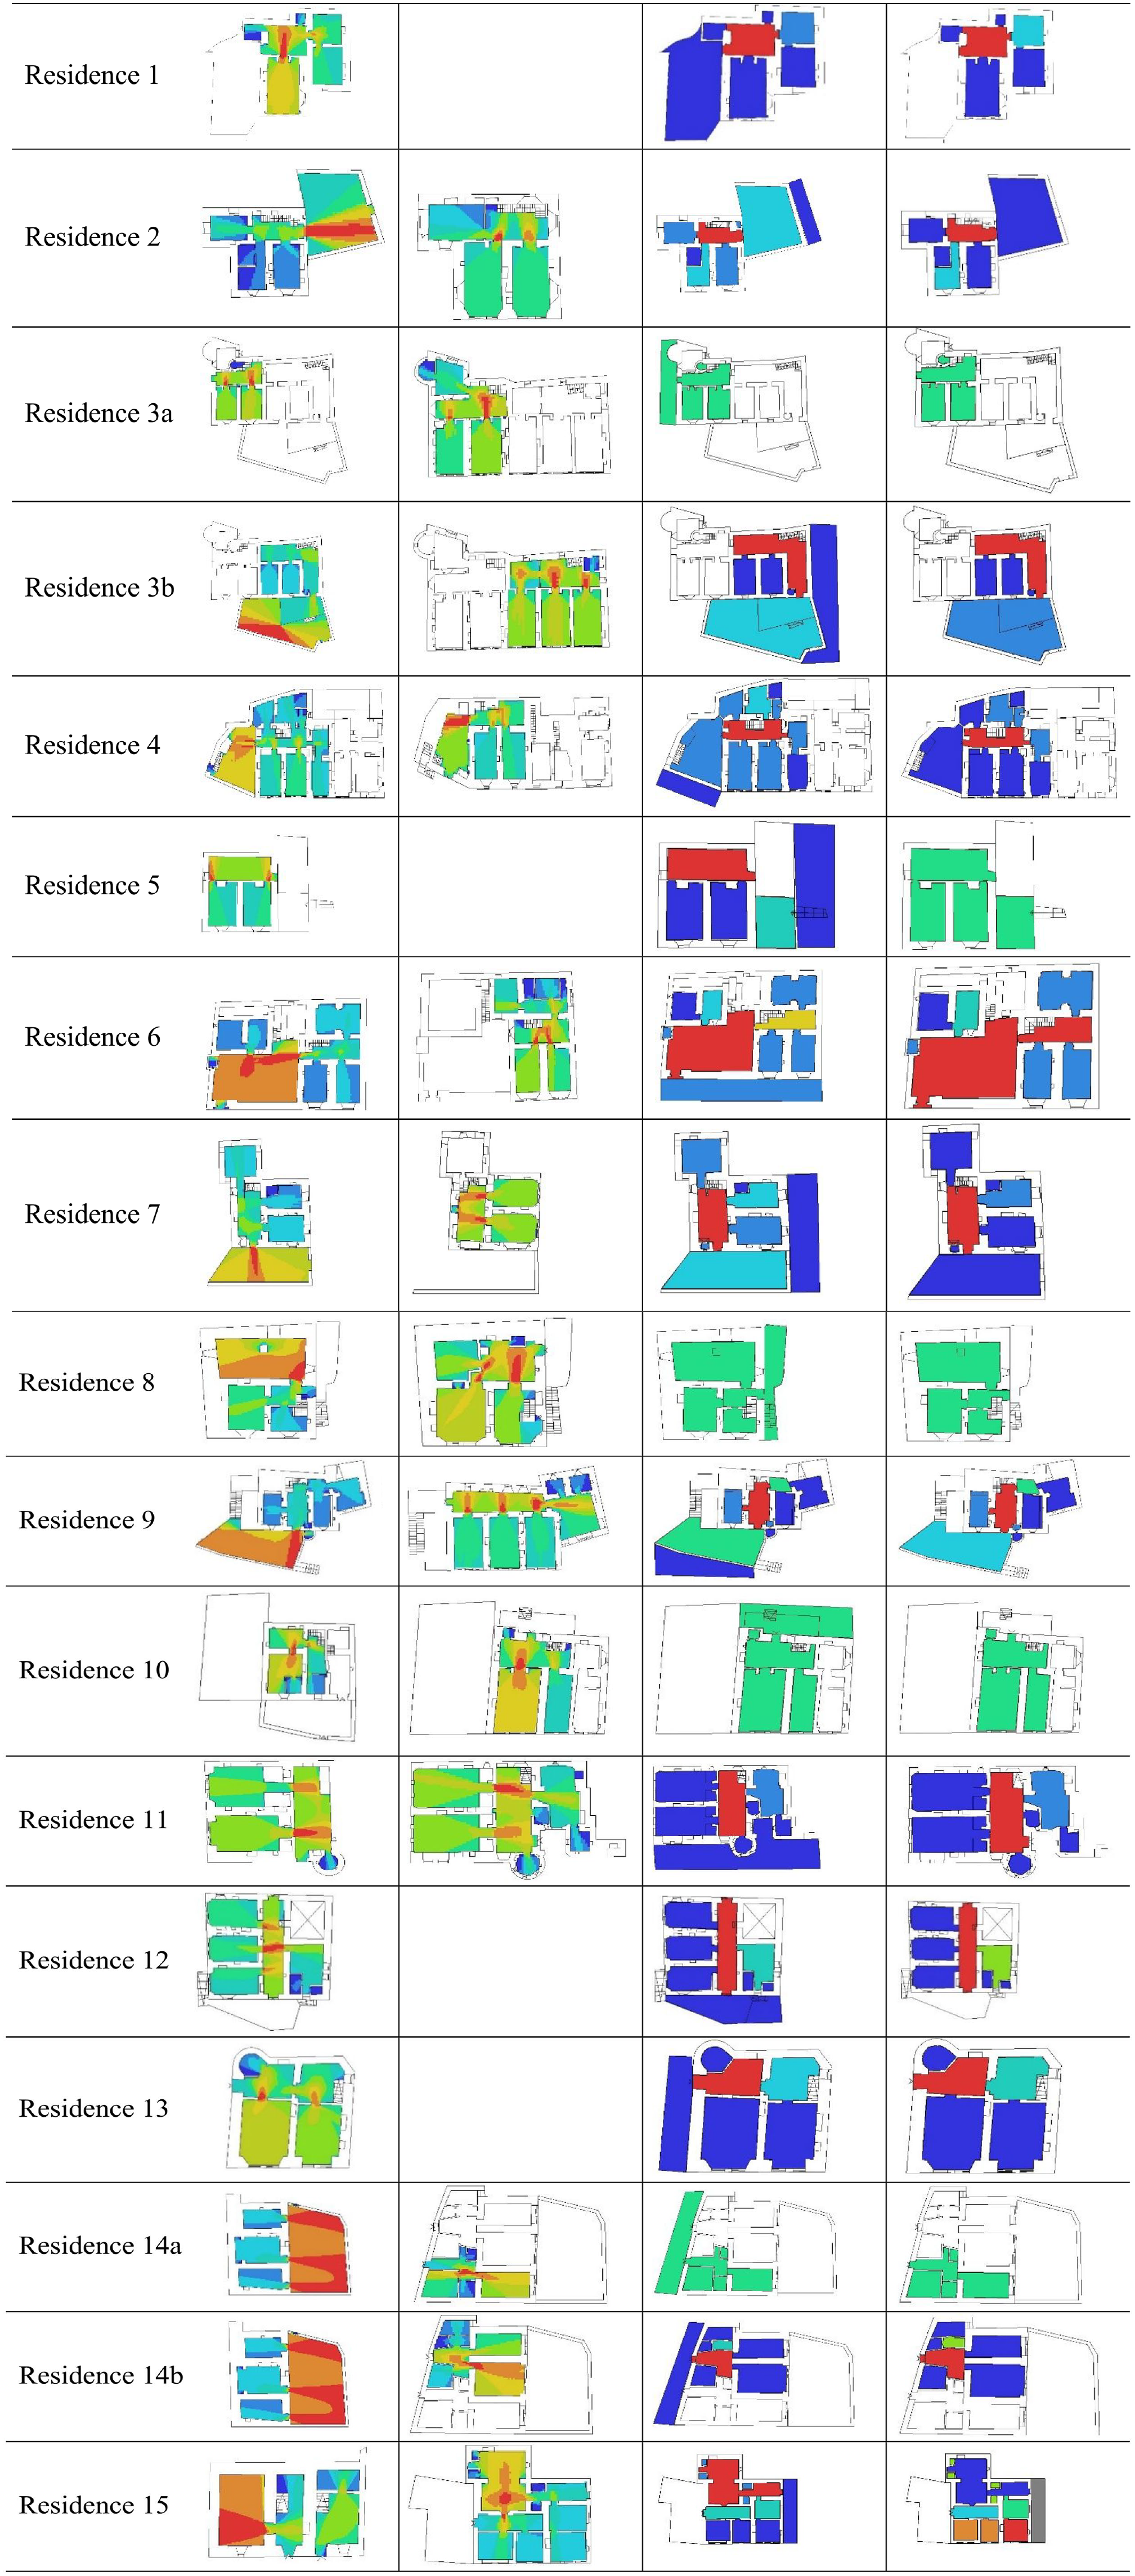
Visibility Graph Analysis of the Residences.

Findings of Visibility Analyses of Bitlis Traditional Residences.

Visibility Analyses of Traditional Residences
The visibility graphs of traditional residences were analyzed by Depthmap. Visibility graphs and convex space maps of the residences are shown in Table 3 and findings of visibility analyses are given in Table 4. The streets where the residences opened are defined as outdoor spaces. Analyses were made by including and excluding outdoor spaces to examine whether the houses are introverted or extroverted. Residential spaces were analyzed as empty spaces without any mobile furniture. The Depthmap grid is approximately 300 mm per square in all residences equally.
In the graphs, spaces were evaluated in a color palette that varies from red to blue through their integration levels. While red represents the most integrated place in terms of visual accessibility, deep blue represents the most differential places. Thereafter, the graphical and analytical map data from the Depthmap software are interpreted separately for each residence.
The stairs are designed in corners that do not affect the visibility in size and location in the multi-story Bitlis traditional residences. For this reason, in visibility graphs stairs, analyzed together with the places they are located as in accessibility graphs. This handling of the stairs effectively means that the visibility graph of upper and lower floors are independent of each other.
Discussion
The numeric and graphic data of the findings of space syntax analysis techniques of traditional residences in Bitlis, which are obtained by Agraph and Depthmap, are all interpreted through a comparison for each residence in Table 5.
Comparison of Analysis Findings for the Spatial and Spatio-Visual Integration Values

Conclusion
To uncover the spatial arrangement of traditional residences in Bitlis and the underlying social and cultural information for this arrangement, the residences that are examined have been inspected by preparing accessibility and visual integration graphs for the relationships of permeability and visibility. With the analysis data obtained, similar and different properties of spatial and visible area structures of the residences have been shown. In the research, the results have definitively shown that the residences are integrated as hall-centered. Of all the residences, the halls provide a connection between all the units in the residence with their location, which allows for communal social activities. They also serve as a transition space that connects the interior space to a yard or garden. In some examples, the yard connects the residence to an exterior space as a circulation space. The analyzed residences, in general, show a differentiative tendency in terms of the clustering of their spaces. While 10 of the residences are extroversive, seven have an introversive structure. In the differentiated side of the average integration of the residences, places such as ground floor rooms, upstairs rooms, toilet (for the residences that have one), and storehouse are dominant in the spatial analysis; on the integrated side, the halls.
According to the data obtained from the results of the analysis, central spaces such as halls, yards, and gardens are visually more integrated spaces as a result of common life awareness. While spaces such as living rooms allow for general usage of the residence, spaces such as barns, baths, toilets, storehouses, upstairs rooms, and tandoori houses in some residences are visually more differentiated spaces. The obtained data imply that the differentiation of those residences is related to the fact that those places are either private spaces or activity areas. While most of the ground floor rooms show more of a differentiated structure in terms of accessibility, they show more of an integrated structure in terms of visual integration. In these rooms, by creating visual blocks to doors and windows, privacy is established.
In both analyses, the most integrated space is the sofa, which is used as the transitory area for the upstairs and the outside space, or between spaces, with the highest circulation. The other integrated spaces are living quarters, which are used for living or sleeping. The tendency of differentiation appears in spaces used for various purposes. Spaces that are differentiated in the spatial analysis show a more differentiated structure in the visual integration. The spaces that show the most tendency toward differentiation are rooms that are close to the entrance, kitchen, WC or bathroom, and spaces that serve as both the bathroom and WC. The fact that the ground floor of the residences are open to residents and visitors affects these data. In the gradation, it is observed that residences with large yards with windows that open to the yard or other interior spaces and have alternative transitions in the interior area are visually more integrated, while the residences with halls and those that accommodate more than one family are more differentiated. The fact that there are several families in each residence affects the differentiation of each residences by increasing the privacy of each room.
When the spatial and spatio-visual analyses of the traditional residences in Bitlis are compared, the functions and roles of the spaces overlap on a vast scale. This indicates that the accessibility and visibility structures of the interior space of the residences function together.
Although the research is done on the regional scale of traditional residences in Bitlis, it also can be used in other contexts. These types of studies have importance in terms of presenting and drawing attention to create more integrated spaces in both spatial and spatio-visual contexts, especially in the design phase of those structures.
Footnotes
Declaration of Conflicting Interests
The author(s) declared no potential conflicts of interest with respect to the research, authorship, and/or publication of this article.
Funding
The author(s) received no financial support for the research, authorship, and/or publication of this article.