
Abstract
This research aimed to adapt and psychometrically examine the Multidimensional Perceived Autonomy Support Scale in Physical Education in the Spanish context. The participants were 560 (264 men and 296 women; Mage = 14.49, SDage = 1.05) physical education secondary school students. The results underpinned a 15-item three-factor correlated model, which was invariant across gender and age. The reliability analysis reflected an acceptable level of internal consistency and temporal stability for each factor. The structural equation modeling showed that perceived cognitive, procedural, and organizational autonomy support predicted positively and significantly basic psychological need satisfaction. The Multidimensional Perceived Autonomy Support Scale in Physical Education is a valid and reliable instrument to multidimensionally measure the secondary school students’ perception of autonomy support from physical education teachers in the Spanish context.
Keywords
The literature on physical education (PE) has well documented the importance attributed to PE teachers’ interpersonal style in providing psychological experiences among students (Sun et al., 2017). Particularly, autonomy support from the teacher has been positively associated with adaptive consequences for students in PE (Sun et al., 2017; Van den Berghe et al., 2014). One of the most commonly used theories to study autonomy support from PE teachers is self-determination theory (SDT; Ryan & Deci, 2017, 2019).
SDT (Ryan & Deci, 2017, 2019) conceptualized autonomy support as the idea of a person who, in a position of authority (e.g., teacher), adopts the subordinates’ (e.g., students) perspective, acknowledges their opinions and feelings, and provides them with relevant information, positive feedback, and opportunities to choose. From this theoretical foundation, Stefanou et al. (2004) developed a theoretical approach that discerns three clearly differentiated dimensions for autonomy support from PE teachers: cognitive dimension (i.e., promotion of the student ownership to express and argue his or her particular viewpoint in the teaching and learning process involved in PE), procedural dimension (i.e., promotion of the student ownership about the way to conduct the teaching and learning process), and organizational dimension (i.e., promotion of the student ownership about the classroom environment). SDT (Ryan & Deci, 2017; Vansteenkiste & Ryan, 2013) considers autonomy support as a social and contextual factor that performs a predominant influence on person’s motivation and behavior via the satisfaction of his or her basic psychological needs (BPN) for autonomy (i.e., desire of being causal agent), competence (i.e., desire of feeling effective in interactions with the environment), and relatedness (i.e., desire of feeling connected to others). Thus, previous research on PE has extensively shown the predictive association between autonomy support from PE teachers and BPN satisfaction among secondary school students in the PE context (Curran & Standage, 2017; Lochbaum & Jean-Noel, 2016; Sun et al., 2017; Van den Berghe et al., 2014).
Taking into consideration that students may interpret autonomy support from PE teachers in a differentiated way, it is not only enough to provide autonomy support for students, but it would also be essential to understand how students perceive autonomy support from their PE teacher (Aguado-Gómez et al., 2016). In Spain, although previous studies have widely shown promising results in explaining learning consequences related to PE in students, they have used unidimensional measures of the students’ perception of autonomy support from PE teachers such as the Spanish version (Granero-Gallegos et al., 2014) of the Learning Climate Questionnaire (Williams & Deci, 1996) adapted to PE or the Perceived Autonomy Support Scale for Exercise Settings (Hagger et al., 2007) in its Spanish version also adapted to PE (Moreno-Murcia et al., 2008). Whether the content of its items is, respectively, analyzed, these instruments only capture the cognitive element of autonomy support from PE teachers, ignoring its procedural and organizational dimensions. Thus, the inclusion of both dimensions into the measure of autonomy support from PE teachers may be useful given that it may provide a more comprehensive and holistic understanding of the motivational factors underlying the student’s optimal behavior and learning in PE classes (Stefanou et al., 2004).
To solve this limitation detected in research specializing in PE, Tilga et al. (2017) developed the Multidimensional Perceived Autonomy Support Scale in Physical Education (MD-PASS-PE) in an attempt to assess the three distinct dimensions of autonomy support from PE teachers theoretically proposed by Stefanou et al. (2004). In the validation work, Tilga et al. (2017) provided validity evidence based on internal structure for a 15-item three-factor correlated model (χ2/df = 1.96; Comparative Fit Index [CFI] = .98; Tucker-Lewis Index [TLI] = .98; root mean square error of approximation [RMSEA] = .041), which was invariant across gender and age. In addition, the authors gathered internal consistency evidence (ρ between .83 and .89) along with validity evidence based on relations to other variables through the predictive and significant relationship between the three dimensions of autonomy support from PE teachers and the student BPN satisfaction. The correlations among factors were high (r ranged from .77 to .90), specifically between cognitive and procedural autonomy support (r = .90). Nonetheless, it should be underlined that there was no evidence for the MD-PASS-PE temporal stability.
In addition to the classical confirmatory factor analysis (CFA) perspective used by Tilga et al. (2017) for the conceptualization of autonomy support from PE teachers, the new methodological approaches (e.g., bifactor model and exploratory structural equation modeling [ESEM] approach) might provide a better understanding of conceptual assumptions related to autonomy support and even to polish the asserts described by SDT in the context of the secondary school PE (Marsh et al., 2014; Morin et al., 2016; Rios & Wells, 2014). In particular, the bifactor model is a latent structure where each item loads on the general factor (i.e., autonomy support) and also may load on one of the three domain factors (i.e., cognitive, procedural, and organizational dimensions, respectively). ESEM approaches allow one to freely estimate all cross-loadings of items of latent factors so that each factor loads on target items but also loads on all nontarget items (Marsh et al., 2014). Currently, ESEM approaches have also been integrated with bifactor models in an even more comprehensive bifactor-ESEM framework (Morin et al., 2016). Previous research has found a better representation of the data for bifactor-ESEM approaches than CFA for the SDT-variables in the different life’s domains (Abós et al., 2018; Myers et al., 2014; Sánchez-Oliva et al., 2017). Thus, it would be useful to analyze whether the bifactor model and ESEM models would contribute to a deeper understanding of autonomy support from PE teachers than the three-factor CFA model in the Spanish context of the secondary school PE.
Therefore, the objective of this study was to adapt and examine the psychometric properties of the MD-PASS-PE with a sample of Spanish secondary school students. First, validity evidence based on internal structure for the MD-PASS-PE will be provided with the comparison of four hypothesized models (i.e., three-factor CFA model, three-factor ESEM model, bifactor model, and bifactor-ESEM model) to identify the best-fit model. In line with prior studies (Abós et al., 2018; Myers et al., 2014; Sánchez-Oliva et al., 2017), we hypothesized that the bifactor-ESEM model would be the model with the best fit to the data. Once the best-fit model was identified, the instrument’s measurement invariance across gender and age will be run. Second, reliability evidence will be given by means of an internal consistency analysis and temporal stability analysis. Third, validity evidence based on relation to other variables will be gathered via a structural equation modeling. In accordance with previous research (Curran & Standage, 2017; Lochbaum & Jean-Noel, 2016; Sun et al., 2017; Van den Berghe et al., 2014), we hypothesized that the students’ perception of cognitive, procedural, and organizational autonomy support from PE teachers would significantly and positively predict their BPN satisfaction.
Method
Participants
The participants were 560 (264 boys and 296 women) secondary school students, aged between 13 and 17 years old (Mage = 14.49, SDage = 1.05), who took PE. The students were enrolled in six public secondary schools from a city located in the southeast of Spain. All the students received two 60-min compulsory PE classes a week. These classes were taught by 12 different PE specialist teachers who self-reported to have obtained the Bachelor of Science in Physical Education and Sports and Professional Master of Education (i.e., Secondary Physical Education). More particularly, they self-reported a teaching experience between 5 and 21 years (Mexperience = 12.98, SDexperience = 2.44).
To examine the instrument’s temporal stability, the scale was completed twice in a time period of 14 days to an independent sample of 85 secondary school PE students (49 boys and 36 girls) between 14 and 16 years old (Mage = 15.11, SDage = 0.77). On the contrary, the convenient sampling technique was used to select the participants, for which the research team considered the collaboration previously maintained with the PE teachers from these secondary schools in other studies.
Instruments
Autonomy support in PE
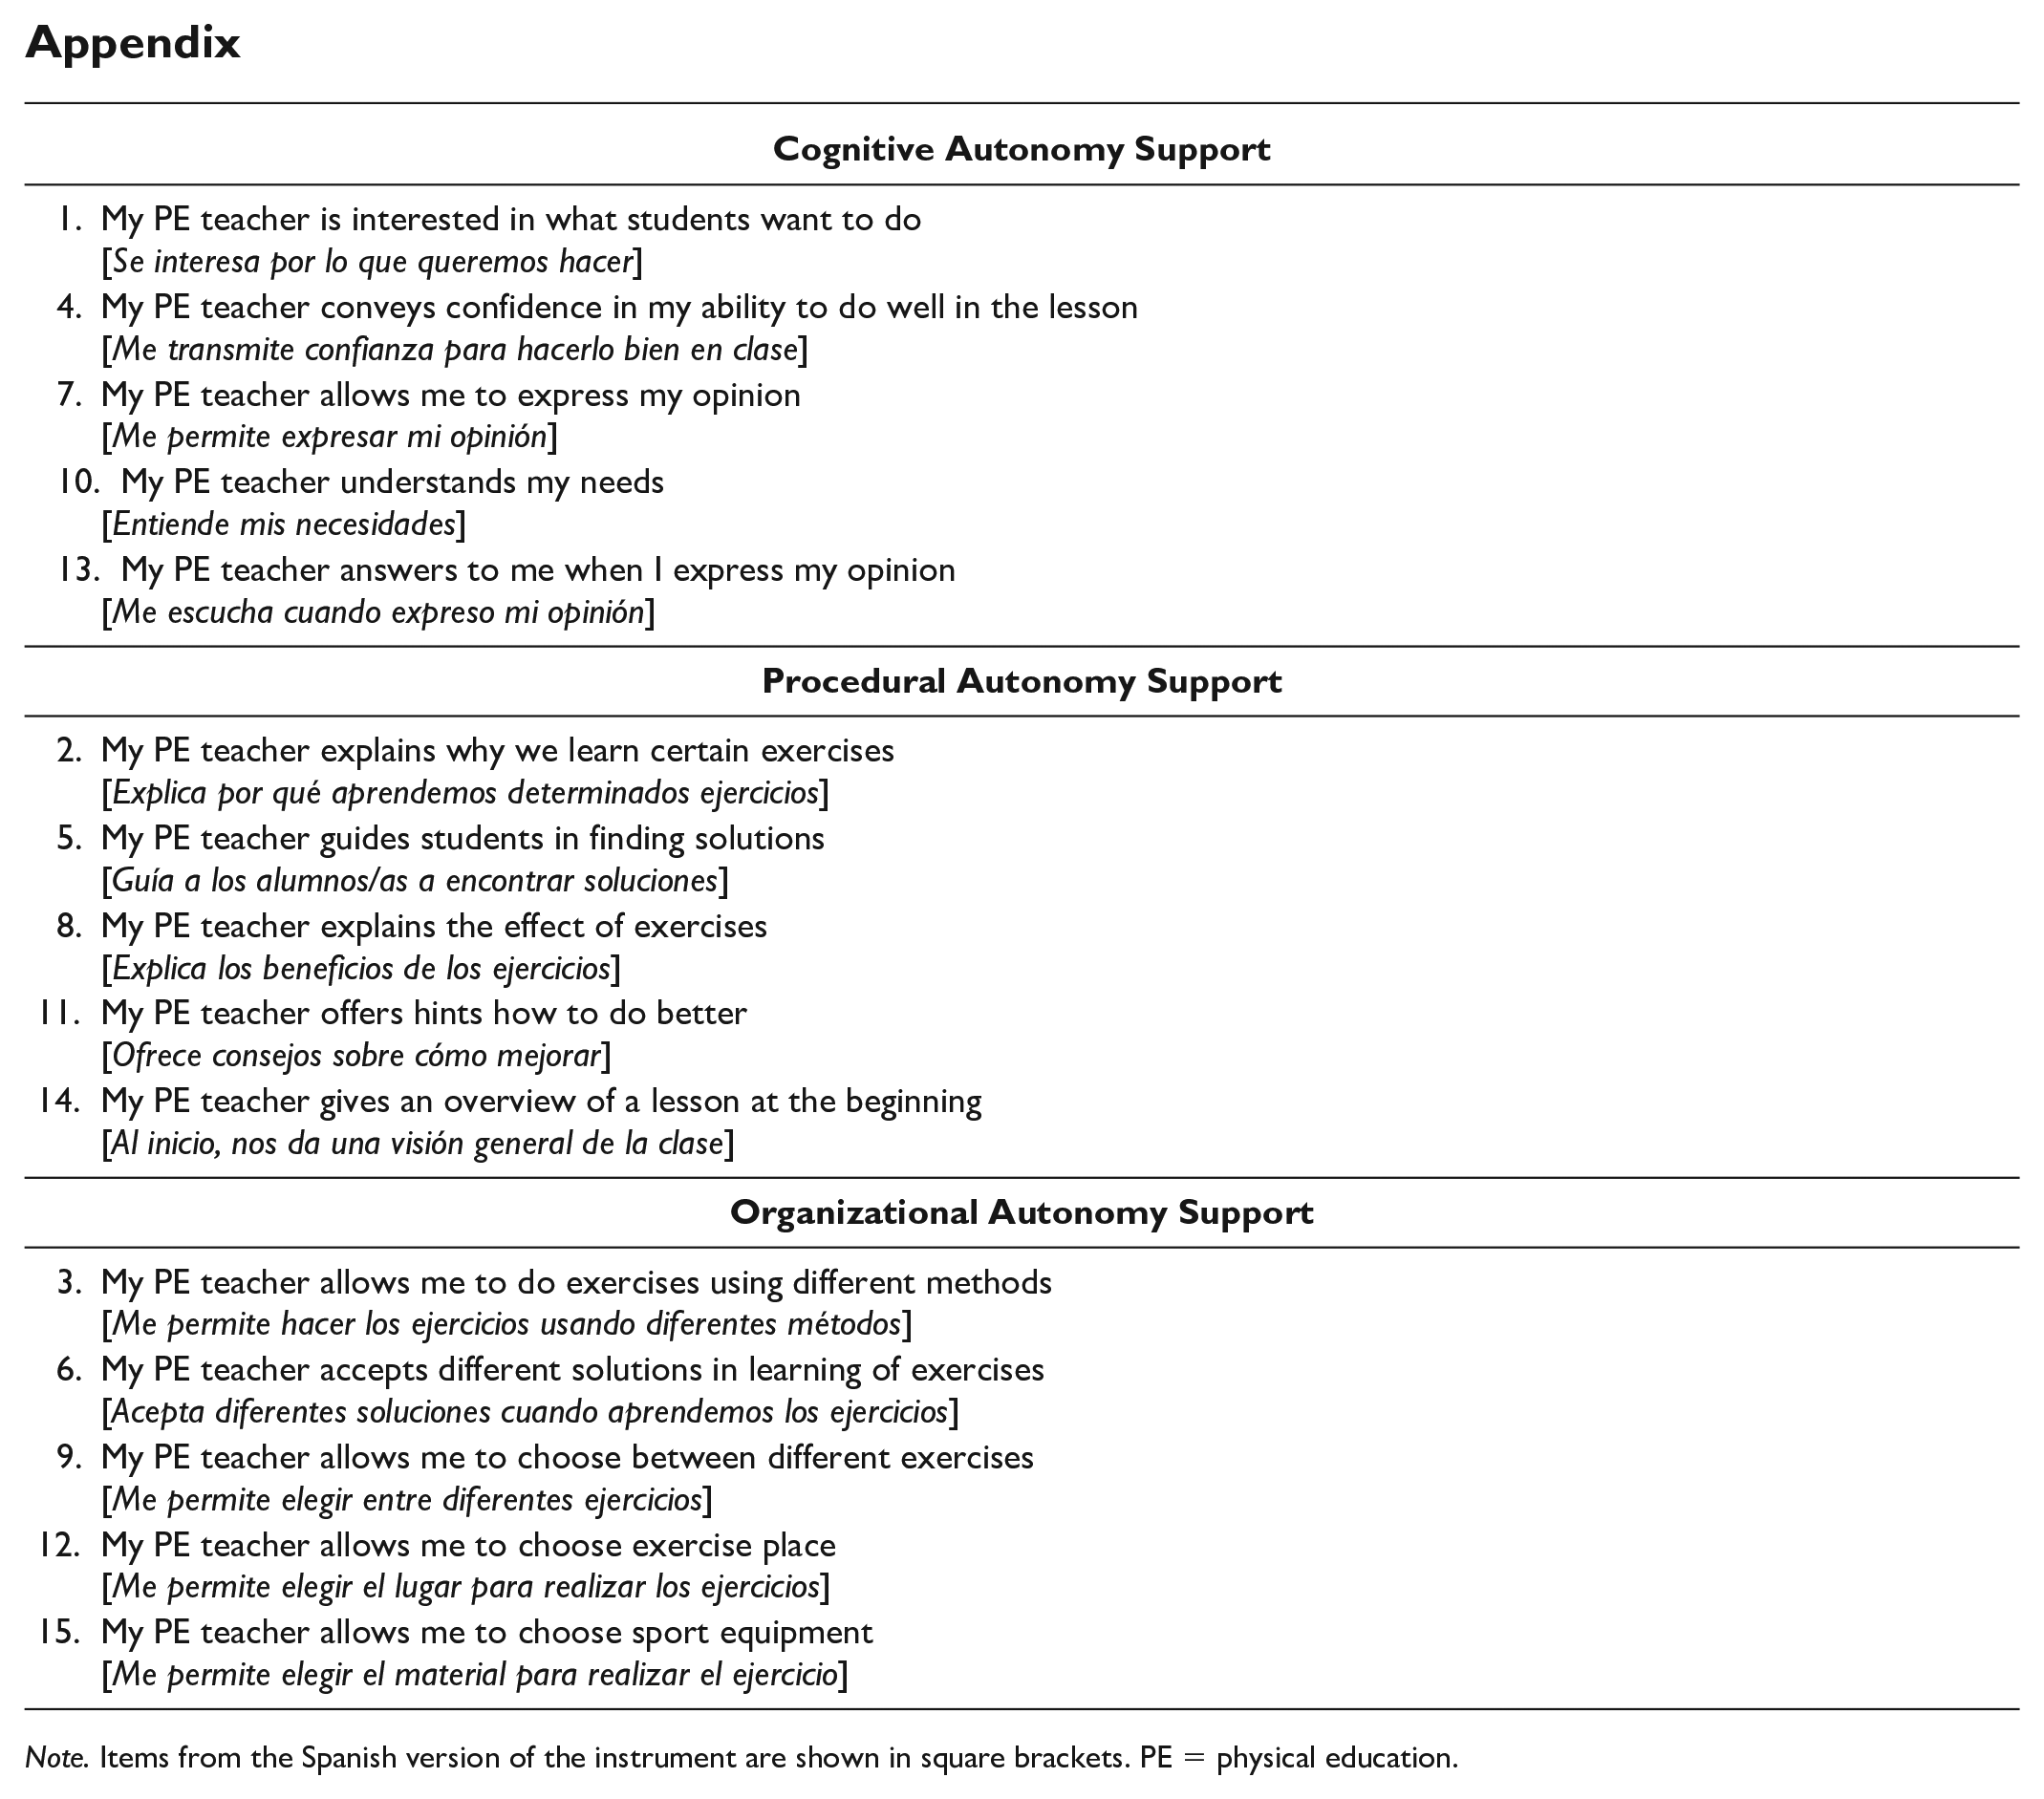
The Spanish version of the MD-PASS-PE (Tilga et al., 2017) was used (see Appendix). The instrument is preceded by the statement “My PE teacher. . . .” It is composed of 15 items grouped into five items per factor to measure cognitive, procedural, and organizational autonomy support. The response for each item is collected through a 7-point Likert-type scale, ranging from 1 (strongly disagree) to 7 (strongly agree). A high average score in each dimension would, respectively, indicate a high perception in terms of cognitive, procedural, and organizational autonomy support from PE teachers.
BPN satisfaction in PE
The Spanish version (Menéndez-Santurio & Fernández-Río, 2018) of the Basic Psychological Need in Physical Education Scale (Vlachopoulos et al., 2011) was used. The scale is preceded by the statement “In my PE classes . . . .” It consists of 12 items grouped into four items per factor to measure the satisfaction of the need for autonomy (e.g., “I feel that the way PE is taught is the way I would like to”), competence (e.g., “I feel I perform correctly even the tasks considered difficult by most of the children”), and relatedness (e.g., “I feel like I have a close bond with my classmates”). The response for each item is collected through a 7-point Likert-type scale, ranging from 1 (I don’t agree at all) to 7 (I completely agree). In this study, the analysis of internal consistency showed acceptable values for the satisfaction of the need for autonomy (α = .74, 95% confidence interval [CI] = [.70, .77]; ρ = .74, 95% CI = [.70, .77]; average variance extracted [AVE] = .51), competence (α = .80, 95% CI = [.74, .85]; ρ = .80, 95% CI = [.77., 85]; AVE = .59), and relatedness (α = .77, 95% CI = [.71, .81]; ρ = .78, 95% CI = [.70, .82]; AVE = .50). A high average score in each factor would, respectively, indicate a high students’ perception of satisfaction of each their BPN in PE.
Procedure
The authors obtained via email the authorization by Tilga et al. (2017) to make use of the MD-PASS-PE in the Spanish PE context. To conduct the instrument’s translation and adaptation process into the Spanish PE context, the strategies proposed by Bartram et al. (2018) were followed. First, the backward translation method was applied, which implied that two professional translators—with a 12-year expertise in issues related to SDT and PE—translated individually the scale from English into Spanish. Both translators held a consensus meeting to address the small discrepancies among the two versions and thus provide an agreed version. Subsequently, two new professional translators—with an 8-year expertise in issues related to SDT and PE—translated individually the Spanish agreed version into English. The two translators had a consensus meeting to provide the researchers an agreed version after tackling the slight differences among both versions. Continually, a new professional translator—with a 10-year expertise in issues related to SDT and PE—along with a member of the research team—PhD in PE, university professor, and advanced level of English—individually analyzed each item using the checklist for the quality of the translation/adaptation of items designed by Muñiz et al. (2013). Both ascertained the agreement and equivalence among the Spanish and English versions proposed after a meeting.
Second, four new experts—three university professors and a secondary school teacher, all of them PhD in PE and with an advanced level of English—analyzed the content of each item in accordance with its domain representation, relevance, and clarity through a 5-point Likert-type scale (Sireci & Faulkner-Bond, 2014). For the three dimensions required to study each item, Aiken’s V coefficient (Aiken, 1980) was estimated with the CIaiken software (Merino-Soto & Livia-Segovia, 2009). Aiken’s V coefficient is considered to be acceptable when the lower bound of its CI at 95% (95% CI) is higher than .70 (Merino-Soto & Livia-Segovia, 2009). With respect to domain representation, Aiken’s V values were between .80 (95% CI = [.70, .90]) for Item 15 and .95 (95% CI = [.90, 1.00]) for Item 4. In relation to relevance of each item, Aiken’s V values ranged from 90 (95% CI = [.85, .99]) for Item 14 to 1.00 (95% CI = [.85, 1.00]) for Item 6. In reference to clarity, Aiken’s V values were between .85 (95% CI = [.70, .90]) for Item 13 and 1.00 (95% CI = [.85, 1.00]) for Item 7.
Third, a first pilot test was conducted with 14 secondary school students who found two problems in the content of the items. The first of them was detected by eight (57.14%) students in relation to Item 2 (i.e., My PE teacher explains why we learn certain exercises, in English [Explica porqué aprendemos ciertos ejercicios, in Spanish]). In particular, the students claimed that they did not know the meaning of “certain” (in English [ciertos, in Spanish]). The second problem was identified by 11 (78.57%) students in Item 13 (i.e., My PE teacher answers to me when I express my opinion, in English [Me responde cuando expreso mi opinion, in Spanish]) because they did not know the specific way (i.e., active, passive, verbal, nonverbal) in which the teacher responds to their comments. With the identification of these problems and considering the alternative comments raised by these students, the researcher team unanimously proceeded to propose a new drafting for Item 2 (i.e., My PE teacher explains why we learn determined exercises, in English [Explica porqué aprendemos determinados ejercicios, in Spanish]) and Item 13 (i.e., My PE teacher listens to me when I express my opinion, in English [Me escucha cuando expreso mi opinion, in Spanish]). Thereupon, a second pilot test was carried out with 10 secondary school students who did not identify problems in the content of each one of the 15 items.
Once the instrument’s translation and adaptation processes were completed, the researchers contacted PE teachers to require their collaboration. Data collection was carried out by the researchers, who explained to the students about the voluntary and anonymous character of their participation in this study. Similarly, researchers were available for the students to solve the doubts arising during the administration of the questionnaire. This was administrated in a classroom environment. This research has the informed consent from the students’ parents or legal guardians who took part in this study and the approval of the Ethics Committee on Human Research of the corresponding university (162/CEIH/2016)
Data Analysis
To provide validity evidence based on internal structure, the factor structure of the MD-PASS-PE was examined comparing four hypothesized models: three-factor CFA, three-factor ESEM, bifactor-CFA, and bifactor-ESEM. To accomplish the purpose, the maximum likelihood method was applied together with the bootstrapping procedure with 5,000 iterations due to the violation of the assumption of multivariate normality (Mardia’s coefficient = 85.33, p < .01; Mardia’s coefficient = 85.33, p < .01; Mardia’s coefficient = 85.33, p < .01; Mardia’s coefficient = 85.33, p < .01, respectively) (Kline, 2015).
The goodness of fit was judged by a series of fit indexes: ratio between chi-square and its degree of freedom (χ2/df), CFI, TLI, standardized root mean square residual (SRMR), RMSEA with its CI at 90% (90% CI), the Akaike Information Criterion (AIC), and the Bayes Information Criterion (BIC). Hu and Bentler (1999) propose values less than 5 for the χ2/df statistic, higher than .95 for CFI and TLI, and below .08 and .06 for SRMR and RMSEA as representative of a good fit. However, West et al. (2012) hold that RMSEA would be indicative of a reasonable fit of the factor model with data, whether the upper bound of its 90% CI does not exceed .10. AIC and BIC are commonly utilized to compare the fit of rival models, where the model with the lowest AIC and BIC values would represent the most parsimonious model and, therefore, the best-fit model (Kline, 2015). The standardized residual covariances are considered to be acceptable with values less than 2.58 in its absolute term, whereas the standardized regression weights with values higher than .40 (Hair et al., 2018). The correlations among factors show an adequate level of conceptual divergence when the upper bound of its 95% CI does not exceed the unit as an absolute value (Anderson & Gerbing, 1988).
Two multigroup factor analyses to, respectively, test gender and age invariance were performed following the methodological sequence described by Sánchez-Oliva et al. (2017). The assumption of invariance is, respectively, supported with statistic differences below .010 and .015 in CFI and RMSEA values among each two increasingly constrained models (Chen, 2007). To conduct the multigroup factor analysis across age, two groups were created using the median. The first group was composed of 287 (139 boys and 148 women) students, aged between 13 and 14 years old (Mage= 13.69, SDage = 0.46), whereas the second group was composed of 273 (125 boys and 148 girls) students, aged between 15 and 17 years old (Mage = 15.50, SDage = 0.61).
To analyze the instrument’s internal consistency, Cronbach’s alpha and Raykov’s composite reliability coefficient along with its 95% CI were estimated. Both coefficients are adequate with values above .70 (Viladrich et al., 2017). Moreover, AVE was also calculated, which is appropriate with values higher than .50 (Hair et al., 2018). To examine the instrument’s temporal stability, the intraclass correlation coefficient (ICC) along with its 95% CI was estimated based on the mean of two measurements, absolute agreement, two-way mixed-effects model (Koo & Li, 2016). This coefficient shows a good level of stability when the lower bound of its 95% CI is higher than .75 (Koo & Li, 2016).
To gather validity evidence based on relation to other variables, a structural equation modeling was effected in accordance with the two-step proposal by Wang et al. (2017). The first step examined the robustness of a measurement model through the analysis of the bidirectional relationships among the variables integrating the theoretically hypothesized factor model. The second step tested the predictive effect of cognitive, procedural, and organizational autonomy support on BPN satisfaction. Given the absence of multivariate normality (Mardia’s coefficient = 87.09, p < .01), the maximum likelihood method together with the bootstrapping technique with 5,000 iterations was selected. Finally, descriptive statistics and Pearson’s bivariate correlations for each variable under study were estimated. Data were statistically analyzed with IBM SPSS v. 23 and SPSS AMOS v.23.
Results
Structural Analysis
Table 1 shows the goodness-of-fit measures obtained for the four factor models tested in relation to the MD-PASS-PE. Although a good fit was, respectively, obtained for the three-factor ESEM model, bifactor-ESEM model, and bifactor-CFA model, the analysis of standardized regression weights found some misspecifications in its internal structure for each one of the four models tested (see Table 2)
Fit Indices Obtained in the Factor Models Tested for the MD-PASS-PE.

Note. MD-PASS-PE = Multidimensional Perceived Autonomy Support Scale in Physical Education; CFI = Comparative Fit Index; TLI = Tucker–Lewis Index; SRMR = standardized root mean square residual; RMSEA = root mean square error of approximation; CI = confidence interval; AIC = Akaike Information Criterion; BIC = Bayes Information Criterion.
p < .001.
Standardized Regression Weights and Error Variances of Each Item for the Four Factor Models Tested.

Note. CFA = confirmatory factor analysis; ESEM = exploratory structural equation modeling; CAS = cognitive autonomy support; PAS = procedural autonomy support; OAS = organizational autonomy support; GASF = global autonomy support factor; λ = standardized regression weight; δ = error variance.
Particularly, the three-factor ESEM model displayed standardized regression weights above .32 for Item 1, Item 8, Item 9, Item 12, Item 13, and Item 14, in other factors. There was also a standardized residual covariance value above 2.58 in its absolute term for the pairs Items 2 and 10 (2.73). The bifactor-ESEM model shows standardized regression weights higher than .32 for each one of the 15 items, in other factors. The bifactor-CFA model obtained standardized regression weights lower than .40 for Item 1 and Item 13 in the cognitive autonomy support factor; Item 5, Item 11, and Item 14 in the procedural autonomy support factor; and Item 3 and Item 6 in the organizational autonomy support factor. In addition, standardized residual covariance values above 2.58 in its absolute term were found for the pairs Items 13 and 15 (3.29), and Items 14 and 15 (3.05).
Nonetheless, the three-factor CFA model obtained a good fit together with the lowest AIC and BIC values, making it the most parsimonious model. No misspecifications were also found for this model, such that the standardized residual covariance values ranged from −2.34 to 2.26, suggesting the absence of statistically significant discrepancies between the theoretically hypothesized model and the observed data. Table 2 shows that standardized regression weight values ranged from .56 to .85, which reached the level of statistical significance. The correlation between cognitive and procedural autonomy support factors was r = .94 (95% CI = [.90, .97]), between cognitive and organizational autonomy support factors was r = .91 (95% CI = [.85, .95), and between procedural and organization autonomy factors was r = .76 (95% CI = [.67, .83]). Given that the upper bound of the 95% CI for each of the three correlations did not exceed 1.00, the conceptual divergence among the three factors was underpinned.
Overall, evidence suggests that the three-factor CFA model obtained better psychometric performance than the other three models tested for the MD-PASS-PE. Therefore, the three-factor CFA model was used for the remaining psychometric analyses.
Invariance Analysis
Table 3, respectively, reflects differences in CFI and RMSEA values lower than .010 and .015 among the successive increasingly constrained models for both multigroup factor analyses. Therefore, the null hypothesis of measurement invariance across gender and age cannot be rejected.
Multigroup Factor Analysis.
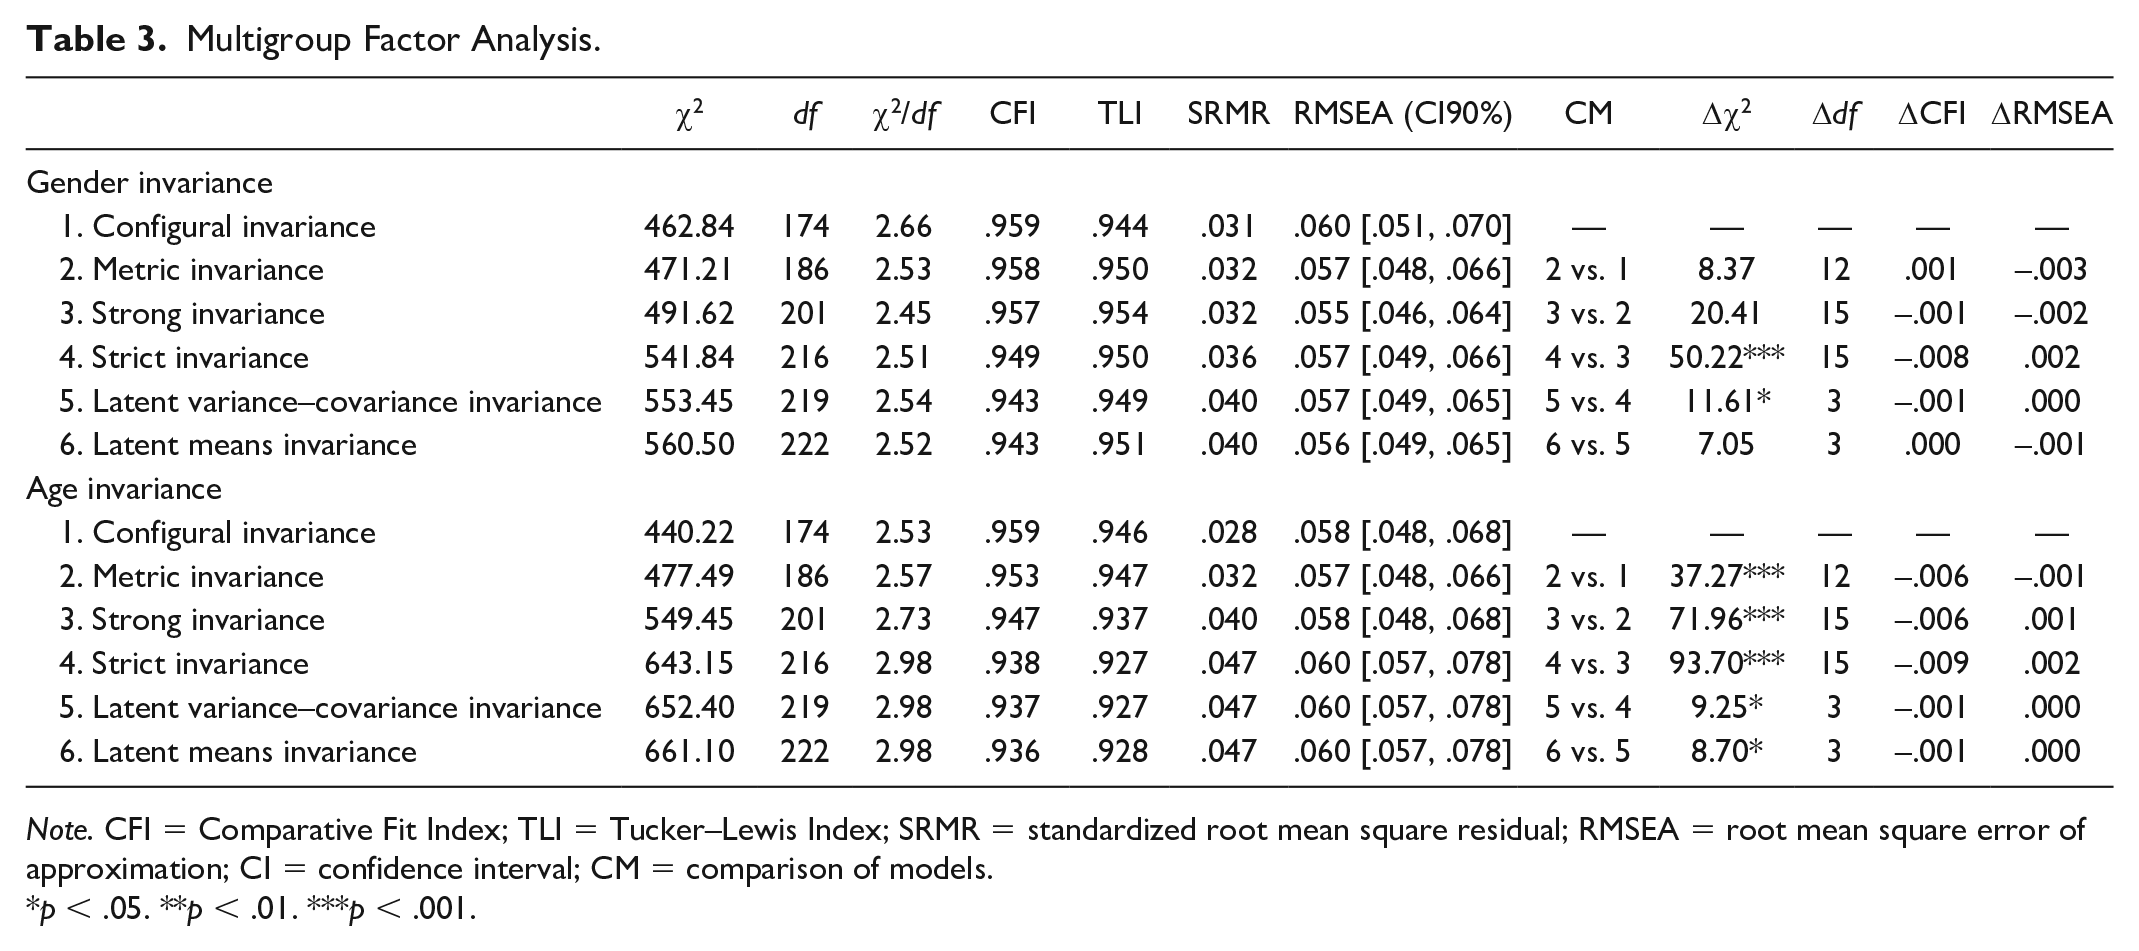
Note. CFI = Comparative Fit Index; TLI = Tucker–Lewis Index; SRMR = standardized root mean square residual; RMSEA = root mean square error of approximation; CI = confidence interval; CM = comparison of models.
p < .05. **p < .01. ***p < .001.
Reliability Analysis
The analysis of internal consistency showed adequate values in terms of Cronbach’s alpha, Raykov’s composite reliability, and AVE for cognitive autonomy support (α = .86, 95% CI = [.84, .88]; ρ = .87, 95% CI = [.83, .90]; AVE = .57), procedural autonomy support (α = .87, 95% CI = [.85, .89]; ρ = .87, 95% CI = [.80, .88]; AVE = .57), and organizational autonomy support (α = .85, 95% CI = [.83, .87]; ρ = .85, 95% CI = [.77, .86]; AVE = .53).
The analysis of temporal stability revealed ICC values of 87 (95% CI = [.82, .91]) for cognitive autonomy support,.82 (95% CI = [.77, .87]) for procedural autonomy support, and .86 (95% CI = [.76, .96]) for organizational autonomy support.
Structural Analysis
A structural equation modeling was performed following the two-step approach by Wang et al. (2017). The first step, measurement model, reflected an appropriate fit: χ2(71, N = 560) = 212.75, p < .001; χ2/df = 3.00; CFI = .96; TLI = .95; SRMR = .040; RMSEA = .066, 90% CI = [.056, .076]. The standardized regression weights were statistically significant (p < .001), ranged from .43 to .89. The correlations among factors ranged between .49 and .94. As a whole, the results endorsed the robustness of the measurement model.
The second step, theoretically hypothesized model, analyzed the predictive effect of the three dimensions of autonomy support on need satisfaction. The fit indexes were acceptable: χ2(71, N = 560) = 211.58, p < .001; χ2/df = 2.98; CFI = .96; TLI = .95; SRMR = .039; RMSEA = .064, 90% CI = [.055, .074]. Figure 1 shows that cognitive (β = .79, p < .001), procedural (β = .50, p < .001), and organizational (β = .29, p < .001) autonomy support from PE teachers positively and significantly predicted BPN satisfaction. The total variance explained was 34%.
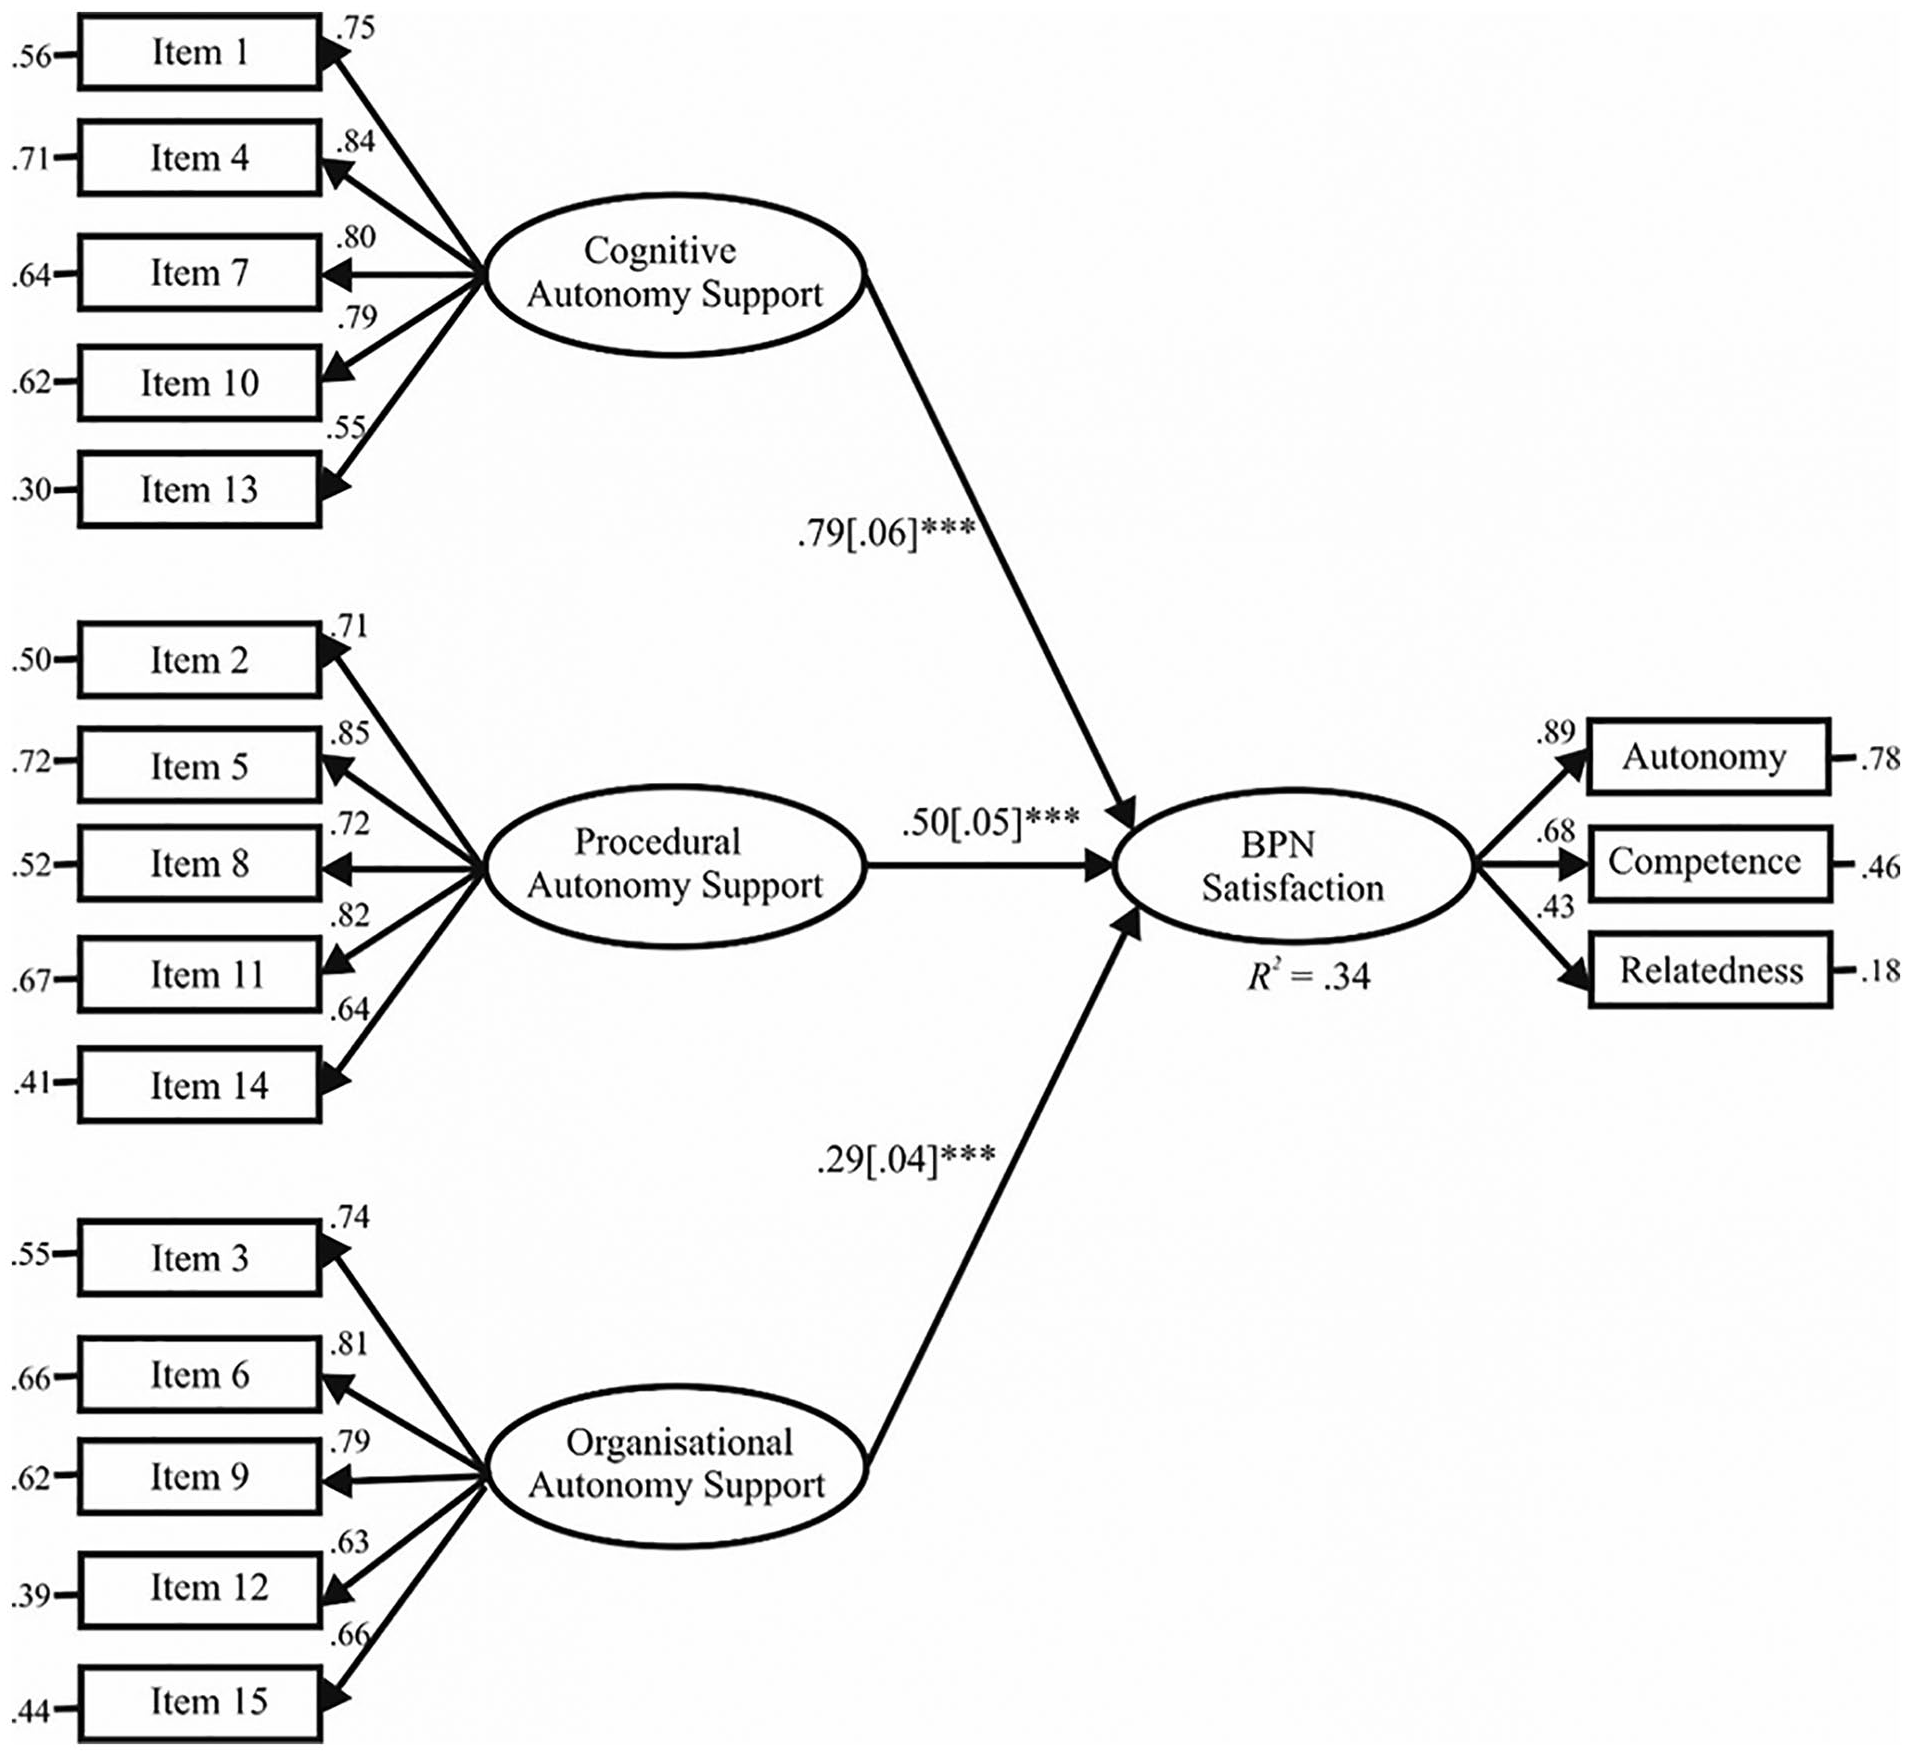
Structural equation modeling to predict need satisfaction from the three dimensions of autonomy support from physical education teachers.
Descriptive Statistics and Pearson’s Bivariate Correlations Among Variables
Table 4 shows that each variable of interest obtained average scores above the midpoint of its respective measurement scale. The Pearson’s bivariate correlation analysis revealed positive and significant correlations among each one of the three dimensions of autonomy support from PE teachers and the satisfaction of each BPN.
Descriptive Statistics and Pearson’s Bivariate Correlations Among Variables.

Note. γ1 = skewness; γ2 = kurtosis.
p < .05. **p < .01. ***p < .001.
Discussion
The objective of this study was to adapt and examine the psychometric properties of the MD-PASS-PE with Spanish secondary school students who took PE. The results from this work supported the use of the three-factor CFA model for the MD-PASS-PE in the Spanish context of the secondary school PE. In addition, the findings gather evidence of measurement invariance across gender and age, internal consistency, and temporal stability. Validity evidence based on the relation to other variables was also provided. Hence, the MD-PASS-PE could be considered as a valid and reliable instrument to measure the students’ perception of the cognitive, procedural, and organizational dimensions of autonomy support from PE teachers in the Spanish context of the secondary school PE.
The results referring to validity evidence based on internal structure supported the use of the three-factor CFA model instead of the bifactor-CFA model and the two ESEM models for the MD-PASS-PE. These findings are not line with prior works that have widely shown better psychometric performance of the ESEM models with respect to the improved goodness of fit for the other SDT-variables in the different life’s domains (Abós et al., 2018; Myers et al., 2014; Sánchez-Oliva et al., 2017). Further research is needed to determine whether these different results are because of the specific context of the secondary school PE.
The results that emerged from the three-factor CFA model were similar to those reported by Tilga et al. (2017) for the original version of the MD-PASS-PE. Furthermore, these findings provide an empirical support for the theoretical approach outlined by Stefanou et al. (2004) in understanding autonomy support from PE teachers from a multidimensional perspective with the conceptualization and operationalization of its cognitive, procedural, and organizational dimensions. More specifically, the Pearson’s bivariate correlations that emerged from CFA endorsed the conceptual divergence among the three dimensions conceptualized for autonomy support. In particular, the correlations between cognitive, procedural, and organizational autonomy support from PE teachers are similar to those obtained in the original version of the MD-PASS-PE (Tilga et al., 2017), in which although cognitive and procedural autonomy support obtained the highest value (r = .94), its 95% CI did not exceed the unit as an absolute value. This would likely suggest that when the students perceive that their PE teacher was providing behaviors aiming to promote the debate and rationale of their opinions along with informative feedback (cognitive autonomy support), this was being accompanied with a perception of behaviors fostering the students to have the opportunity to chose the way of displaying motor competence and giving reasons about the manner of developing a particular activity (procedural autonomy support). Moreover, the analysis of standardized regression weights showed that all of them were high than .50 and reached the level of statistical significance, suggesting that the theoretical relationship of each item to its previously defined factor was psychometrically supported. This would consequently imply an adequate level of representativity of each item in measuring the specific autonomy support domain for which it was initially proposed.
The findings derived from the two multigroup factor analyses provided evidence related to the instrument’s invariant character across gender and age, which is in line with the results obtained by Tilga et al. (2017). Specifically, these results are considered to be useful given that they sustain the use of the MD-PASS-PE in examining the possible differences with respect to the perception of the three dimensions of autonomy support from PE teachers between boys and girls with different ages in the context of the secondary school of PE. The results of the reliability analysis displayed suitable level of internal consistency for each factor of the MD-PASS-PE, which is consistent with the findings reported by Tilga et al. (2017). Furthermore, the estimation of AVE with values above .50 has provided a new evidence to underpin the instrument’s internal consistency. On the contrary, this work provided evidence for the temporal stability of the MD-PASS-PE for the first time through acceptable ICC values for each one of the three dimensions of autonomy support from PE teachers proposed by Tilga et al. (2017).
The results derived from structural equation modeling provided validity evidence based on relation to other variables for the MD-PASS-PE. These findings are consistent with the theoretical foundations proposed by SDT (Ryan & Deci, 2017, 2019; Vansteenkiste & Ryan, 2013), as well as the results obtained in previous studies with PE secondary school students (Curran & Standage, 2017; Lochbaum & Jean-Noel, 2016; Sun et al., 2017; Tilga et al., 2019; Van den Berghe et al., 2014), in the sense that the three dimensions of autonomy support from PE teachers positively and significantly predicted BPN satisfaction in students. These students likely felt prone to satisfy their three BPN in PE class when they perceived the teacher to generate a learning environment that promoted behaviors oriented to argumentation and rationale of their viewpoints, as well as reception of informative feedbacks (cognitive autonomy support), along with behaviors aiming to provide opportunities to choose the way of displaying competence and the search of own solutions (procedural autonomy support), in addition to giving opportunities to choose the members of the group for the instructional activities, the way of assessment, deadline for an activity, as well as the establishment of agreed rules for classroom (organizational autonomy support). Furthermore, these findings underline the perception of cognitive autonomy support as the most influencing dimension on student BPN satisfaction, which is in congruence with the premises sustained by Stefanou et al. (2004), who consider this dimension as the most determining factor of the student’s learning and commitment.
Practical Applications and Implications
The MD-PASS-PE will allow one to more comprehensively and holistically analyze—through the incorporation of the measure of the procedural and organizational dimensions of autonomy support—the effect of the perception of interpersonal style adopted by PE teachers on different mediator variables (BPN perception and behavioral regulation) and cognitive, behavioral, and affective consequences displayed by students during their teaching and learning process that takes place in the Spanish context of the secondary school PE. Furthermore, this fact would enable the development and implementation of instructional strategies more adapted to the motivational needs demanded by students, which may suppose an advance with respect to the enhancement of the quality not only of the teaching and learning process involved in PE but also of the initial and continuous education programs for PE teachers.
Limitations
From the assumption that the development of an instrument must be understood as a continuous process given the complexity of human thinking, a series of limitations should be considered. First, the cross-sectional design adopted in this work does not allow one to establish causal relationships among the different variables under study. Future research could implement longitudinal or experimental designs to elucidate the effects of the three perceived dimensions of autonomy support from PE teachers on mediator variables (e.g., BPN satisfaction and behavioral regulation) and cognitive, behavioral, and affective consequences displayed by students in the context of the secondary school PE. Second, the convenient sampling technique used in this study makes one cautiously interpret the results obtained, which makes us impossible to generalize the results to the population as a whole. New studies are needed to analyze the psychometric properties of the MD-PASS-PE in other educational levels (e.g., primary school) to extend validity and reliability evidence for the instrument. Third, the absence of use of a second scale measuring the student’s perception of autonomy support from PE teachers in this research has made it impossible to gather incremental validity evidence for the MD-PASS-PE in the Spanish context. Future studies should tackle this point to extend evidence supporting validity of this measurement instrument in the Spanish context of the secondary school PE. Fourth, the moderate level of internal consistency of the variables used as a criterion, particularly of the relatedness need satisfaction factor, constitutes a serious concern for the results that emerged from the structural equation modeling. In this sense, future studies may take into consideration other criterion variables to test the predictive utility of the MD-PASS-PE.
Conclusion
This research provides evidence that makes us consider the MD-PASS-PE as a valid and reliable instrument to measure the student’s perceptions of cognitive, procedural, and organizational dimensions of autonomy support from PE teachers in the Spanish context of the secondary school PE. Thus, the use of the Spanish version of the MD-PASS-PE is expected to promote studies to provide a deeper understanding of the role played by the differentiated strategies of the students’ perception of autonomy support styles adopted by PE teachers on their motivational process that takes place in the context of the secondary school PE.
Footnotes
Appendix
|
|
| 1. My PE teacher is interested in what students want to do [Se interesa por lo que queremos hacer] |
| 4. My PE teacher conveys confidence in my ability to do well in the lesson [Me transmite confianza para hacerlo bien en clase] |
| 7. My PE teacher allows me to express my opinion [Me permite expresar mi opinión] |
| 10. My PE teacher understands my needs [Entiende mis necesidades] |
| 13. My PE teacher answers to me when I express my opinion [Me escucha cuando expreso mi opinión] |
|
|
| 2. My PE teacher explains why we learn certain exercises [Explica por qué aprendemos determinados ejercicios] |
| 5. My PE teacher guides students in finding solutions [Guía a los alumnos/as a encontrar soluciones] |
| 8. My PE teacher explains the effect of exercises [Explica los beneficios de los ejercicios] |
| 11. My PE teacher offers hints how to do better [Ofrece consejos sobre cómo mejorar] |
| 14. My PE teacher gives an overview of a lesson at the beginning [Al inicio, nos da una visión general de la clase] |
|
|
| 3. My PE teacher allows me to do exercises using different methods [Me permite hacer los ejercicios usando diferentes métodos] |
| 6. My PE teacher accepts different solutions in learning of exercises [Acepta diferentes soluciones cuando aprendemos los ejercicios] |
| 9. My PE teacher allows me to choose between different exercises [Me permite elegir entre diferentes ejercicios] |
| 12. My PE teacher allows me to choose exercise place [Me permite elegir el lugar para realizar los ejercicios] |
| 15. My PE teacher allows me to choose sport equipment [Me permite elegir el material para realizar el ejercicio] |
Note. Items from the Spanish version of the instrument are shown in square brackets. PE = physical education.
Declaration of Conflicting Interests
The author(s) declared no potential conflicts of interest with respect to the research, authorship, and/or publication of this article.
Funding
The author(s) received no financial support for the research, authorship, and/or publication of this article.