
Abstract
This article detects the existence of bubbles in the Chinese art market and investigates when the bubbles originate and crash. We utilize the generalized supremum augmented Dickey–Fuller (ADF) test to detect explosive behavior in the Chinese art market. The empirical results indicate that there are two bubbles in the Chinese art market that happened in the periods from 2004 to 2005 and 2010 to 2011. The main reasons are the financialization of artworks, the speculation of investment institution, and the fluctuation of macroeconomics in China. Our findings are in agreement with the bubble model improved by Gürkaynak considering that asset price can be decomposed to bubbles and fundamental parts. Therefore, to favor the Chinese art market price stabilization, the regulators from this market should identify bubbles to notice their evolutions. The authorities should also manage the expectations of the public and reduce speculative behavior.
Introduction
This article investigates the existence of bubbles in the formation and evolution of the Chinese art market. In recent decades, a boom in this market not only provides an alternative investment option for investors all around the world, but it also serves as an interesting area for art investment (Shi et al., 2018). In view of the state of the global economy and finance, the fine art auction market has demonstrated a level of maturity perfectly commensurate with other alternative investment asset classes. The total auction value for fine art in 2017 amounted to $14.9 billion, which marks an increase of 19.78% than in 2016 and has grown 456% than that 20 years ago (Art Market Annual Report, 2017). The report also notes that a total of 280,080 fine art pieces have been auctioned in China, with the auction amount being $5.1 billion which is also an increase of 5.44% than that in 2016 and accounting for 34% of the world’s total value. At the same time, the high transaction prices in the Chinese art market frequently astonished investors around the world. One of the notable bids is Qi Baishi’s Twelve Landscape Screens that reached a record of $141 million, creating the world’s most expensive Chinese art record. Also, from Qi Baishi’s painting, his Eagle Standing on Pine Tree; Four-Character Couplet in Seal Script was sold at the price of $65 million in 2011. Yet it was only valued at $1.8 million 6 years earlier. Large increases in asset price may contain a considerable speculative component and this component is usually motivated by investors, which may potentially signify bubbles (Dale et al., 2005). Moreover, bubbles are usually accompanied by huge fluctuations in prices, which produces a negative impact on the development of the art market. Therefore, this article investigates the reasons behind art market price bubbles and provides corresponding policies for this market.
Following more than 20 years of rapid development, the Chinese art market has become an important emerging art market. The history of artwork transactions in China can date back more than a thousand year (Chen, 2013) and it has become one of the major global markets in terms of transaction value in recent years. In contrast to the world art market, the Chinese art market possesses some unique features. First, it is dominated by public auction while art galleries grow slowly. In comparison with public auction houses, most of the galleries in China are a small-sized private business with weak capital strength. Due to this weakness, these galleries are not capable of fostering young artists. Second, a great number of the art auction houses are state owned or have a state-backed connection. For instance, Beijing Poly is affiliated to a state-owned business that is operated by the central government, which means that the art auction houses have bureaucratic culture and this may lead to inefficiency in the art market. Third, the Chinese art market is dominated by Fine Chinese Paintings and Calligraphy (FCPC), Oil Paintings and Contemporary Art (OPCA) and Fine Chinese Ceramics and Miscellaneous Collectibles (FCCMC), which are much different from those in the foreign art markets. Schulze (1999) notes that people consume more art from nearby countries or domestics because they identify with those cultures. According to the Chinese Art Auction Market (2017), the FCPC, OPCA, and FCCMC accounted for 93.7% of total turnovers in 2017, whereas the other parts account for only 6.3%. Thus, we focus on these three parts to represent the development of the Chinese art market in this study. Different from the foreign art markets, these features make the Chinese art market to be a particularly interesting case for the analysis.
In terms of detecting the “bubble” phenomena, the existing studies have used different techniques to investigate possible bubbles (Froot & Obstfeld, 1991; Jarrow, 2016; West, 1987; Zhao et al., 2018). For instance, West (1987) utilizes the two-step test to detect speculative bubbles in the U.S. stock market. Zhao et al. (2018) apply the Frankel–Lee (Frankel & Lee, 1998) model and the Kim et al. (2013) model to measure the intrinsic value of China’s Internet-based finance stocks. Then they use differences between stock prices and the calculated intrinsic value to evaluate price bubbles. However, it should be noticed that the majority of these methods have limited power in detecting periodically collapsing bubbles. Compared with the methodologies above, Homm and Breitung (2012) indicate that Phillips et al. (2012) test is an effective way of detecting periodically cyclical crashing behavior better than other recursive methods. Therefore, Phillips et al. (2012) test might be an effective method to detect bubbles in the Chinese art market.
The contributions are made by this article as follows: First, the analysis of the financial angle of the Chinese art market is still in its infancy, and there is only scant research in this field, such as “bubble” phenomena. As the art market in China has become a highly attractive source of investment for local (and foreign) investors, it is essential to probe whether growing prices and profit margins in this market are short-lived or not. Our findings indicate that bubbles do exist in the Chinese art market and the increasing prices in this market are short-lived. Accordingly, investors rushing into this market should be careful while placing their funds. Second, this article attempts to reveal the reasons behind the bubble in emerging art markets, and here especially in China it has not been examined in previously. To the best of our knowledge, it is one of the first studies to consider bubble phenomena from an emerging art market perspective. In addition, this article applies the methods of the generalized supremum augmented Dickey–Fuller (GSADF) test, which was proposed by Phillips et al. (2012, 2015), to find the duration of bubbles in the Chinese art market. This algorithm can be applied to any frequency data to examine the presence of bubbles, whereas the other approaches rely on the subjective judgment of the deviations from the fundamentals or from moderate states.
The remainder of this article is organized as follows. Section “Literature Review” introduces the literature review. Section “Present Value Model and Methodology” explains the present value model and methodology. Section “Data” describes the corresponding data. Section “Empirical Results” discusses the empirical results. Finally, Section “Conclusion” concludes this article.
Literature Review
The existing studies have analyzed the art market from different angles. The first strand of the literature has concentrated on art valuation. Hansmann and Kraakman (2002) note that artworks are often prized for their social and political value. Hutter and Shusterman (2006) find that multiple forms of value can coexist in the same artwork, and the more the varieties of value that are included in a single work, the more the economic value increase. Murphy (2009) claims that the artwork’s value is based on the consensus of different observers, rather than on any objective standard. In particular, Karpik (2010) points out that the art market should be equipped with judgment devices—such as labels, brands, and critics—to provide investors with the value of the artwork. Dümcke and Matassa (2012) state that the actual price of the artwork depends on how much an individual is willing to pay (WTP) and the determined collector of a particular type of artwork can push the price beyond reasonable expectations. Moreover, the valuation of artworks also has received considerable attention from economists within the context of the asset pricing theory and the investment properties (see, for example, Baumol, 1986; Pesando, 1993; Stein, 1977, among others). Hodgson and Vorkink (2004) argue that the part of the value of artworks can be considered as the discounted value of the total price that potential future owners might pay in exchange for the consumption from the artwork.
The second strand of the literature has paid attention to the returns of art investments. Stein (1977) finds that there is a nominal return of 10.5% on paintings in the United States and the United Kingdom, whereas stocks had an annual nominal return of 14.3% over the same period. Baumol (1986) notes that when compared with returns on risk-free assets, paintings had a lower return. Different from previous findings, Goetzmann (1993) indicates that the returns of art investments have an annual appreciation of 17.5%, which is higher than the returns of the U.K. equities (4.9%) for the same period. Mei and Moses (2002) report that the returns on artworks are higher than those on fixed-income assets and it is similar to the returns on equities. Mei and Moses (2005) further find that the price estimates of the auction houses are biased upward with an impact on investors which is similar to stock markets. Mandel (2009) notes that the return on art investment is higher than bonds and lower than equities. Atukeren and Seckin (2009) argue that the Turkish paintings market underperforms the Istanbul Stock Exchange–listed stocks. Kraeussl and Logher (2010) point out that the emerging art markets provide interesting investment opportunities for the purpose of optimal portfolio allocation after the performance of three major emerging markets of Russia, China, and India. Although these results are different, they have the common sense that art investments have a higher risk and a low correlation with other financial assets (McAndrew & Thompson, 2007).
The third strand of the literature has concentrated on the investment risk for artworks. Agnello (2002) notes that American paintings have twice the standard deviation of the SP500 index but yield only one third than the return on stocks. Worthington and Higgs (2006) indicates that the risks of Australian art are quite similar to those on Australian stocks. Dimson and Spaenjers (2014) state that investors need to consider the risk of short-horizon cyclical underperformance when choosing their investment horizon. In general, there is a complete consensus that investment in collectibles such as artwork collection is as risky as equity investing (McQuillan & Lucey, 2016). Moreover, Renneboog and Spaenjers (2013) pay attention to the diversification capabilities of artworks within bond and equity portfolios and they find that there is a low correlation between art investment and other financial assets, which supports the portfolio diversification.
In terms of the study of the Chinese art market, Hsieh et al. (2010) find that the returns on Chinese 20th Century Modern Art works have exhibited higher returns than typical stock markets (e.g., S&P Total Return Index and Shanghai Stock Market Comprehensive Stock Price Index), and it has a low correlation with these stock market trends. Xiong (2012) indicates that the economic boom has created new wealth in China and rising demand for Chinese fine art and calligraphy, and then driving up prices in the art market. Shi et al. (2017) examine whether investors exhibited a home bias in the domestic art market and the result shows that artworks auctioned in the artist’s home cities tend to have higher prices. Park et al. (2017) analyze art investments with different investment horizons in the Chinese art market and find that both art returns and volatilities increase with the investment horizons. Wang (2017) analyzes the structure of the hedonic characteristics of 12,701 Chinese oil paintings and the finding shows that highly priced Chinese oil paintings have both higher expected returns and less risk than those that are priced lower. Shi et al. (2018) indicate that the average annual appreciation in the value of Chinese artwork was 8.42% in USD and the Chinese artwork possesses a comparatively better risk aversion and return profile and a low correlation with other assets.
Although there is a growing body of studies on the return and risk characteristics of the art market, less is related to bubbles in this market. Goetzmann (1993) notes that the overreaction of collectors and the “stylistic” risk might push the artwork prices, which could cause a bubble. In recent years, using modern econometric approaches, Kraeussl et al. (2016) find two historical speculative bubbles in the international art market and detect explosive movements in different fine art market segments. Assaf (2017) retests bubbles in the international art market, covering more sectors and regions. The result falls in the line with Kraeussl et al. (2016) because there is more than one bubble in the international art market. In terms of individual countries’ art markets, Ender et al. (2018) argue that there is no bubble in the Turkish paintings price. In addition, it is widely approbatory that financial crises and the collapse of asset bubbles are closely related (Reinhart & Rogoff, 2009). As artworks provide an alternative investment option for investors all around the world, the collapse of these bubbles may weaken the overall confidence of investors, which could lead to the “Butterfly Effect.” 1 Therefore, in this article, we try to investigate whether there are bubbles in the Chinese art market, which might shed new light on the existing literature.
Present Value Model and Methodology
According to Tirole (1985) and Gürkaynak (2008), it is widely accepted that asset prices or commodity prices might deviate from their fundamental values because of “speculative bubbles,” “fads,” or “information bubbles.” Under rational expectations and the present value model, the price of the art market price is equal to its discounted expected fundamental value. Therefore, we can obtain the following equation:

where
Accordingly, the equation is written as follows:

where

where

Equation 3 denotes that the fundamental model has two parts: a “market fundamental” component and a “bubble” component. When identifying
According to the explosive property of bubbles, Diba and Grossman (1987) propose to test the stability of the logarithmic sequence of asset prices and visible basic prices to determine the existence of bubbles. Adding an explosive alternative hypothesis in the standard augmented Dickey–Fuller (ADF) test or Phillips and Perron (1988) test is the principle of this traditional test. Considering the following model:

where
Homm and Breitung (2012) indicate that Phillips et al. (2012) test is an effective way of detecting cyclical crashing behavior and is robust against structural breaks considering a potential bubble burst. Their method is to repeatedly estimate the ADF model over the forward expanding sample period and examines the hypothesis based on the highest value of the corresponding statistic sequence. The window

The SADF method is particularly valid for detecting the bubble when there is only one bubble episode in the sample. However, there may be numerous price bubbles in the full sample. At this time, the SADF test might suffer from the existence of more than two bubbles. This disadvantage could become clearer when detecting bubbles in the more frequently changing markets or long-period series (Su et al., 2017). To address this disadvantage and detect multiple bubbles, the GSADF test is used depending on the flexible window size (Phillips et al., 2012, 2015). This test adopts a feasible range of flexible windows by changing the interval of the sample rather than fixing the starting point of recursion, which is different from the SADF test. Due to greater window flexibility, the GSADF test could cover more subsamples of the data, which causes it to perform better than the former test when there is more than one bubble.
Similar to the SADF test, the algorithm of GSADF inherits the idea of repeatedly operating the ADF test regression on a sample sequence. The GSADF test allows the outset
When the null hypothesis is a stochastic process with an asymptotically insignificant drift and this model contains an intercept part, the finite distribution of this statistic is

where
The main merit of the GSADF and SADF tests is that it allows us to examine the possible nonstationary behavior of time series to prevent mild crashing alternatives. Instead of fixing the outset of the sampling period, a different method is used, causing the GSADF test to extend the sequence by changing the start and end points of the sampling period within a feasible and flexible window. Due to the advantages of these tests, the detection of more than one bubble in the Chinese art market can be effectual and significant.
Data
With the highest auction turnover, the FCPC, OPCA, and FCCMC constitute the most representative art category for the Chinese market (Park et al., 2017). Moreover, Shi et al. (2018) also note that the FCPC constitutes the most important segment of the entire Chinese art market. Therefore, we focus on these three segments to represent the development of the Chinese art market. Furthermore, to detect the bubble in the Chinese art market, this study utilizes the traditional Chinese painting price index, oil painting price index, and porcelain price index constructed from the Art Market Monitor of Artron (AMMA) and investigates the samples from 2000 to 2017. 2 The series in the sampling period is semi-annual data and normalized to 1,000 in the year 2000. 3
In Figure 1, the upper line indicates the price of the Chinese art market. It is obvious that traditional Chinese painting price was low and stable prior to 2009, basically less than that in 2000. However, the market price increased sharply and we can observe that there was a skyrocketing phase in traditional Chinese painting prices and porcelain prices between 2009 and 2011. Xiong (2012) indicates that the past decade’s economic boom has created new wealth and rising demand for fine art and calligraphy, and then driving up prices in the Chinese art market. In addition, Art & Finance Report (2011) shows that, coinciding with the rapid growth in the Chinese art market since 2008, a large number of art investment funds have been coming into this market, which highlights the financial features of the art market. However, after reaching a peak of 9,132 in the first half of 2011, the price of traditional Chinese painting declined rapidly to about 5,000. The oil painting price fluctuated upward since 2008 and exceeded 15,000 in 2017, 15 times higher than the original. In general, the Chinese art market price has surged and fluctuated dramatically because the art investment funds came into this market. Considering the financial capital flowing in this market, there is a possible existence of bubbles in the Chinese art market.

The GSADF tests of the price of the Chinese art market.
Empirical Results
According to the principle of GSADF and SADF bubble tests proposed by Phillips et al. (2012, 2015), this article tends to utilize the SADF test and then apply another method to detect the bubble phases in the Chinese art market. The critical values for both tests are obtained through Monte-Carlo simulations with 10,000 replications. The summary output of both tests is registered in Table 1. The statistics for the traditional Chinese painting price always appear to exceed their respective 5% right-tail critical values (i.e., 4.926 > 1.546, 5.252 > 3.350), whereas statistics for the oil painting price and porcelain price are below their critical values. The obvious proof from the GSADF and SADF tests provides evidence that prosperity exists in the traditional Chinese painting market, allowing us to highlight the possible bubbles.
Results of the SADF and GSADF Tests for the Chinese Art Market.

Note. This table reports the SADF and GSADF tests for the null hypothesis of a unit root against the alternative of an explosive root. SADF = supremum augmented Dickey–Fuller; GSADF = generalized supremum augmented Dickey–Fuller.
and ** indicate significance at the 1% and 5% levels, respectively.
Utilizing the GSADF test, we draw the estimate of these indices, with its 5% right-tail critical value. In Figure 1, the bottom curve indicates the GSADF statistics. The middle line indicates the GSADF statistics with 95% confidence intervals. The upper one represents the index of the Chinese art market. Specifically, the result in Figure 1 indicates, at the 5% critical level, that there are two price bubbles (2004–2005 and 2010–2011) during the analyzed period. Phillips et al. (2012, 2015) confirm that the GSADF procedure performs better than another test. According to this argument, we can conclude that there is evidence of multiple bubbles in the Chinese art market. Therefore, we further identify the bubbles and detect the reasons in this market.
The first bubble happened between 2004 and 2005. Kraeussl and Roelofs (2008) find significant causal relations between the art market and the economic condition. China’s gross domestic product (GDP) grew rapidly from 2004 to 2005, with an average growth rate of more than 10%, which might provide a powerful impetus for the art market. Moreover, according to Artron.net, 4 art investment funds started to flow into the Chinese art market from 2005. 5 Figure 2 presents the trend of art investment funds coming to the Chinese art market. It can be found that there is a total of $8 million art investment fund that flowed into the market in 2005, leading to the beginning of the financialization of artworks and causing sharp volatility in the price of artworks. For example, due to the huge inflow of the finance capital, Zhang Daqian’s huge landscape painting Jiangshan Wanli Map was sold at a price of $9.8 million in 2005, setting a record for China. The hot money diverted from investment funds is purely speculative and is generally a short-term investment behavior that seeks high returns and flows quickly in the market. Therefore, when a large amount of hot money is involved, the overall market price will rise rapidly due to short supply. Apart from this, Li (2006) notes that investor’s interest in artworks increased from 2004 to 2005 and this makes the whole market price have a clear upward trend. Therefore, the overreaction of investors makes these markets see the bubble during this time. However, the quality of artworks is uneven, and fake works are circulating in the market 6 (Li, 2006). When these fake works are found, investors will lack confidence and demand for artworks will be decreased in the market, which may cause money left and the market index fall, leading to the bursting of the bubble (Xiong, 2012).

The trend of art investment funds coming to the Chinese art market.
In 2010, we found the second bubble, which collapsed in 2011. Due to the artworks becoming an alternative investment, the Chinese art market is sensitive to economic development (The Chinese Art Auction Market Report, 2011). The report also notes that the financial capital links this market ever closer with the macroeconomy. From this aspect, the hugely increasing narrow money (M1) supply in 2010 is the main reason that causes the prosperity of the Chinese art market. Using the Granger (1996) causality tests, we confirm the statistical connectivity between the art industry and the money supply during the sampled period. Table A1 illustrates the result of the Granger causality tests between the money supply growth and the art market turnover growth. It can be observed that, at the 10% significance level, the money supply growth can cause the art market turnover growth. Moreover, Figure 3 presents the relationship between turnovers of the Chinese art market and the money supply. It can be found that the money supply increases highly in 2010, with a growth rate of 26%. Against this background, market participants’ expectations for inflation will increase, and investors or speculators will be eager to find suitable investment assets to maintain and increase the value of holding money (Xu et al., 2017). The Chinese Art Auction Market Report (2011) indicates that the art market, as an alternative investment channel, is particularly eye-catching due to its high return, which causes money to flow into the art market. Therefore, the growth rate of turnovers in the Chinese art market in 2010 increased sharply near 177%, promoting the prosperity of the art market price in 2010.
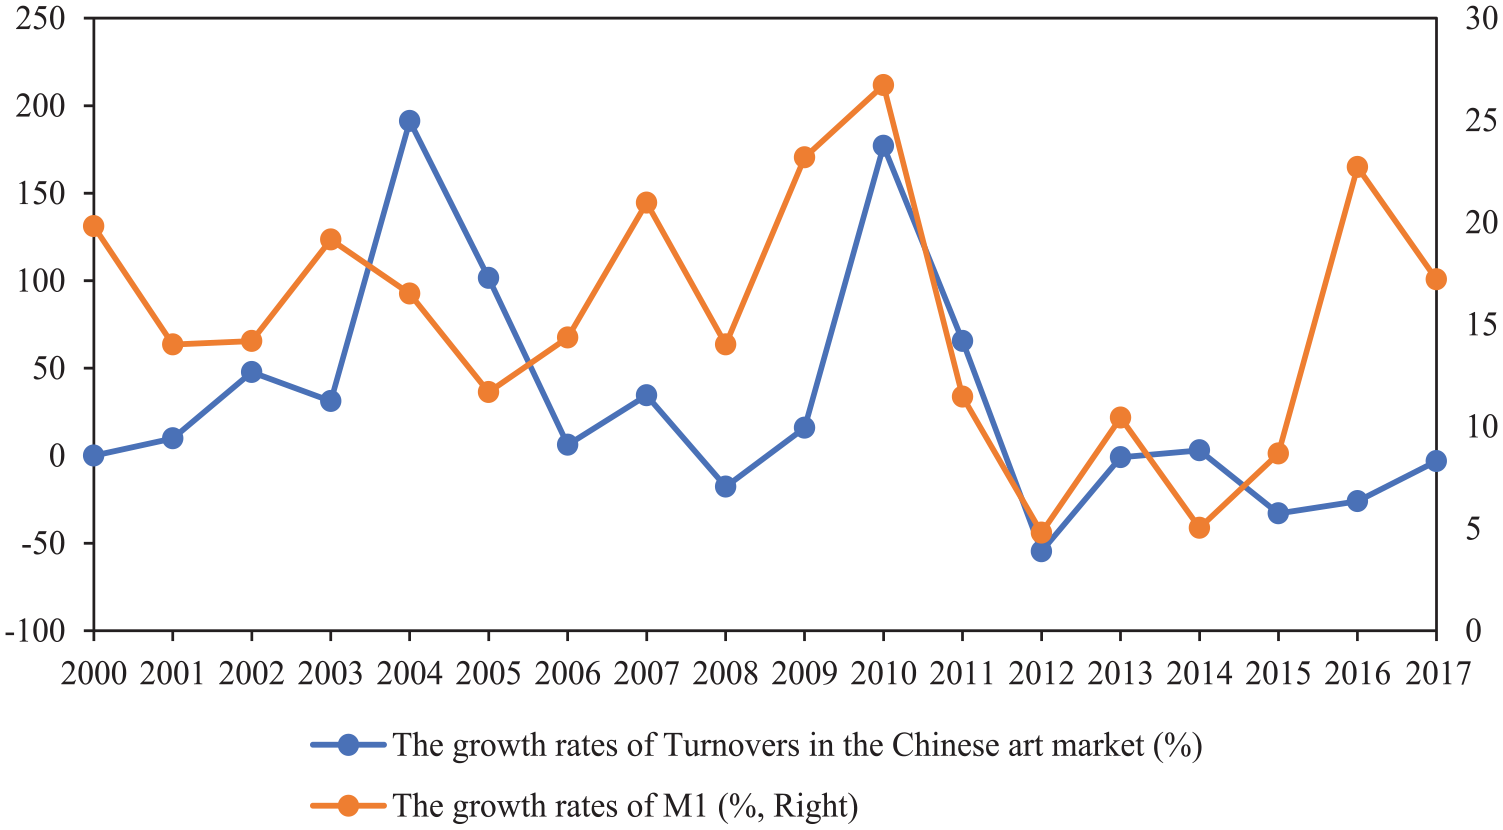
The connectivity between the art market turnovers and the money supply.
Second, the Chinese Art Auction Market Report (2012) notes that the art investment funds and credit institutions were concentrated in the market in 2010 and 2011, causing the art trading market to expand explosively. Figure 4 shows the trend of the number of art investment funds coming to the art market in China. It can be clearly noticed that the total number of art investment funds has grown dramatically between 2010 and 2011. A lot of art funds entering the market will inevitably raise the demands in the art market and this phenomenon might become one of the high-priced driving forces.

The trend of the number of art investment funds coming to the Chinese art market.
Finally, the theme of “Cultural Security” laid down by the Sixth Plenary Session of the 17th Communist Party of China (CPC) Central Committee in 2011 further defined the goal of cultivating the cultural industries to the point that these become a pillar industry of the national economy. The art market is one of the cultural industries and the proposed policy promotes the development of this market. Therefore, during this time, the index of this market jumps about triples, implying the Chinese art market booms.
However, Xiong (2012) notes that the Chinese art market has entered its critical crash stage in 2011, which means that this market bubble has indeed sprung a huge leak. The main reason behind is the decreasing inflow of money into the Chinese art market. From the international perspective, McQuillan and Lucey (2016) point out that the huge growth in the Chinese art market was almost supported by international investors, especially from the United States and Europe. However, in 2011, the European sovereign debt crisis broke out, which reduced the flow of money into the Chinese art market (Xiong, 2012). From the domestic perspective, macroeconomic indicators of China had entered a downslide track in 2011. The result of the Granger causality tests in Table A1 reveals that the art market turnover growth is affected by the money supply growth. Moreover, combined with Figure 3, it can be clearly noticed that the growth rate of the money supply has dropped from nearly 27% in 2010 to nearly 12% at the end of 2011. Against this background, the whole society and the financial market felt the strong pinch of liquidity constraint (Wang & Huang, 2011). The slowdown of money supply leads to capitals flowing into the Chinese art market and the demand for artworks decreases (Chinese Art Auction Market Report, 2012). Therefore, the growth rate of turnovers of the Chinese art market in 2010 decreased sharply from nearly 177% to nearly 65%, which indicates that the prosperity of the art market is unsustainable and the bubble bursts. In addition, according to the China News and Finance and Investment News, 7 the proportion of fake paintings to sales is nearly 80% in 2011. Art China 8 even calls 2011 as the “Year of fake works.” Xiong (2012) points out that these fake works that are found might shock investors’ confidence and the demands for artworks will be accordingly decreased, resulting in the bubble burst. Finally, due to the anticorruption actions initiated by President Xi Jinping in 2012, it has impacted China’s luxury sectors and its art market. Therefore, many Chinese wealthy individuals refrained from making “extravagant” acquisitions. This factor also contributes to the bursting of the bubble.
Conclusion
As the art market in China has become a highly attractive source of investment for local (and foreign) investors, it is essential to probe whether growing prices and profit margins in this market are short-lived or not. In this study, we investigate the existence of bubbles in the Chinese art market, utilizing the GSADF test developed by Phillips et al. (2012, 2015). The empirical findings suggest that the increasing prices in this market are short-lived and multiple bubbles exist in this market in the periods from 2004 to 2005 and 2010 to 2011. Accordingly, investors rushing into this market should be careful while placing their funds. The emergence of bubbles corresponds to the period of rising prices; on the contrary, the price decline will lead to the bursting of the bubble, which is in agreement with the bubble model (Gürkaynak, 2008). The evidence from this article could be beneficial to investors and regulators in the Chinese art market, whose investment strategy and policy implementation will depend on understanding the dynamics and behavior of their prices over time. Here are some implications: First, the art investment funds starting into the Chinese art market are generally with speculative behaviors, which results in bubbles. Therefore, to maintain the steady development of the current Chinese art market, the market regulators and policymakers should take initiatives. For instance, they should monitor the flow of the art funds and manage the expectations of the public to reduce speculative behavior, especially at the stage when many funds are flooding into the market. Second, the fake artworks that are found in the Chinese art market may weaken the confidence of participators and further lead the demands to decrease and the bubbles to collapse. Therefore, art inspection agencies should strengthen the identification technology of fake artworks to provide a healthy trading environment in the art market. Finally, the condition of China’s monetary policy, especially the money supply, exerts a significant influence on asset price stability (Jia et al., 2014). As an alternative investment channel and the financialization of artworks in recent years, our empirical results find that the Chinese art market has a close linkage with the money supply. Thus, the authority should maintain the growth rate of the money supply to stabilize asset prices, including the price of the Chinese art market.
Footnotes
Appendix
Granger Causality Tests Between the Money Supply Growth and the Art Market Turnover Growth.

| H0: Money supply growth does not Granger-cause art market turnover growth | H0: Art market turnover growth does not Granger-cause money supply growth | |||
|---|---|---|---|---|
| Tests | Statistics | p | Statistics | p |
| Bootstrap LR Test | 3.726* | .074 | 3.522* | .082 |
Note. These tests are performed using the EViews software. LR = likelihood ratio.
Significance at the 10% level.
Declaration of Conflicting Interests
The author(s) declared no potential conflicts of interest with respect to the research, authorship, and/or publication of this article.
Funding
The author(s) received no financial support for the research, authorship, and/or publication of this article.