
Abstract
The purpose of this study was to investigate (a) the validity and reliability of the inclusive Self-efficacy Instrument for Physical Education Teacher scale (SE-PETE-D), using a Lithuanian physical education (PE) teachers’ sample, and (b) the impact of type of disability and personal attributes. The English version of the scale was translated into Lithuanian using the back-translation technique. The participants were 193 PE teachers working in Lithuanian schools (60 males and 132 females), ages between 22 and 65 years (M = 46.47 years, SD = 9.08 years). The content and construct validity of the instrument was supported. The results of the factor analysis indicated a one-factor solution for the instrument’s intellectual disability (ID), physical disability (PD), and visual impairment (VI) subscales. Cronbach’s alpha reliability was high (ID = 0.96, PD = 0.97, and VI = 0.98). Test–retest correlation analysis showed a satisfactory coefficient (ID = 0.54, p < .05; PD = 0.75, p < .01; and VI = 0.63, p < .01; total of SE-PETE-D = 0.70, p < .01). The type of the students’ disability and the teachers’ adapted physical education (APE) training significantly influenced the teachers’ self-efficacy (p < .05). The Lithuanian version of the SE-PETE-D appears to be a valid and reliable instrument, enabling future research on Lithuanian PE teachers.
Keywords
Introduction
Inclusion is considered to be a process that should guarantee high-quality education for all members of society, recognizing and respecting diversity and taking into account their individual abilities and needs, while avoiding any discrimination (UNESCO, 2009). The concept of inclusive education requires the creation of a new social and cultural school, the aim of which is the participation of all students in the educational process while respecting their individual needs and abilities (Booth & Ainscow, 2011). The European Agency for Development in Special Needs Education (2012) prepared a profile of an inclusive teacher, with four main values that should be practiced by teachers working in inclusive educational systems: (a) respect for the student’s diversity and basic education while treating differences as resources and opportunities, (b) providing support while expecting the highest achievements for each student, (c) collaboration and work in a team, and (d) continuous professional development and taking responsibility for lifelong learning.
The educational system in Lithuania has moved during the past 25 years from separated toward inclusive schooling, following the enactment of the National Education and Disabled integration laws in 1991 (Parliament of the Republic of Lithuania, 1991). Two forms of participation of children with special education needs (SEN) were introduced: inclusion, where the child is educated in the general class with other children, and partial integration, where a small group of children with SEN is educated as a separate group within a general education school. Special schools for children with severe specific disabilities such as intellectual, visual, auditory, or movement disorders continued to operate. Since 2003, Lithuania’s education system has been introducing ideas of inclusive education, that is, adaptation, support, and individual education planning for the inclusion of people with special needs.
The term used by legislators in Lithuania for children with disabilities is students with special educational needs, and the Consolidation Report of the Lithuania Law of Education (Parliament of the Republic of Lithuania, 1991) defined the aim of the education of such students as providing help for the students to study according to their capacities, enabling them to get education and qualifications, and recognizing and developing their skills and potency. The Lithuanian Ministry of Science Education prepared a strategic plan for 2014 to 2016, where one of the main aims was to develop measures of inclusion for children with SEN. In Lithuanian general education schools, 11.74% of students aged 6 to 21 years have SEN; of these 87.89% attend regular classes in mainstream schools, 2.63% attend special education classes, and 9.48% are educated in special schools or at special education centers (Official Statistics Portal, 2017). Currently, transportation is guaranteed for these children, and there are Child Welfare Boards in all education institutions that are expected to support inclusion of children with SEN.
Although not specific to physical education (PE) teachers, surveys performed in Lithuania indicated that the inclusion practice is challenged with barriers such as the following: inadequate teacher training and lack of competence, lack of support, large class sizes, not enough preparation time due to administrative demands, and inadequate psychological training and support when working with children with SEN (Kiušaitė & Dubauskaitė, 2010; Paukštienė & Ustilaitė, 2012). These barriers are quite similar to those reported in other countries specifically for PE teachers (Baloun, Kudláček, Sklenaříková, Ješina, & Migdauová, 2016; Block, Hutzler, Barak, & Klavina, 2013; Block, Kwon, & Healy, 2016; Griggs & Medcalf, 2015; Jeong & Block, 2011; Jerlinder, Danermark, & Gill, 2010; Ko & Boswell, 2013; Kudláček, Baloun, & Ješina, 2018; Smith & Thomas, 2006; Tindall, Culhane, & Foley, 2016). The PE class is an environment where students with different skills should be able to experience and realize themselves through movement (Bailey, 2006; Ko & Boswell, 2013), and it also should provide excellent conditions for the students to observe and evaluate each other (Grenier, Dyson, & Yeaton, 2005; Klavina, Jerlinder, Kristén, Hammar, & Soulie, 2014), recognize the limits of each other’s abilities and feelings, understand expectations (Galkienė, 2016; Griggs & Medcalf, 2015), and actively participate in educational processes. Therefore, some authors have suggested that PE is one of the most favorable disciplines capable of developing and maintaining values necessary for the effective development of inclusive education (André, Deneuve, & Louvet, 2011; Grenier et al., 2005; Hutzler, 2003, 2007; Klavina et al., 2014; Polvi & Telama, 2000; Qi, Wang, & Ha, 2017; Tubić & Đorđić, 2012).
The teacher plays one of the most responsible and difficult roles in inclusive education (Navarro, Zervas, Fabregat, Gesa, & Sampson, 2016). The teacher not only has to transfer knowledge but also has to adapt it to students who have different levels of skills (Block, Taliaferro, Harris, & Krause, 2010; Griggs & Medcalf, 2015; Qi & Ha, 2012). Teachers accepting the diversity of students are able to make flexible decisions, and to transfer ideas about natural differences between people with equal value (Galkienė, 2016; Griggs & Medcalf, 2015; Klavina et al., 2014; Ko & Boswell, 2013). In an inclusive lesson, the teacher has to create a learning environment where every student feels that he or she is a full participant in the teaching and learning process (Block et al., 2010; Griggs & Medcalf, 2015; Karani & Skordilis, 2016). The teacher has to create an environment for all, where personal weaknesses and disadvantages are not highlighted, where a student feels safe and as an equally important member of the community, and where in certain situations measures are taken to turn personal weaknesses and disadvantages into benefits and advantages (Booth & Ainscow, 2011; Ko & Boswell, 2013). This all can be achieved only by a teacher who is confident and who relies on the knowledge and its practical application at work (Block et al., 2010; Griggs & Medcalf, 2015). To create such an environment, the teacher must not only have knowledge but also have the confidence in her or his skills and in the capability to apply this knowledge in various specific situations (Block et al., 2013; Block et al., 2010; Griggs & Medcalf, 2015).
The way the teacher adapts the task, modifies the goal, applies educational methods, and handles difficult situations depends on his or her level of situation and task-specific confidence. This has been labeled by Bandura (1994, 1997) as self-efficacy (SE), which is the confidence a person has in his or her own capability to produce desired levels of performance, relying on the knowledge and skill he or she possesses as compared with a social reference group. SE is the major unit in Bandura’s (1997) Social Cognitive Learning Theory concerning the effect of an individual’s interactions with others on his or her actions and behavior and on the environment. The teachers’ SE is their confidence and belief in being able to cater to the varied needs of all students in an inclusive school setting (Block et al., 2010; Karani & Skordilis, 2016). Therefore, SE beliefs determine how environmental opportunities and impediments are perceived and affect the choice of activities, how much effort is expended on an activity, and how long people will persevere when confronting obstacles (Bandura, 2006). A meta-analysis by Klassen and Tze (2014), consisting of 43 studies representing 9,216 participants, demonstrated that teachers’ perceived SE is related to increased persistence in working with challenging students; SE was shown to influence teachers’ instructional practices, enthusiasm, commitment, and teaching behaviors. SE theory, applied in the educational context, has sparked a rich line of research into how teachers’ SE beliefs are related to their actions and to the outcomes they achieve (Tschannen-Moran & Woolfolk Hoy, 2007). Furthermore, individual studies have found that teachers’ SE is one of the strongest predictors of their attitudes toward inclusion (Block et al., 2010; Ilić-Stošović, Nikolić, & Popadić, 2015; Karani & Skordilis, 2016).
Given the current need for a supportive role of PE teachers toward inclusion, as well as the lack of previous training in adapted physical education (APE), the exploration of PE teachers’ SE and its links with teaching performance and demographic and environmental factors is needed for a better understanding of the pathways leading to enhancing students’ outcomes. To facilitate this goal in Lithuania, an instrument that measures PE teachers’ SE toward inclusion is needed, and its validity must be tested with a sample of local PE teachers. A number of instruments have been created for the evaluation of general teachers’ SE (Ilić-Stošović et al., 2015; Karbasi & Samani, 2016; Klassen & Tze, 2014; Sarı, Çeliköz, & Seçer, 2009; Tschannen-Moran & Woolfolk Hoy, 2001; Tschannen-Moran, Woolfolk Hoy, & Hoy, 1998). According to the unique PE school framework, several specific instruments have been developed in this domain; SE in teaching PE under inclusive conditions (SEIPE; Hutzler, Zach, & Gafni, 2005) and the Physical Education Teaching Efficacy Scale (PETES; Humphries, Hebert, Daigle, & Martin, 2012) are generic instruments, whereas the Physical Educators’ SE Toward Including Students with Disabilities–Autism (Peseisd-A, Version 8.2; Beamer & Yun, 2014; Taliaferro, Hammond, & Wyant, 2015) was designed to deal with only one type of disability—that is, autism. Another instrument that was developed is situation- and disability-specific, and therefore may be useful for a variety of disability conditions and situations encountered during PE: the Self-efficacy Instrument for Physical Education Teacher scale (SE-PETE-D) designed by Block and colleagues (2013). The SE-PETE-D has been adopted by both European and American scholars (Baloun et al., 2016; Eden & Hutzler, 2015; Jovanović, Kudláček, Block, & Djordjević, 2014; Kudláček et al., 2018; Reina, Hemmelmayr, & Sierra-Marroquín, 2016; Taliaferro et al., 2015; Tekidou, Evaggelinou, Papaioannou, & Block, 2015; Tindall et al., 2016), and their research has proven that this instrument is reliable and valid.
The SE-PETE-D (Block et al., 2013) enabled the research of this study, as it allows for maximal variability and specificity in the portrayed disability conditions and PE situational contexts. This instrument aids in the study of PE teachers’ SE levels when working with a variety of disability conditions depicting students with intellectual, physical, and visual impairments during different situations of PE implementation, such as peers’ instruction, safety, specific adaptations, and staying on task. Klavina et al. (2014) and Grenier et al. (2005) showed evidence suggesting that PE teachers’ skills in instructing peers to assist students with SEN positively influence students’ attitude toward classmates with SEN and help create an inclusive environment in the class. Another important factor for creating an inclusive environment for all students is the ability of the PE teacher to ensure safety in the PE class (Qi & Ha, 2012; Tripp, Rizzo, & Webbert, 2007) and to create a motivational environment (Granero-Gallegos, Baena-Extremera, Gómez-López, & Abraldesb, 2014; Ko & Boswell, 2013; Kodish, Hodges-Kulinna, Martin, Pangrazi, & Darst, 2006). The outcomes of the Baloun et al. (2016) and Kudláček et al.’s (2018) studies revealed that group perception toward the modifications of the equipment and environment, together with appropriate instructions, are essential factors for assuring the success of students with SEN in PE. Therefore, it is important for PE teachers to be able to adapt instructions to keep their students with disability on the task (Block et al., 2013; Kudláček et al., 2018; Lee & Baek, 2015; Perlman & Piletic, 2012). Thus, the main purpose of the current study was to validate the structure of the Lithuanian version of the SE-PETE-D. Because we have observed significant differences between teachers who have attended an APE course and those who have not, we performed separate analyses for those who attended or did not attend an APE course. A secondary purpose was to determine the relationships among the level of PE teacher’s SE, the types of disabilities, and personal attributes.
Method
Participants
Teachers’ recruitment was conducted between January and March 2017, using two modalities: (a) circulating the questionnaire by means of email (web-based) and (b) distributing a paper-based questionnaire to a PE teachers’ six-hr seminar in Kaunas (Lithuania), prior to a seminar of APE. Invitation letters to participate in the survey were sent to the education departments of all Lithuanian municipalities (n = 60). In total, 37 education departments of Lithuanian municipalities returned confirmation letters indicating their agreement to cooperation and to send the survey information to the emails of PE teachers in the department, and to encourage them to participate in the survey. According to the data from the year 2015 of the Lithuanian Centre of Information Technologies in Education, there were 1,357 PE teachers working in these municipalities. The participants were the PE teachers, who have been working with Grade 5 to 12 students. However, only 73 PE teachers filled in the electronic survey. During the seminar for PE teachers in Kaunas, an additional 106 questionnaires were completed by the teachers, and of these 98 questionnaires were acceptable; eight questionnaires were eliminated from the analysis due to incomplete data. In addition, the PE teachers’ comments and notes during their completion of SE-PETE-D-LT questionnaire were written down by the researchers who were involved in the data collection. These were informal comments from participants during the questionnaire administration at the teachers’ seminars. These comments were later used in the discussion of the study’s results. We determined a minimal sample size in accordance with the recommendation of Osborne and Fitzpatrick (2012). Because the questionnaire included 33 questions, we had to test at least 165 PE teachers to meet the minimum requirements (five participants per question). To fulfill the test–retest analysis, 22 PE teachers from 12 schools (pro-gymnasiums and gymnasiums) located in two municipalities were additionally tested. The recruitment of these PE teachers was conducted using the distribution of a paper-based questionnaire. Our sample included a total of 193 PE teachers from 116 general education schools (pro-gymnasiums, secondary schools, and gymnasiums) in 37 municipalities who participated in the survey. The research design for implementing the study was approved by the Committee of Ethics of social science at the Lithuanian Sport University and from the Education Departments in the participating municipalities (No. SMTEK-09). The participants of the survey received and signed an informed consent form prior to filling in the questionnaires.
Instrument
The SE-PETE-D primary version utilized for validation in English (Block et al., 2013) was used for this study. The questionnaire begins with the concept of the survey, general instructions, an explanation of SE theory, and an example for using the rating scale while answering an item. The survey had four parts: three subscales—one for each disability, that is, intellectual disability (ID), physical disability (PD), and visual impairment (VI), and a demographic section. A vignette demonstrating a student with an ID, PD, or VI, who was attending a PE class, was presented prior to the questions of each subscale. The first subscale consisted of 11 questions related to the inclusion of students with ID in a general PE class. The second subscale followed with 12 questions related to PD. The third subscale followed with 10 questions related to VI. The scale used for rating each question ranged from 1 to 5: 1 = no confidence, 2 = low confidence, 3 = moderate confidence, 4 = high confidence, and 5 = complete confidence.
The fourth part consisted of demographic questions concerning the participants’ attributes, such as age, gender, type of school, years of experience, training in APE and/or special education, and support from other specialists, personal and professional experience with people with disabilities.
Translation
The English version of the SE-PETE-D (Block et al., 2013) scale was translated into Lithuanian using the back-translation technique described by Brislin (1986). This technique of translation requires four independent bilingual translators. Translator 1 and Translator 2 independently translated the original English version of the SE-PETE-D questionnaire into Lithuanian. After comparing the translations, the translated instrument was forwarded to the other two bilingual translators, who translated the instrument back into English. Finally, the retranslated version was compared with the English version by one of the authors of the English version, for final approval. In addition, and in accordance with the Czech translation of the SE-PETE-D (Baloun et al., 2016), an expert review was performed. Two Lithuanian experts of adapted physical activity were consulted about the clarity, conciseness, and terminological precision of the Lithuanian version of the SE-PETE-D. The initial version of the instrument was tested on a sample of 75 PE teachers (Selickaitė & Rėklaitienė, 2015). This version confirmed its suitability for further analysis and was labeled SE-PETE-LT.
Data Analysis
SPSS Version 22.0 software and AMOS Version 23.0 were used to compute the statistical processes.
Construct validity
The influence of background variables on the teachers’ scores was assessed. The factor structure and construct validity were assessed across groups where significant differences appeared by exploratory factor analysis (EFA) and confirmatory factor analysis (CFA). For EFA analysis, all SE-PETE-LT questions (ID [11 items], PD [12 items], and VI [10 items]) similar to those reported in Block et al.’s (2013) instrument were used. CFA analysis was accomplished based on the factor structure generated by the EFA analysis. All analyses were conducted separately for each of the three subscales (ID, PD, and VI).
EFA
Based on Block et al.’s (2013) article and Field’s (2009) recommendations, an EFA was conducted using the principal component analysis (PCA) extraction method, followed by orthogonal (Varimax) rotation to maximize variance. Before conducting the PCA, statistical assumptions necessary for PCA were tested (Field, 2009). For example, the Kaiser–Meyer–Olkin (KMO) index should be greater than 0.70 and is considered inadequate if less than 0.50 (Field, 2009), and Bartlett’s test of sphericity has to be highly significant (p < .001; Field, 2009). The optimal number of factors was determined by latent root criteria (eigenvalues > 1.0, the Kaiser’s criterion K1) and inspection of the scree plot (Field, 2009). An item with communality of less than 0.40 was removed from the analysis, and the PCA was computed again (Field, 2009). In addition, to assess the fit of the factor models, we examined the differences between the model-based correlations and the observed correlations; not more than 50% of the residuals should be greater than 0.05 (Field, 2009).
We also conducted EFA for different study groups, which we created according to different demographical factors. The aim was to determine how the subscale structure changes due to APE course or seminar, personal and professional experience with persons with disabilities. The only difference in the scale’s structure across demographics was encountered when dividing the sample according to their previous attendance in an APE course. The EFA was performed with the total sample size (N = 171) and then separately with each of the groups—PE teachers who attended an APE course (n = 33) and PE teachers who did not attend such a course (n = 138).
Based on the EFA results, we did a separate factor analysis with an EFA and CFA with the 138 participants. The data were randomly divided into two independent samples (n = 69 cases in each half). One half was analyzed with the EFA to reestablish the factorial structure obtained with the total group, and the second half was analyzed with CFA to confirm this structure.
CFA
The data were analyzed with structural equation modeling (SEM) using path analysis (Teo, Tsai, & Yang, 2013). SEM is a set of techniques for testing a theory by examining correlation: covariance and even mean differences. It can be illustrated using an elaborate and sophisticated form of box-and-arrow model known as a path diagram (Teo et al., 2013). The goodness-of-fit of each model was assessed using the chi-square (χ2), normal fit index (NFI), comparative fit index (CFI), and root mean square error of approximation (RMSEA) in accordance with the procedure described in Block et al. (2013). Insignificant chi-square results at a 0.05 threshold are considered as an acceptable model fit (Teo et al., 2013). Values of NFI and the CFI greater than 0.90 are considered as an acceptable model fit (Block et al., 2013; Teo et al., 2013). The CFI is a revised form of the NFI, which takes into account sample size that performs well even when the sample size is small (Tabachnick & Fidell, 2007). RMSEA values below 0.05 are considered to reflect good fit to the model, values 0.05 to 0.10 moderate fit, and values greater than 0.10 poor fit (Teo et al., 2013).
Reliability analysis
Cronbach’s alpha coefficient was em-ployed to determine internal consistency, and test–retest reliability was employed to determine stability over time. Cronbach’s alpha values of .70 and above imply an acceptable level of internal consistency (Bryman, 2015; Field, 2009). Test–retest reliability was used to examine stability among items in each subscale. The period between the test and retest was 14 weeks. Test–retest reliability was assessed using Pearson’s correlation. Following Vallerand (1989), we estimated that a coefficient of .6 or more for test–retest is satisfactory.
Descriptives
Means (M) and standard deviations (SD) were computed to present the demographic characteristics of the participants, as well as raw data for each of the items in each of the three subscales (ID, PD, and VI) of the SE-PETE-LT.
Comparison
To evaluate the influence of the type of the school and survey method on the results of participants’ SE, we did general linear model univariate procedure. If the p value of Levene’s test is higher than the significance level, it shows that the dispersion homogeneity condition is fulfilled. Tukey’s test, p < .05, value shows that the difference between groups’ results’ averages is statistically significant; estimated effect size coefficient η2 (partial eta squared) evaluates the factor influence to the data. If η2 coefficient is close to 1, the active factor influence will be greater to survey results comparing with casual mistake. Observed power result shows criterion power. If value is close to 1, there will be greater probability to avoid the second type of errors (Pukėnas, 2005).
One-way analysis of variance (ANOVA) was computed within subjects to explore the similarities and differences across subscales. Tukey’s post hoc tests were employed, following significant differences. A parametric independent-samples t test was used to determine whether there was a significant difference between the means of SE in groups, which were formed based on demographic part of the questionnaire. To estimate the influence of gender, APE course/seminar, special education course/seminar, support, personal and professional experience to PE teachers’ SE, effect size of Hedges’s g coefficient was calculated. When sample sizes are small (N < 20) and different, it’s recommended to use Hedges’s g coefficient. An effect size less than 0.20 is considered a small effect, 0.20 to 0.50 is a medium effect, 0.50 to 0.80 is significant, and higher than 0.80 is considered to be a large effect (Cohen, 1988).
Results
In the description of results that follows, we repeated the method used in the study of Block and associates (2013) by designating the scales’ items in the text as well as in Tables 2 and 3, and Figure 1, with alphabetical labels for facilitating orientation throughout the manuscript. These labels do not necessarily identify similar items across subscales.

Path diagram of the ID subscale, PD subscale, and VI subscale (n = 69).
Participants’ Demographics
In total, 171 participants, age range from 22 to 65 years (M = 46.47 years, SD = 9.08 years), took part in the study; gender distribution was 51 males (M = 47.02, SD = 10.48) and 120 females (M = 46.24, SD = 8.46). Participants had general PE teaching experience ranging from 1 to 42 years (M = 21.52 years, SD = 9.29 years). In total, 33 PE teachers indicated that they had participated in an APE course or seminars during their studies or after graduation. Thirty-seven PE teachers reported experience working with students with ID, 20 had experience working with students with PD, and 20 had experience working with students with VI in general PE lessons in the past 5 years. Six PE teachers had support from an APE specialist, 29 from a teacher assistant, 106 from special education teachers, 18 from a physical therapist, and 17 from other specialists. In total, 19 PE teachers noted that they had a friend with ID, 18 PE teachers noted that they had a friend with PD, and 23 had a friend with VI. Thirteen PE teachers reported that they had a family member with ID, seven PE teachers had a family member with PD, and seven a family member with VI. The analysis of SE scores of PE teachers, who have been working in pro-gymnasium (n = 76), secondary school (n = 32), and gymnasium (n = 63), showed that the type of school does not have significant influence to PE teachers’ SE level: ID subscale, F(2, 168) = 0.002, p = .980, η2 = 0.000, observed power = 0.054; PD subscale, F(2, 168) = 0.462, p = .631, η2 = 0.005, observed power = 0.024; VI subscale, F(2, 168) = 0.020, p = .980, η2 = 0.000, observed power = 0.053.
To fulfill the test–retest analysis, a group of 9 males and 13 females, in total 22 PE teachers, was formed. This group’s participants’ mean age was 52.73 years (SD = 6.37 years). These participants had a mean general PE teaching experience of 28.82 years (SD = 8.64 years). In total, 15 of these PE teachers reported having experience working with students with ID, nine had experience working with students with PD, and five had experience working with students with VI in general PE in the past 5 years. The analysis of PE teachers, who have been working in pro-gymnasium (n = 12) and in gymnasium (n = 10), showed that type of the school does not have significant influence on PE teachers’ SE level: ID subscale, F(1, 20) = 1.599, p = .221, η2 = 0.074, observed power = 0.226; PD subscale, F(1, 20) = 0.236, p = .632, η2 = 0.012, observed power = 0.025; VI subscale, F(1, 20) = 0.460, p = .506, η2 = 0.022, observed power = 0.099.
The analysis of research results showed, that there was no significant influence between web-based and paper-based surveys: ID subscale, F(1, 191) = 0.326, p = .569, η2 = 0.002, observed power = 0.088; PD subscale, F(1, 191) = 0.086, p = .770, η2 = 0.000, observed power = 0.060; VI subscale, F(1, 191) = 0.156, p = .693, η2 = 0.001, observed power = 0.068.
Personal Attributes Impact on SE
The t test results showed that there were no statistically significant differences (p > .05) between those groups: male and female, who had no or had special education course/seminar, had no or had support from specialists, had no or had friends with disabilities (PD subscale), and had no or had students with ID and PD in PE class (ID and PD subscales). However, statistical significant differences (p < .05) were noticed between such groups: SE of PE teachers who attended an APE training (course or seminar) and PE teachers who did not participate in such training, SE of PE teachers who had and PE teachers who did not have friends with ID and VI (ID and VI subscales), between those who had and had no students in PE class with VI (VI subscale). The results indicated significant differences between groups in subscales (Table 1).
Adapted Physical Education, Personal and Professional Experiences Impact on PE Teachers’ Self-Efficacy.

Note. PE = physical education; VI = visual impairment; ID = intellectual disability; APE = adapted physical education; PD = physical disability.
Construct Validity
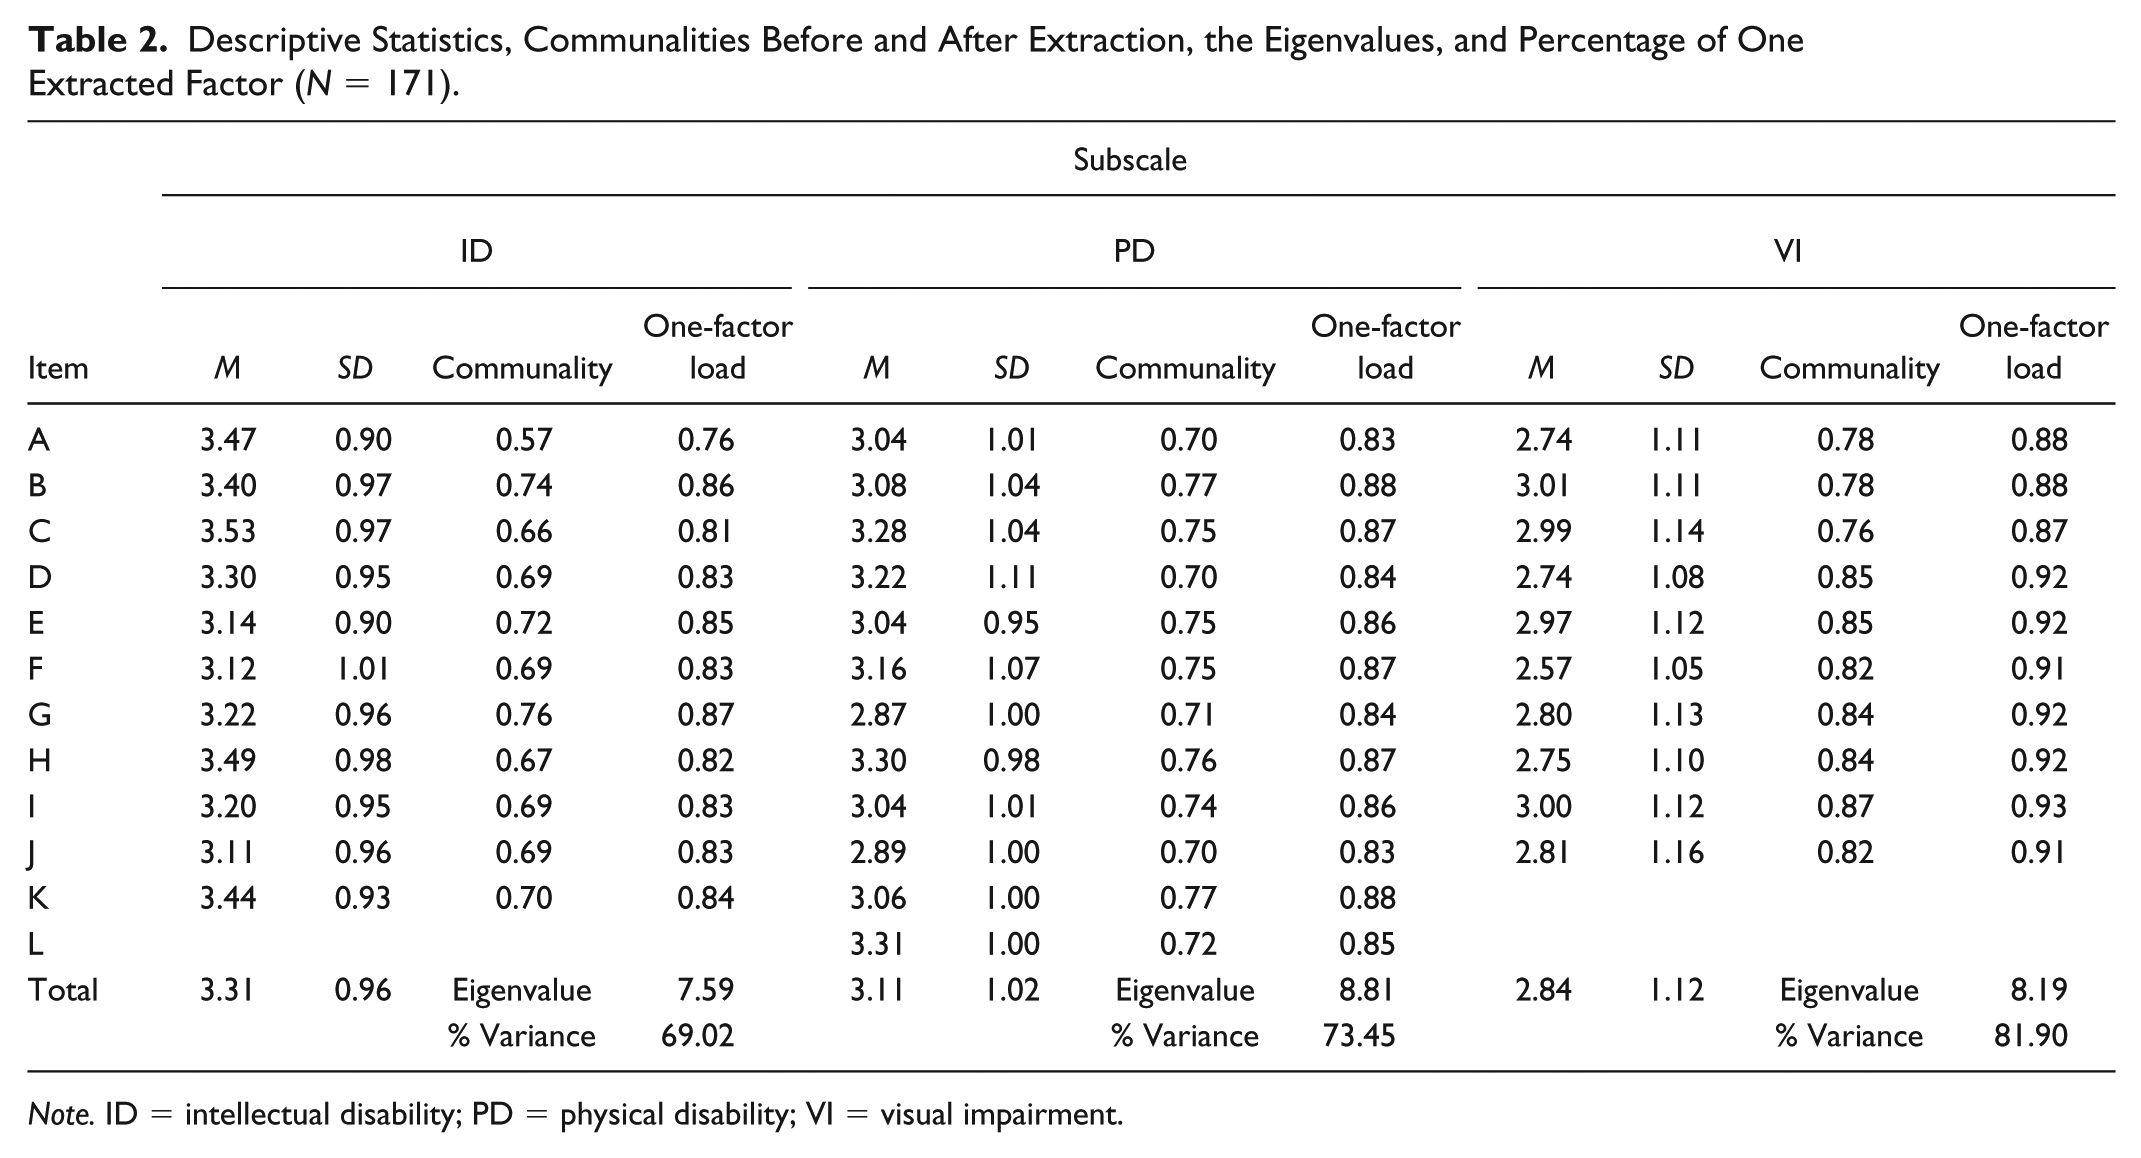
The descriptive statistics for each item (M and SD) and PCA data with the total sample size (N = 171 teachers) are presented in Table 2.
Descriptive Statistics, Communalities Before and After Extraction, the Eigenvalues, and Percentage of One Extracted Factor (N = 171).
Note. ID = intellectual disability; PD = physical disability; VI = visual impairment.
Because participants used a Likert-type scale ranging from 1 to 5, it can be presumed that a mean score higher than 3 and lower than 4 would indicate moderate SE, 4 or above would indicate high SE, and below 3 would indicate low SE. It should be noted that no item had a mean score below 3 in the ID subscale, whereas two items in the PD subscale and six items in the VI subscale had a mean score below 3 (Table 2).
The first PCA was conducted on the ID subscale (11 items). The KMO measure verified the sampling adequacy for the analysis, exhibiting a KMO index of 0.937 and all KMO values for individual items >0.89, which is above the desired level of 0.70. Bartlett’s test of sphericity, χ2(55) = 1,738.7, p < .001, indicated that correlations between items were sufficiently large for PCA. An initial examination of the items using PCA revealed high communalities and ranged from 0.57 to 0.76 (Table 2). The K1 criterion and scree plot indicated a one-factor solution explaining 69.02% of the variance. There were 29 (43.50%) nonredundant residuals with absolute values greater than 0.05, suggesting an acceptable model fit.
A second PCA was conducted on the PD subscale of 12 items. The KMO measure verified the sampling adequacy for the analysis, and the KMO index of the PD subscale was 0.935. All KMO values for individual items were >0.90, which is above the desired level of 0.70. Bartlett’s test of sphericity, χ2(66) = 2,306.59, p < .001, indicated that correlations between items were sufficiently large for PCA. An initial examination of the items using PCA revealed high communalities and ranged from 0.70 to 0.77 (Table 2). The K1 criterion and scree plot indicated a one-factor solution explaining 73.45% of the variance (Table 2).
There were 32 (48.0%) nonredundant residuals with absolute values greater than 0.05, suggesting an acceptable model fit.
The third PCA was conducted on the VI subscale of 10 items. The KMO measure verified the sampling adequacy for the analysis and the KMO index was 0.93; all KMO values for individual items were >0.89, which is above the desired level of 0.70. Bartlett’s test of sphericity, χ2(45) = 2,303.34, p < .001, indicated that correlations between items were sufficiently large for PCA. An initial examination of the items using PCA revealed high communalities and ranged from 0.76 to 0.87 (Table 2). The K1 criterion and scree plot indicated a one-factor solution explaining 81.90% of the variance (Table 2).
There were 11 (24.0%) nonredundant residuals with absolute values greater than 0.05, suggesting an acceptable model fit. For all subscales, the numerical expressions made it possible to highlight the dominance of one factor in relation to other factors. Other factors’ eigenvalues were significantly less than 1. This suggests that the subscale items were unidimensional (Table 2).
The results of the EFA for different groups that were formed according to previous participation in an APE course or seminar indicated that participating significantly influenced the subscales’ structure. Table 3 describes the independent factor structures generated for those who attended (n = 33) and those who did not attend (n = 138) an APE course or seminar and compared with the structure provided by Block et al. (2013). KMO estimate and significance of Bartlett’s test of sphericity were suitable for EFA in both samples (Table 3).
EFA Results of PE Teachers’ Separate Groups’ Comparison With Block, Hutzler, Barak, and Klavina (2013) EFA Results.

Note. The factor labels in the Lithuanian case of sample N = 138 in all subscales, F1 = self-efficacy including students with SEN in PE class; the factor labels in the Lithuanian case of sample N = 33 in ID, F1 = staying on test and when teaching sport skills, modify test, equipment and actual skills, F2 = peers’ instruction, modify rules and stay on task during the game; in PD, F1 = modify the goals and the task, instruct peers during fitness testing, F2 = safety and modify equipment, F3 = peers’ instruction when teaching sport skills and during the game; in VI, F1 = inclusive when teaching sport skills and during the game, F2 = inclusive during fitness testing. The factor labels in the U.S. case of sample N = 243 in ID, F1 = peers’ instruction, F2 = staying on task; in PD, F1 = specific adaptations, F2 = peers’ instruction, F3 = safety; in VI, F1 = specific adaptations, F2 = peers’ instruction; EFA = Exploratory Factor Analysis; PE = physical education; APE = adapted physical education; KMO = Kaiser–Meyer–Olkin; ID = intellectual disability; PD = physical disability; VI = visual impairment; SEN = special education needs; Boldfaced values = the loadings values that were attributed to the appropriate factor, were bolded.
An integrated EFA and CFA was performed on the group of PE teachers who had not attended any previous APE training (n = 138). This sample was randomly divided into two groups (n = 69 cases in each half). An EFA was conducted on the first half of the data (group = 0) and a CFA on the second half (group = 1). Before conducting the PCA with the first half of the data (n = 69), we tested several of the statistical assumptions for such analyses. The KMO index was greater than 0.70 in each subscale: 0.911 (ID), 0.905 (PD), 0.909 (VI); Barlett’s test of sphericity was statistically significant (p < .001). These results indicate that the sample size was adequate and the extracted factors accounted for substantial observed variance. An initial examination of the items using PCA revealed high communalities, ranging from 0.69 to 0.81 (ID), 0.69 to 0.81 (PD), and 0.76 to 0.87 (VI). The K1 criterion and scree plot indicated a one-factor solution explaining 73.08% (ID), 71.83% (PD), and 81.28% (VI) of the variance. The results of the CFA (Figure 1) confirm the structure revealed in the EFA. To improve the model data fit, the Amos software automatically created a “modification index,” which suggested several errors (residuals, designated as an e + number in Figure 1) to be correlated. The chi-square was insignificant (model fit) in all models. The other goodness of fit measures also demonstrated an acceptable model fit. In the three evaluated models, the NFI and CFI exceeded the 0.90 cutoff criteria. In the ID and VI subscales, the RMSEA demonstrated good fit to the model, whereas in the PD a moderate fit (Figure 1).
Reliability Evidence
Cronbach’s alpha reliability for all items in each of the subscales is as follows: α for ID subscale (11 items) = .96 (M = 3.31, SD = 0.96), α for PD subscale (12 items) = .97 (M = 3.11, SD = 1.02), and α for VI subscale (10 items) = .98 (M = 2.84, SD = 1.12).
The Pearson correlation coefficient of SE-PETE-D-LT for assessing test–retest reliability was .70 (p < .01); correlation coefficients of each subscales are shown in Table 4.
Subscale Data for the Test–Retest Reliability (n = 22).

Correlation is significant at the .05 level. **Correlation is significant at the .01 level.
SE-PETE-LT Subscales’ Comparison
To explore the similarities and differences across subscales, mean subscales’ scores were compared using within-subjects one-way ANOVA. Statistically significant differences between subscales means were determined by one-way ANOVA, F(2, 510) = 12.213, p < .001, and follow-up post hoc analysis determined significant differences between the ID and VI (p < .001) and PD and VI (p < .05) subscales. VI (M = 2.84, SD = 1.12) was lower than both ID (M = 3.31, SD = 0.96) and PD (M = 3.11, SD = 1.02).
Discussion
The primary purpose of this study was to determine the structure and validity of the Lithuanian version of the SE-PETE-LT in a sample of Lithuanian PE teachers. The second purpose of this study was to indicate the associations between types of disability of students, personal attributes, and SE level of PE teachers.
The results analysis showed that the type of school (pro-gymnasiums, secondary schools, and gymnasiums) and type of response (web-based and paper-based) do not have significant influence.
The demographic factors analysis disclose that APE course or seminar had positive significant influence on PE teachers’ SE toward inclusion students with IDs, PDs, and VI in general education class. The results show that PE teachers, who had experience with students with VI in general PE class, have higher SE belief toward inclusion students with VI. Klassen and Tze (2014) found that when the PE teachers work in complicated conditions, their professionalism grows and their SE of the profession increases. Also, the results show that if the teachers had friends with IDs and VIs, then it has positive influence to PE teachers’ SE toward inclusion students with ID and VI in general PE class. These results confirm that friends play a significant role in the process of personal socialization. This means that teachers who have people with disabilities among their friends not only have more positive attitude toward the process of inclusion (Ilić-Stošović et al., 2015; Karani & Skordilis, 2016) but also have a higher SE level, when it is necessary to include students with disabilities in the general PE class. After completing the EFA for each subscale (ID, PD, and VI) of the SE-PETE-LT instrument, we found that all items in all subscales presented only one factor. The EFA in the different sample groups, which were formed according to different demographical factors, showed that PE teachers who attended an APE course or seminar influenced the structure of the subscales. Although the sample size was not large, we followed de Winter, Dodou, and Wieringa’s (2009) recommendations, suggesting that factor recovery can be reliable with sample sizes well below 50. The results of the group of PE teachers who attended an APE course or seminar showed some differences and similarities to the original SE-PETE-D scale (Block et al., 2013). In the Lithuanian case, the ID subscale consisted of two factors (in Factor F1, the questions related to staying on the task of fitness test and when teaching sport skills, modifying the test, equipment and actual skills; in Factor F2, the questions were related to peers’ instruction, modifying the rules, and staying on task during the game); the PD subscale consisted of three factors (in Factor F1, the questions were related to modifying the goals and the task, and instructing peers during fitness testing; in Factor F2, the questions were related to safety and modifying equipment; and, in Factor F3, the questions were related to peers’ instruction when teaching sport skills and during the game); the VI subscale consisted of two factors (in Factor F1, the questions were related to teaching the basic skills of the sport and playing the actual game; in Factor F2, the questions were related to physical fitness testing). Comparing the subscale’s structures of Block et al. (2013) with our study’s subscales’ structures, we found questions relating to instructing peers to help students with ID in the ID subscale in our case. Also, the study provided by Block et al. (2013) was essential for forming one of the factors. The PD subscale’s structure also had more similarities than differences with Block et al. (2013). In the Lithuanian version of PD subscale, the main areas of the structures are specific adaptation, safety, and peer instruction. In our study, one of the factors in the VI subscale structure consisted mostly of the physical fitness testing area; another factor involved teaching of sport techniques and including students with VI into an actual game, whereas in the case of Block et al. (2013), the study distinguished such factors as specific adaptation and peer instruction. In addition, we performed separate a factor analysis with the 138 sample size. We randomly split the sample of 138 teachers (who had not participated in an APE course) into two independent samples, and we again performed an EFA with one of them and a CFA with the other half. The results show one-factor structure in each subscale, and that the one-factor model in the each subscale was fit. EFA and CFA values show that this small sample’s results were significant. However, if the aim is to strengthen the separate analysis’ results, the replication analysis should be done with a larger sample.
According to Block et al.’s (2013) study, results show that more than 80% of the participants had experienced an APE course, seminar, or practicum session, but in our study case, we had the opposite situation (80% of the participants did not have experience with APE). Given these circumstances, we suggest that those PE teachers with less knowledge and experience are less differentiated in their SE regarding inclusion and adaptation. PE teachers with more training and experience appear to have a more differentiated perspective, one based on the knowledge bases they have acquired. PE teachers who had taken an APE course or seminar had a multidimensional structure in the questionnaire (of two or three factors, even though the items are not equally distributed as in the original; Block et al., 2013), and the other PE teachers (no APE course or seminar) had a unidimensional structure. This may explain the discrepancy between our results of EFA and original version’s results of EFA. According to scientists, cultural factors (Klassen, 2004) and performance experiences (Bandura, 1997) might influence both SE and responses to questionnaires.
We compared our survey results with those of surveys conducted by researchers in other countries (Table 5).
Comparison of Reliability and Construct Validity Results of Studies.

Note. EFA = Exploratory Factor Analysis; CFA = Confirmatory Factor Analysis; SE = self-efficacy; PE = physical education; ID = intellectual disability; CFI = comparative fit index; NFI = normal fit index; RMSEA = root mean square error of approximation; PD = physical disability; VI = visual impairment; APE = adapted physical education.
It is noticeable that Taliaferro et al. (2015) also indicated only one factor in each ID, PD, and VI subscale in their preliminary testing of survey participants prior to practicum intervention, whereas in Time 2 and Time 3 of EFA (which were performed after an APE training), the outcomes varied, suggesting a multiple-factor solution in each of these subscales. Taliaferro et al. (2015) proposed that the results of their factor analysis be interpreted in accordance with Osborne and Fitzpatrick (2012), suggesting that when the same model is applied to a new sample, the model is rarely as good a fit, and when the sample size is not met, the factor structure may not be stable or generalizable. Another validation example of SE-PETE-D was conducted in the Czech Republic by Baloun et al. (2016) and Kudláček et al. (2018), where no EFA but only a CFA was performed to confirm the factors revealed by EFA in the United States (Block et al., 2013). The CFA results by Baloun et al. (2016) and Kudláček et al. (2018) showed that the designed models of subscales ID, PD, and VI were a good fit (Table 5). However, the degree of inclusion within the Czech school system may have been different than that in the Lithuanian school system.
Cronbach’s reliability coefficients of every subscale are described in Table 5, in comparison with Cronbach’s reliability coefficients, which were obtained during studies made in other countries with SE-PETE-D subscales. As presented in Table 5, our results of the internal consistency analysis reached very strong reliability values (α for ID subscale = .96, α for PD subscale = .97, α for VI subscale = .98), which were within the range of the other studies, except for that of Baloun et al. (2016), who presented slightly lower values. It should be noted that Baloun et al. (2016) and Kudláček et al. (2018) used a different set of subscale questions than that used in our study
The results of the test–retest analysis indicated that the SE-PETE-D-LT instrument is sufficiently reliable. According to Vallerand (1989), a coefficient of .6 or more is sufficient for test–retest analysis. In our study, the pooled Pearson correlation coefficient of the subscales’ scores was greater than .6. The reliability measured in each subscale separately showed that only the ID subscale factor was slightly below .6. Czech researchers (Baloun et al., 2016) reported a study with 17 master students, and the test–retest results after 14 days showed test–retest Spearman reliability coefficients in the ID subscale (r = .78), PD subscale (r = .53), and VI subscale (r = .69). Given the similarly reliable results in the Lithuanian and Czech samples across different time spans (14 days through 14 weeks), it appears that the SE-PETE-D is reliable across repetitions.
Concerning our second purpose, we found differences in PE teachers’ SE across disability scenarios. The PE teachers who participated in the survey presented moderate SE toward including students with ID (M = 3.31, SD = 0.96) and students with PD (M = 3.11, SD = 1.02) and a significantly lower SE (p < .05) toward including students with VI (M = 2.84, SD = 1.12) in a mainstream PE class. Our findings are similar to those indicated in previous research that was not, however, supported with ANOVA. For example, the mean SE results of Jovanović et al. (2014) as well as of Hutzler and Shama (2017) indicated that sport and PE students’ SE was higher, referring to including students with ID or PD, compared with including students with VI. The SE study results of Baloun et al. (2016), who surveyed the last year of bachelor study, also revealed the tendency of SE to be higher in including students with PD compared with students with ID and VI. The results of Taliaferro et al.’s (2015) Course 1 and Course 2 Time 1 (before the practicum intervention) also indicated that SE was higher while considering the inclusion of students with PD than students with ID and VI. On the contrary, Reina et al.’s (2016) SE results showed a tendency for SE to be higher when including students with ID than when including those with VI and PD. Therefore, it can be concluded that the type of disability influences the teachers’ level of SE, and that the inclusion of students with VI into PE lessons appears to be a greater challenge for PE teachers than the inclusion of students with ID or PD.
Our study data also show that the PE teachers who had attended previous APE training presented higher SE than those who did not attend such training. This finding is supported by other researchers’ data with similar results (Hutzler et al., 2005; Taliaferro, 2010; Wang, Qi, & Wang, 2015). Presumably, such teachers may be influenced by the increased professional knowledge acquired during their training, which leads to greater competence in overcoming barriers when including students both with and without disabilities in their classes.
Limitations
Although not an integral part of the data collection, the research team noticed that while filling in the questionnaires, the PE teachers expressed negative opinions, such as the following: “it is not relevant for us,” “it’s nonsense,” “these pupils should go to special schools,” “these pupils are exempted from PE classes,” “we are not ready for that,” or “it is impossible to run a PE class while including children with disabilities into general activities.” Such reactions of the survey participants imply that although most students with disabilities are placed in general education schools, the teachers may not yet be prepared for their inclusion, and oftentimes some of these students may not actually participate in the PE practices. Either they attend special PE sessions or are exempted from PE classes (when a medical certificate is issued). Although our study did not pursue the goal of capturing and analyzing the reactions of the research participants, we believe that such comments given by the participants while filling in the questionnaire may explain the EFA result of the Lithuanian version of the instrument. A similar pattern of unidimensional SE subscales with moderate SE was also reported in a recent study on Arabic-speaking PE teachers in Israel (Hutzler & Shama, 2017). In this regard, Heslin and Klehe (2006) claim that in the case of complex and unusual tasks, high SE levels lead people to analyze and to look for ways and strategies, but not to look for excuses, as may have been the case in our study. According to Heslin and Klehe’s (2006) theory, it may be suggested that PE teachers who had low SE imagined negative consequences, revealing their incompetence toward the situations narrated in the questionnaires. Therefore, due to their perceived failure, these teachers were likely to blame the situation itself, in addition to faulting other persons. We believe—and evidence supports—the notion that adapted PE training increases teachers’ SE (Hutzler et al., 2005; Taliaferro et al., 2015). Certainly, forming clear guidelines and position statements in favor of inclusive practice might lead to favorable attitudes and the likelihood of experimenting with APE solutions, thereby gaining SE.
The one-factorial structure of the subscales could also have been influenced by the size of the sample. Field (2009) and Osborne and Fitzpatrick (2012) argue in their respective studies that EFA is influenced by the sample size. Osborne and Fitzpatrick (2012) recommend an appropriate sample size for EFA, ranging between 5 and 20 participants per scale item. However, Costello and Osborne (2005) mention not only that a factor analysis can be carried out with fewer people (the proportion of 5:1 or less) but also that one should be cautious when interpreting the results. In our study, only a minimal sample requirement was realized. Therefore, it would be helpful to determine what the impact of a larger sample size would be on the breakdown of the instrument subscales’ factors. However, it should be noted that the current study, as well as that of Taliaferro et al. (2015), included practicing PE teachers, whereas the SE-PETE-D scale was developed based on a PETE student sample. There may be salient differences between practicing teachers and those who are still in their education track, which also may have led to the structural differences obtained in these studies.
Conclusion and Future Research
Based on these preliminary results, SE-PETE-D-LT appears to be a valid and reliable instrument. It may be suggested that the SE-PETE-LT version is an appropriate instrument for measuring SE toward including students with ID, PD, and VI in PE frameworks. However, we found differences in the factor structure between the Lithuanian and the original version of the SE-PETE-D. Based on the results obtained, we assume that the structural differences in subscales could have been caused by (a) the participants’ level of professionalism, participants in this study were practicing PE teachers as opposed to PETE students as was the case in the original study (Block et al., 2013); (b) cultural differences, as the survey was performed in Lithuania, where inclusion has only recently been legislated and implemented compared with a longer educational inclusion history in the United States; and (c) participation in previous APE training (courses or seminars) during or after their studies. Based on our findings, it may be suggested that multidimensional versus unidimensional solutions should be differentially utilized while assessing teachers with or without an APE training experience, respectively.
Our secondary finding—that PE teachers’ SE scores toward including children with ID or PD are higher than those toward including children with VI—may be utilized to improve study programs for the preparation of future PE teachers and to stimulate the effective inclusion process in general PE classes. It is recommended that these programs place an emphasis on the adaptation processes in PE with children who exhibit those disability conditions that are less frequent and that require specialized knowledge and experience. Also, we found that the PE teachers, who had students with VI in general PE class, have higher SE belief toward inclusion students with VI, and the PE teachers, who have friends with IDs and PDs, have higher SE belief toward inclusion students with IDs and PDs. Considering this study’s preliminary results, there is a need to perform more detailed research (to include greater sample size), which could reveal demographic factors and other personal attributes, which can influence the SE level toward inclusion students with disabilities.
Footnotes
Declaration of Conflicting Interests
The author(s) declared no potential conflicts of interest with respect to the research, authorship, and/or publication of this article.
Funding
The author(s) received no financial support for the research, authorship, and/or publication of this article.