
Abstract
This study employed a mixed-design approach and the Many-Facet Rasch Measurement (MFRM) framework to investigate whether rater bias occurred between the onscreen scoring (OSS) mode and the paper-based scoring (PBS) mode. Nine human raters analytically marked scanned scripts and paper scripts using a six-category (i.e., six-criterion) rating rubric. Interviews with these raters were then conducted to gather their reflections concerning the marking experiences in the two modes. Software program FACETS was employed to estimate raters’ scores, with the results indicating that (a) four raters marked the scanned scripts more severely than they did the paper scripts, whereas the remaining four raters exhibited an opposite tendency; (b) the only rater whose composite scores were comparable between the two modes still awarded harsher scores to the category of Mechanics in PBS mode; and (c) the category of Mechanics was scored more harshly in OSS mode, whereas Topic Development/Support was scored more severely in PBS mode. Analyses of quantitative and qualitative data indicated that computers affected raters’ marking behaviors and their assessment, assuming a role in causing scoring bias. Implications for rater training were provided.
Introduction
With the continual advances in information technology and the widespread use of the Internet, many test development agencies have replaced traditional paper-based scoring (PBS) with onscreen scoring (OSS), also known as onscreen marking (OSM; Bennett, 2003; Chen, White, McCloskey, Soroui, & Chun, 2011; Coniam, 2011b; Hunsu, 2015). The two modes differ greatly in how testees’ writing is presented to human raters. In PBS mode, human raters read and score testees’ handwritten essays on paper. By contrast, in OSS mode, the handwritten essays are scanned and saved as PDF (or other image files) within the test administrators’ servers, and raters then retrieve, read, and mark the scanned scripts from computer screens in OSS centers or remotely via the Internet. In 2007, this mode was first implemented in Hong Kong; in 2011, Taiwan applied it to the General Scholastic Ability Test (GSAT)—a nationwide, mandatory, and high-stakes test for college admission. In other countries, such as China, Australia, India, and the United Kingdom, OSS mode has also been introduced into their testing systems (Coniam, 2011a). As OSS mode allows raters to mark scanned handwritten scripts at any time and location with an online connection and permission to access the OSS servers, this significantly increases assessment efficiency by reducing any constraints of time and location.
Most importantly, to make a successful switch from PBS to OSS mode, a necessary, yet not sufficient, condition must be met: Raters must still mark scanned scripts similarly to how they would mark the paper counterparts. In other words, when a computer is used as a display medium, it should not affect human raters’ marking behaviors and cause biased assessment. The present study, therefore, adopted a mixed-design approach and the Many-Facet Rasch Measurement (MFRM) framework to explore whether nonnative English raters would mark essays written by English as a Foreign Language (EFL) college students in an unbiased manner between the two modes. Relying on the empirical evidence obtained from the present study, test development agencies may design and provide effective rater training to ensure that their raters will award unbiased scores, particularly in OSS mode.
Comparability of OSS Mode and PBS Mode
Comparability of OSS mode and PBS mode indicates that raters award fair and unbiased scores to essays, regardless of whether such essays are presented on paper or displayed on computer screens. On the contrary, if comparability is compromised, it suggests that raters’ scoring severity or leniency between the two modes is dissimilar. As Bennett (2003) cautioned, “if scores are not comparable across delivery modes, scoring presentation, or computer platforms, and the test varies along one or more of these dimensions, the decisions we make from assessment may be wrong” (p. 2). For all test stakeholders, comparability must be ascertained, before the innovative OSS mode can fully and confidently replace the traditional PBS approach, particularly when those raters who are veterans in PBS mode but novices in OSS mode are invited to mark scanned scripts (Coniam, 2009).
To test comparability, one line of research has explored whether distinctive procedures of carrying out OSS and PBS tasks would factor in raters’ judgments. For instance, Adams (2005) observed that in OSS mode, once scores were submitted online and registered in the test agency’s servers, access to previously marked scripts would be denied. This setup meant that it would not be possible for raters to review testees’ scripts and reconsider or change their original scores. On the contrary, in PBS mode, raters are given batches of physical paper, so finding temporarily scored scripts and rescoring them poses little problem. As such, Adams suggested that denying or allowing access to previously or temporarily marked scripts distinguished the two modes and detrimentally affected comparability. Moreover, Coniam (2009) researched comparability in the Hong Kong public examination system (administered by the Hong Kong Examinations and Assessment Authority [HKEAA]) by inviting 30 raters to mark the English scripts of the Hong Kong Certificate of Education Examination (HKCEE). Twenty-five raters were veterans who had marked HKCEE English scripts in both modes, whereas the remaining five raters were experienced only in PBS mode and were new to OSS mode. All raters followed the procedures as regulated by HKEAA to carry out their tasks, with each rater marking 100 HKCEE 2007 English scripts initially from computer screens before marking the paper counterparts of same scripts. The results showed that 20 out of the 30 raters negatively criticized OSS in terms of its unfavorable procedures, such as the inconvenient travel to marking centers, inflexibility when marking scripts, and difficulty in adding onscreen comments. Nevertheless, despite these criticisms and inconvenience, the high interrater reliability index (i.e., .88) for the overall scores of these raters drove Coniam to conclude that “the marking medium would not affect test takers’ scores, irrespective of whether their scripts were marked on screen or on paper” (p. 257). In other words, raters’ new experiences in OSS mode and their negative affect toward OSS did not compromise comparability. Taken together, while Adams identified incomparability, Coniam found counterevidence. This inconsistency calls for additional research efforts to clarify whether marking would be variation free between the two scoring modes.
Other lines of research have investigated the effects of annotations such as commenting, circling, and underlining on raters’ marking results (Johnson, Hopkin, Shiell, & Bell, 2012; Johnson & Shaw, 2008; Shaw, 2008). Crisp and Johnson (2007) recruited 12 experienced raters to mark scripts written for the General Certificate of Secondary Education (GCSE) Mathematics and Business Studies qualifications in the United Kingdom. Their study found that the use of annotations was beneficial for conventional paper-based marking due to its justificatory and facilitation functions. Crisp and Johnson argued that annotations functioned as visual maps to illuminate raters’ considerations and reasons for their assessment, so other raters or supervisors could evaluate and justify whether these scores and judgments met the established standards (i.e., the justificatory function). In addition, raters used annotations as references to estimate and determine writing quality, so their final judgments would be more nuanced (i.e., the facilitation function). Later, Johnson and Nádas (2009) investigated whether U.K. raters would annotate scanned scripts and their paper counterparts in a dissimilar fashion. Twelve raters were invited to mark 180 scripts selected from papers written for GCSE English Literature. The findings showed that raters annotated less often onscreen than they did on paper, as onscreen annotations demanded more mental effort when compared with on-paper annotations. Moreover, adding or choosing pertinent annotations onscreen was more difficult and less flexible than doing so on paper. Nevertheless, aside from these annotation burdens, Johnson and Nádas still found that all raters assigned comparable scores between the two modes, because “on-screen annotation could contribute to the development of good mental representations of texts on screen” (p. 323). In line with this finding, Coniam (2011a) declared that annotating digital texts onscreen was more problematic than annotating paper-based texts because raters tended to be more accustomed to handwriting their comments rather than typing them. Even so, benefiting from onscreen and on-paper annotations, these raters assigned comparable scores to scanned scripts and paper counterparts after their thinking and judgments had been clarified. As Coniam (2011b) observed, “results of more recent studies, nonetheless, point toward the comparability of paper and screen-based marking in terms of the reliability of the results between the two modes of marking” (p. 1043). From this standpoint, both onscreen and on-paper annotations may assist raters in reflecting, strengthening, and clarifying their assessment, thus resulting in high comparability between the two modes.
On the contrary, another line of research has identified counterevidence for the positive relationship between onscreen annotation and rating quality. For instance, Hunsu (2015) argued that raters were also readers; when marking scripts for a test, raters were required to read these written texts carefully and went on to select a score that accurately reflected the quality. Given that raters’ reading behaviors may differ in the two scoring modes, it is quite likely that raters scored scanned essays and their paper originals at differing levels of severity. To illustrate, Mangen, Walgermo, and Bronnick (2013) indicated that readers comprehended paper-based essays better than computer-displayed ones, arguing that the act of scrolling deteriorated readers’ mental representations of the onscreen text. Fowles (2008) investigated the reliability of five raters’ composite scores assigned to paper scripts and their scanned counterparts, using a GCSE English examination answer sheet. When marking these scripts onscreen, the raters could make annotations using a tool (i.e., CMI). To use this tool, the raters had to scroll up and down to read the contents and then insert their comments. However, these behaviors were found to interrupt and interfere with raters’ thinking flows and assessing processes. In addition, Shaw (2008) observed that onscreen navigation in OSS mode hindered a rater’s thinking, so it would “impact negatively on examiner understanding of the marking criteria” (p. 13). As such, making onscreen annotations may distort the reading of raters, thus impeding their marking processes and eventually deteriorating comparability. Strictly speaking, in OSS mode, these interferences or interruptions caused by onscreen annotations may lead raters to award different scores to scripts that are equivalent in quality but different in format, consequently leading to an unwelcome lack of comparability. Taken together, the existing research has not revealed any congruous findings regarding comparability between the two scoring modes. Further studies should be conducted to clarify this perplexing issue.
It is worth mentioning that several studies conducted in the United Kingdom and Hong Kong have lent substantial support to comparability (Coniam & Yan, 2016; Johnson et al., 2012; Johnson, Nádas, & Bell, 2010; Raikes, Greatorex, & Shaw, 2004). In these studies, the rater scores awarded to scanned scripts and paper originals were analyzed and contrasted by computing interrater indexes such as exact agreement indexes, Cohen’s κ, Pearson’s r, Kendall’s τ−b, or intraclass correlation coefficients (ICCs). The higher these indexes were, the higher the degree of rater consensus and consistency they indicated, as well as suggesting a higher comparability between the two modes. However, what an interrater reliability index specifies is the extent to which raters have consistently marked scanned and/or paper scripts; they do not imply these scripts be marked at the same level of leniency or severity across raters and/or between the two modes. For instance, Eckes (2011) posited that “the rater severity effect occurs when raters provide other ratings that are consistently either too harsh or too lenient” (p. 15). In this respect, some raters may mark scripts more harshly than others. However, if these raters award scores in a consistent manner without altering levels of their severity or leniency throughout the entire scoring processes, their scores will remain highly reliable, if biased (Heller, Sheingold, & Myford, 1998). Should this occur, it will be unfair for the testees assessed by the severe raters to receive harsh scores on their written scripts, when others producing equivalent quality of scripts receive lenient scores from other less severe raters. From this perspective, although interrater reliability indexes may illuminate how consistently raters mark scripts, researchers should consider the rater severity effect to explore comparability in a more thorough fashion. To fulfill this goal, the MFRM framework that includes raters’ severity (i.e., rater bias) as a component of writing assessment may be adopted (Linacre, 1989).
Rater Bias and Rating Categories (Rating Criteria)
For all test stakeholders, human raters must mark scripts both consistently and fairly—no matter whether these scripts are presented onscreen or on paper (Brown, 1995; Congdon & McQueen, 2000; Elder, 1997). Fairness in marking demands that raters strictly follow the established benchmarks or guidelines to judge the quality of written products. Scores that are either too lenient or too harsh reflect rater bias. Biased scores must be avoided as they fail to meet the shared scoring standards and indicate testees’ writing proficiency. However, even experienced raters may still tend to mark scripts in a biased manner, albeit unintentionally. In analytical scoring, rater bias is observed in those who have either assigned too harsh or too easy scores to different rating categories (i.e., the rating criteria; Eckes, 2008; Matsuno, 2009; McNamara, 1996; Weigle, 1998). For instance, a study by He, Gou, Chien, Chen, and Chang (2013) invited four veteran raters to mark 240 paper scripts of EFL college students using a six-category scale. The raters’ scores for each category were analyzed, with the results indicating that the raters awarded the most severe scores to the category of Language Use and the most lenient ones to Content. Similarly, Schaefer (2008) invited 40 native English speakers to analytically mark 121 EFL paper scripts. By examining the scores for each category, some native raters were found to be more lenient when scoring the categories of Language Use and/or Mechanics, yet more severe when scoring Content and Organization. However, other raters displayed an opposite scoring pattern. Eckes (2012) also concluded that “criteria perceived as highly important were more closely associated with severe ratings, and criteria perceived as less important were more closely associated with lenient ratings” (p. 270). As noted, raters’ inconsistent severity or leniency leads to their biased scoring for distinctive categories in PBS mode, which may further account for why incomparability has been observed between PBS and OSS modes. Nevertheless, because most studies have probed single, holistic assessment scores for individual scripts, rather than scores for each category, it is still blurred as to whether rater severity would result in biased and incomparable scores.
Rationale and Research Questions
As Coniam (2011b) argued, “while scripts can be annotated in OSM, markers said it was much harder to do in OSM” (p. 1047). Despite that Johnson et al. (2012) did not observe any mode effect on raters’ markings, they still urged more research to clarify whether complex navigation and annotation in OSS mode would increase raters’ cognitive load, influence their reading processes and marking behaviors, and result in unfavorable incomparability. Moreover, He et al. (2013) pointed out that “raters who believe certain categories are important or unimportant for text quality will tend to assign them unexpectedly harsh or lenient scores” (p. 480). As suggested, in analytical scoring, treating rater bias as a component of assessment and then testing its impact on raters’ scores for individual rating categories must be done to explore comparability in a more in-depth fashion. In addition, Johnson et al. (2012) reported that “the experience levels of the examiners in this study also potentially help to explain the lack of mode effect on outcomes despite the observed effects on their marking behaviours” (p. 120). When those raters who are experienced in PBS mode but new to OSS mode are recruited to mark scanned scripts for high-stakes tests in EFL countries (e.g., GSAT in Taiwan) or in English-speaking universities (e.g., placement tests for non–English-native students), it will be of principal significance to investigate the comparability of their scores between the two modes. Most importantly, Eckes (2011) cautioned that “high reliability may lead to the wrong conclusion that raters provided highly accurate ratings when in fact they did not” (p. 29). As such, a different assessment framework such as MFRM that estimates biased markings by calibrating intra- and interscorers’ severity/leniency is called for. Prompted by these propositions, the present study aims to answer the following two questions:
Method
The MFRM Model
To answer the two proposed research questions, the present study established a four-facet MFRM model. An MFRM model is a logistic latent trait one in which any potential factors that are hypothesized to affect rating severity can be treated and analyzed as individual facets (Johnson & Lim, 2009; Kondo-Brown, 2002; Lim, 2011; Rasch, 1960; Schaefer, 2008; Shi, 2001; Winke, Gass, & Myford, 2012). The existing research substantially attests the applicability of MFRM. For instance, Breland, Lee, and Muraki (2005) adopted MFRM to research rater bias, finding that raters in general “have slight tendencies to be more lenient toward handwritten essays than typed essays” (p. 593). McNamara and Knoch (2012) also described MFRM “as a useful tool in the armory of language testing researchers, especially in performance assessments” (p. 569). As suggested, MFRM should be an appropriate framework for exploring rater bias in the assessment of EFL testees’ written performances.
The four-facet MFRM model can be mathematically expressed as

where Pniljk = probability of testee n receiving a score of k from rater j on rating category i for mode l; Pnilj(k − 1) = probability of testee n receiving a score of k − 1 from rater j on rating category i for mode l; θ n = proficiency of testee n; β i = difficulty of category i; δ l = difficulty of mode l; α j = severity of rater j; τ k = difficulty of receiving k score.
As the equation indicates, the four facets were (a) college teachers as human raters, (b) EFL college students as testees, (c) the two scoring modes of OSS and PBS, and (d) six rating categories. As emphasized by Eckes (2011), “when a MFRM analysis is run, the specified facets are analyzed simultaneously and calibrated onto a single linear scale” (p. 35). In a similar manner, the joint calibration of the MFRM model places parameter estimates of the four facets on the logit scale. Measurements (as the unit of logit) of individual raters, testees, scoring modes, and rating categories could then be contrasted to assess those differences that indicated rater bias for each facet. Moreover, the MFRM model allowed multiple facets to be estimated simultaneously; thus, it became possible to pinpoint any interactional bias patterns between and among the facets. For instance, different raters’ logits on a category were compared to estimate whether one rater scored this category more severely but more leniently by others. Taken together, the MFRM model calibrated, analyzed, and contrasted measurements of the four facets to pinpoint and elucidate rater bias.
Student Participants
To gather English handwritten essays, 250 college freshmen (aged between 18 and 20 years) enrolling in two prestigious national universities in Taiwan were invited. Before the onset of the data collection, all student participants had received English composition instruction from their high school teachers, because the completion of GSAT was mandatory for college application and admission. In addition, when the present study was conducted, student participants were taking part in the second term of Freshman English to improve their English reading and writing skills. Nevertheless, because student participants were randomly selected from different departments (ranging from Engineering to English), their writing proficiency was expected to be varied across academic disciplines. This expectation was further confirmed after the composite scores awarded to student participants’ essays were analyzed: The grand mean was 34.75 on a 60-point scale, with a standard deviation of 8.27 and a range of 46 (between 11 and 57). As the present study aimed to identify rater bias involving the two formats and individual categories, the overall quality of the student participants’ essays was not a primary concern. However, as the descriptive statistics indicated, although student participants were varied in their writing proficiency, most had still cultivated the basic skill necessary to complete English writing tasks for the present study.
Writing Task
To gather writing samples, all student participants were asked to compose their essays during their Freshman English classes under the teachers’ supervision. Every student participant was explicitly instructed to use pen when writing a four-paragraph essay on A4-sized paper. The given prompt requested the participants to describe two reasons to justify why the use of automobiles should be avoided in an overpopulated city. This argumentative prompt was adapted from the TOEFL Test of Written English Guide (TWE; 1996), published by the Educational Testing Service (ETS). This prompt was used because the student participants have resided in metropolitan areas for years and would have frequently experienced traffic jams caused by an excessive number of automobiles. For this reason, student participants should not have found it difficult to present, illuminate, or justify their arguments or opinions as they associated their ideas and thoughts with previous living experiences. In addition, resources such as dictionaries or the Internet access were not made available to the student participants, and they were advised to keep their handwriting as clear and readable as possible. However, the use of white-out correction tapes was encouraged but not required. All student participants were given 40 min to complete their writing tasks. After the handwritten essays were compiled, half (N = 125 essays) were randomly selected, scanned, and converted into PDF files. The other half (N = 125) were photocopied. Subsequently, the PDF files were saved onto a CD, whereas the photocopied essays were assembled into batches for further assessment. Raters were required to mark all 250 scripts, whether presented on paper or onscreen.
Raters
Nine raters (nonnative English-speaking [NNES] raters) were invited to mark the student participants’ scripts. All raters were female college teachers with English-related postgraduate degrees (in the fields of linguistics, translation, TESOL, and literature) awarded by prestigious American, British, or Australian universities. Their average experience of college-level teaching was 11.67 years, which indicated that the raters had all accumulated an ample amount of EFL teaching proficiency. Moreover, as these raters continuously offer writing courses in college, they are experienced in marking paper-based essays written by EFL college students. By contrast, despite their lengthy teaching careers, all raters had not yet been invited by any testing agency or researcher to mark English scripts onscreen. Thus, before the actual commencement of the present study, these raters were new to OSS mode. It is also worth noting that, as Yan and Coniam (2013) argued, raters’ computer competency may affect their OSMs. Because all raters in the present study were familiar with computer-based technologies, conducting any computer-related activities—such as using an optical mouse, opening files, making onscreen annotations, or scrolling between pages—did not put them at any disadvantage.
Scoring Tasks
The raters carried out their OSS and PBS tasks at their own workstations. The scoring procedures were explained in detail to the raters first, and then the researcher carefully discussed the six categories and their descriptors (cf. appendix). These categories were adapted from the previous analytical criteria proposed by He et al. (2013). The categories of Topic Development/Support and Organization were used to assess how well the student participants had presented, developed, supported, and organized the topic and the main ideas in their scripts (Lumley, 2002). Language Use and Mechanics were used to evaluate how accurately the student participants had constructed phrases/sentences, and how successful they were in attending to the technical aspects of their writing (e.g., spellings, punctuations, capitalizations; Kondo-Brown, 2002). Vocabulary/Expression and Length were the two standards employed to appraise how appropriately student participants had selected words, constructed expressions, and managed lengths of their scripts at the syntactical level (Schaefer, 2008).
It is worth noting that although the raters were knowledgeable in computer-related technologies, they were engaging in OSM for the first time. Therefore, to help these raters perform OSS tasks appropriately, the researcher first demonstrated how to mark scripts from computer screens. Then, all raters participated in a brief training session to practice the procedures of OSM. Upon feeling confident and competent in carrying out these OSM procedures, the raters commenced their tasks by awarding a score to each of the six categories on a 10-point scale in both modes, with 1 being the lowest score and 10 being the highest. All raters were requested to complete their tasks within 1 week.
To test any order effects, four raters were randomly selected and assigned to the PBS-First group to conduct the PBS tasks first followed by the OSS assignments, whereas the other five raters were classified as the OSS-First group to carry out their tasks in an opposite order. Once the marking of all scanned or paper scripts was completed, the raters started to assess the other form of script. To mark scanned scripts, the raters opened PDF files using Adobe Reader XI—installed on a laptop computer with a 14-inch LCD screen at a resolution of 1,366 × 768 pixels. Figure 1 provides a sample page layout of the scanned scripts. The onscreen page layout reflected the actual paper size, and the commenting and highlighting tools were activated for raters to insert onscreen annotations and temporary scores for each category. Similarly, in PBS mode, the raters were permitted to pen down their annotations and scores on paper scripts. In both modes, the raters could retrieve temporarily marked scripts to reconsider, and even change, their original scores.

Page layout of scanned essays on screen.
After deciding upon a final score on either a paper script or a scanned one, the raters were required to enter this into Excel spreadsheets, then saved onto a flash disk provided by the researcher. These disks were then sent back to the researcher to perform the MFRM analysis. It should be noted that the raters were clearly informed that once their final scores were registered in the Excel spreadsheet, no alterations could be made. This regulation was modeled upon the most standardized writing tests administered in Taiwan. To ensure this regulation was strictly followed, the researcher—who had activated Track Changes in Excel—scrutinized the returned Excel spreadsheets. Because no changes were observed, this indicated that all raters complied with this regulation.
The present study duplicated each student participant’s essay into either a paper script or a scanned one; therefore, the raters would not mark any duplicated scripts penned by the same student participant. There were two reasons for taking this measure. First, the present study was not intended to use interrater reliability as a comparability index; therefore, gathering paired scores on the two forms of the same essay would be pointless. Second, as Eckes (2011) emphasized, an MFRM analysis would yield a separate parameter for each facet, and “the parameters denote distinct attributes of the facets involved” (p. 34). Because the MFRM model already included two scoring modes as a facet, the rater severity effect (i.e., rater bias) would be calibrated if student participants’ essays were specified as either scanned scripts or paper ones in the model. As the present study performed an MFRM analysis, duplicating an essay into both digital and paper formats was not necessary.
Quantitative Data Analysis Tool: FACETS
The present study applied FACETS to analyze raters’ scores for each rating category. FACETS is a Rasch computer program that calibrates facets in terms of logits for an MFRM model (Linacre, 2002). As Linacre (2011) observed, FACETS “assists in many applications of the Rasch model, particularly in the areas of performance assessment and paired comparisons” (p. 13). Because the present study adopted the MFRM framework to test rater bias in assessment of EFL college writers’ written performances between the two modes, FACETS should be an appropriate and effective tool.
Raters’ Reflections on Marking Paper Scripts Versus Scanned Scripts
To gather raters’ reflections on their marking experiences, semi-structured interviews were administered following the marking stage. Raters were asked to provide their responses to open-ended questions. These questions were adapted from a study by Johnson et al. (2012) and aimed to explore raters’ opinions concerning five aspects of their marking experiences. These aspects were (a) any difficulty in marking and annotating scanned scripts and paper scripts, respectively; (b) any difference and/or difficulty in marking scripts between the two modes; (c) any difference and/or difficulty in retrieving temporarily marked scripts in respective modes; (d) any difference in confidence in consistently and accurately marking scripts between the modes; and (e) the impacts of different annotation practices on marking scripts between the modes. Raters’ responses were audio recorded, transcribed, and then coded into themes per these aspects to locate any evidence that might supplement or validate quantitative results. Sample questions included the following: Do you feel there were any differences between marking paper scripts and scanned scripts? Will scrolling between onscreen pages influence the way you mark scripts? Will annotating (i.e., inserting comments and highlighting text) paper scripts and scanned scripts be different? Will these differences impact your marking?
Results
The Order Effect
To test the possible order effect, each rater’s scores for the six categories were aggregated into a single composite score and then FACETS was performed to yield the logits for the PBS-First and OSS-First groups, respectively. To eliminate any negative values, the logits were linearly transformed into scores on the W scale developed by Woodcock and Dahl (1971), using a formula expressed as W = 9.1024 × logits + 500 (Schaefer, 2008; Woodcock, 1999). Because each of the 250 student participants received two positive W scores from respective groups, a paired-sample t test was performed. The result (t = 0.02, p > .05) indicated that there was no significant order effect on raters’ marking scripts presented in different mediums. This suggested no order effect on raters’ assessment.
Model Fit
FACETS produced measurements of each facet and Table 1 reports these results. As Table 1 shows, all infit and outfit statistics for the three facets fell within the acceptable range of 0.05 and 1.5 (Linacre, 2002). This suggested that there should not be any misfit and that the proposed MFRM model reasonably fit the data (Eckes, 2008; Johnson & Lim, 2009). In addition, to assess whether raters behaved independently, Rasch–Cohen’s kappa was computed (Linacre, 2011) and found to be .05. Because .05 is close to 0, it indicated that raters not only consistently marked scripts but also independently did so (Eckes, 2012; He et al., 2013). Meanwhile, to appraise the proper functions of the six rating categories, three criteria and their cutoff thresholds were adopted: (a) Outfit mean squares were smaller than 2; (b) Rasch–Andrich thresholds advanced monotonically, albeit by less than 5.0 logits; and (c) average measures advanced monotonically. Table 2 reports statistics for the scale structures of the categories. As shown in Table 2, all outfit mean squares were smaller than 2, falling between 1.6 and 0.80. As the category scores increased from 1 to 10, the Rasch–Andrich thresholds also monotonically increased from −5.13 to 5.79. The logits for the advances in these thresholds were between 2.23 and 0.70, all smaller than 5.0 logits. In addition, averaged measures increased as category scores increased. These results all attested to the proper functions of all six categories. As these fit statistics suggested, the MFRM model fit the data, raters acted as independent raters, and the 10-point scale was appropriate for the six categories. Thus, calibrations produced by FACETS would be highly trustworthy.
Measurements of Facets.
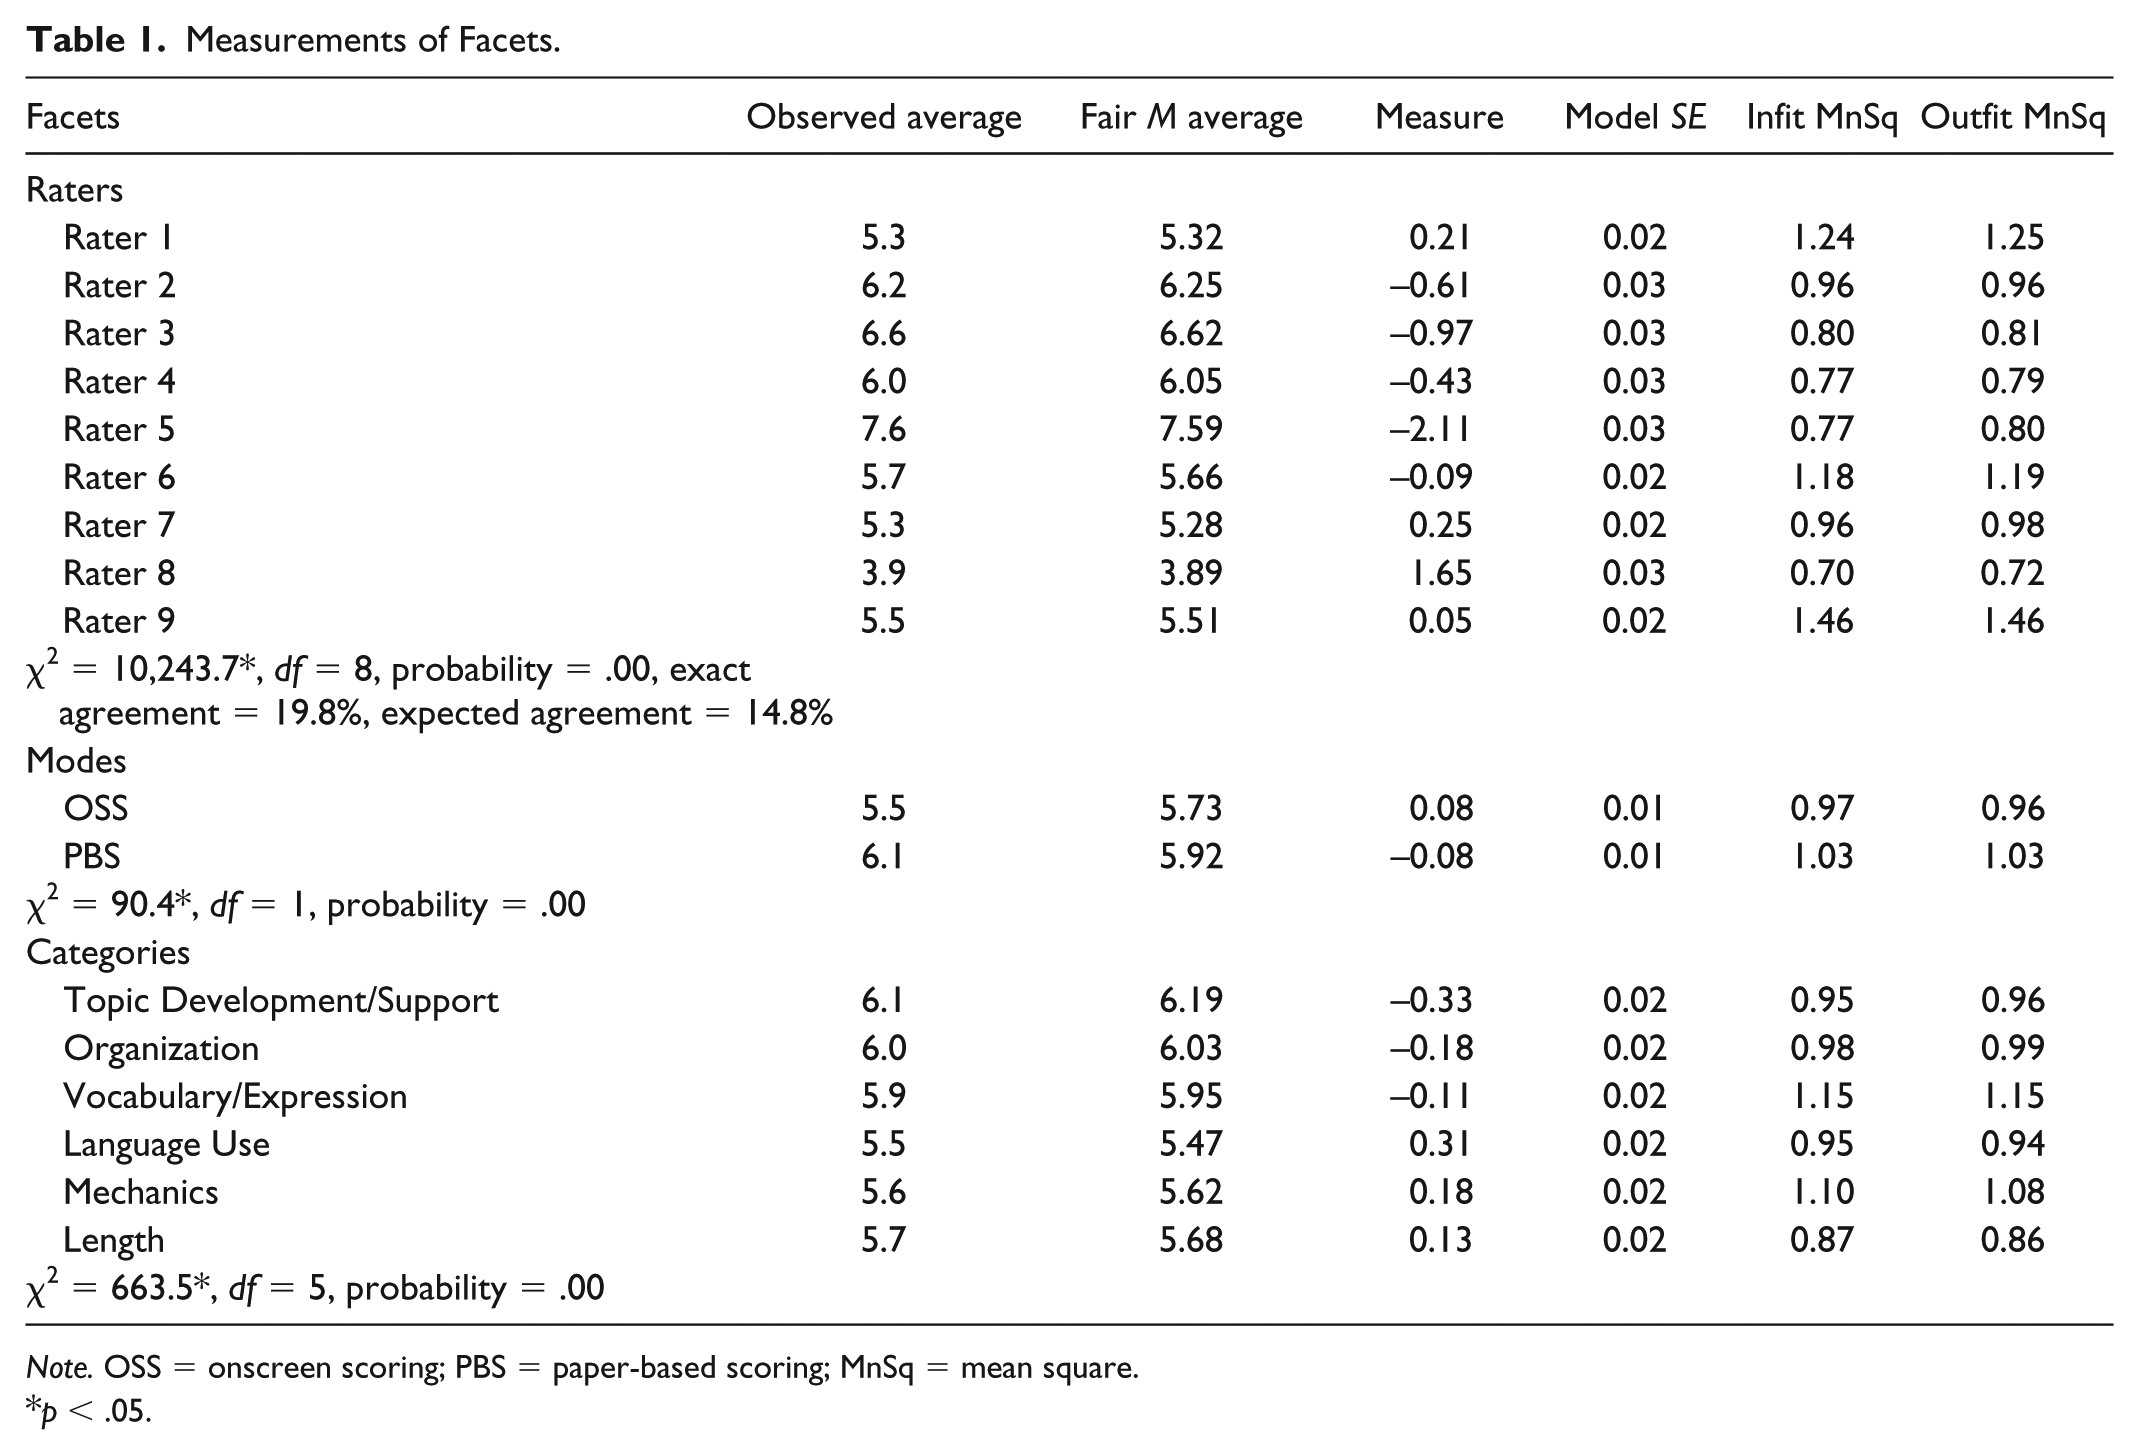
Note. OSS = onscreen scoring; PBS = paper-based scoring; MnSq = mean square.
p < .05.
Statistics for Scale Structure of Rating Categories.

Note. MnSq = mean square.
Rater Bias in Scores Assigned to Scripts and Categories
To visualize the severity hierarchies for raters, scoring modes, and rating categories, vertical rules were provided. As Figure 2 illustrates, overall raters scored the scanned scripts and paper scripts with differing levels of severity. The significant chi-square statistic (90.4, p < .05) further indicated that raters were overall more severe in OSS mode than in PBS mode (see Table 1). In other words, raters gave harsher scores to scanned scripts than they did to paper-based scripts. The other two significant chi-square statistics for the facets of raters and categories implied that at least one of the nine raters assigned biased scores to one or more categories, either in one mode or between the two scoring modes.
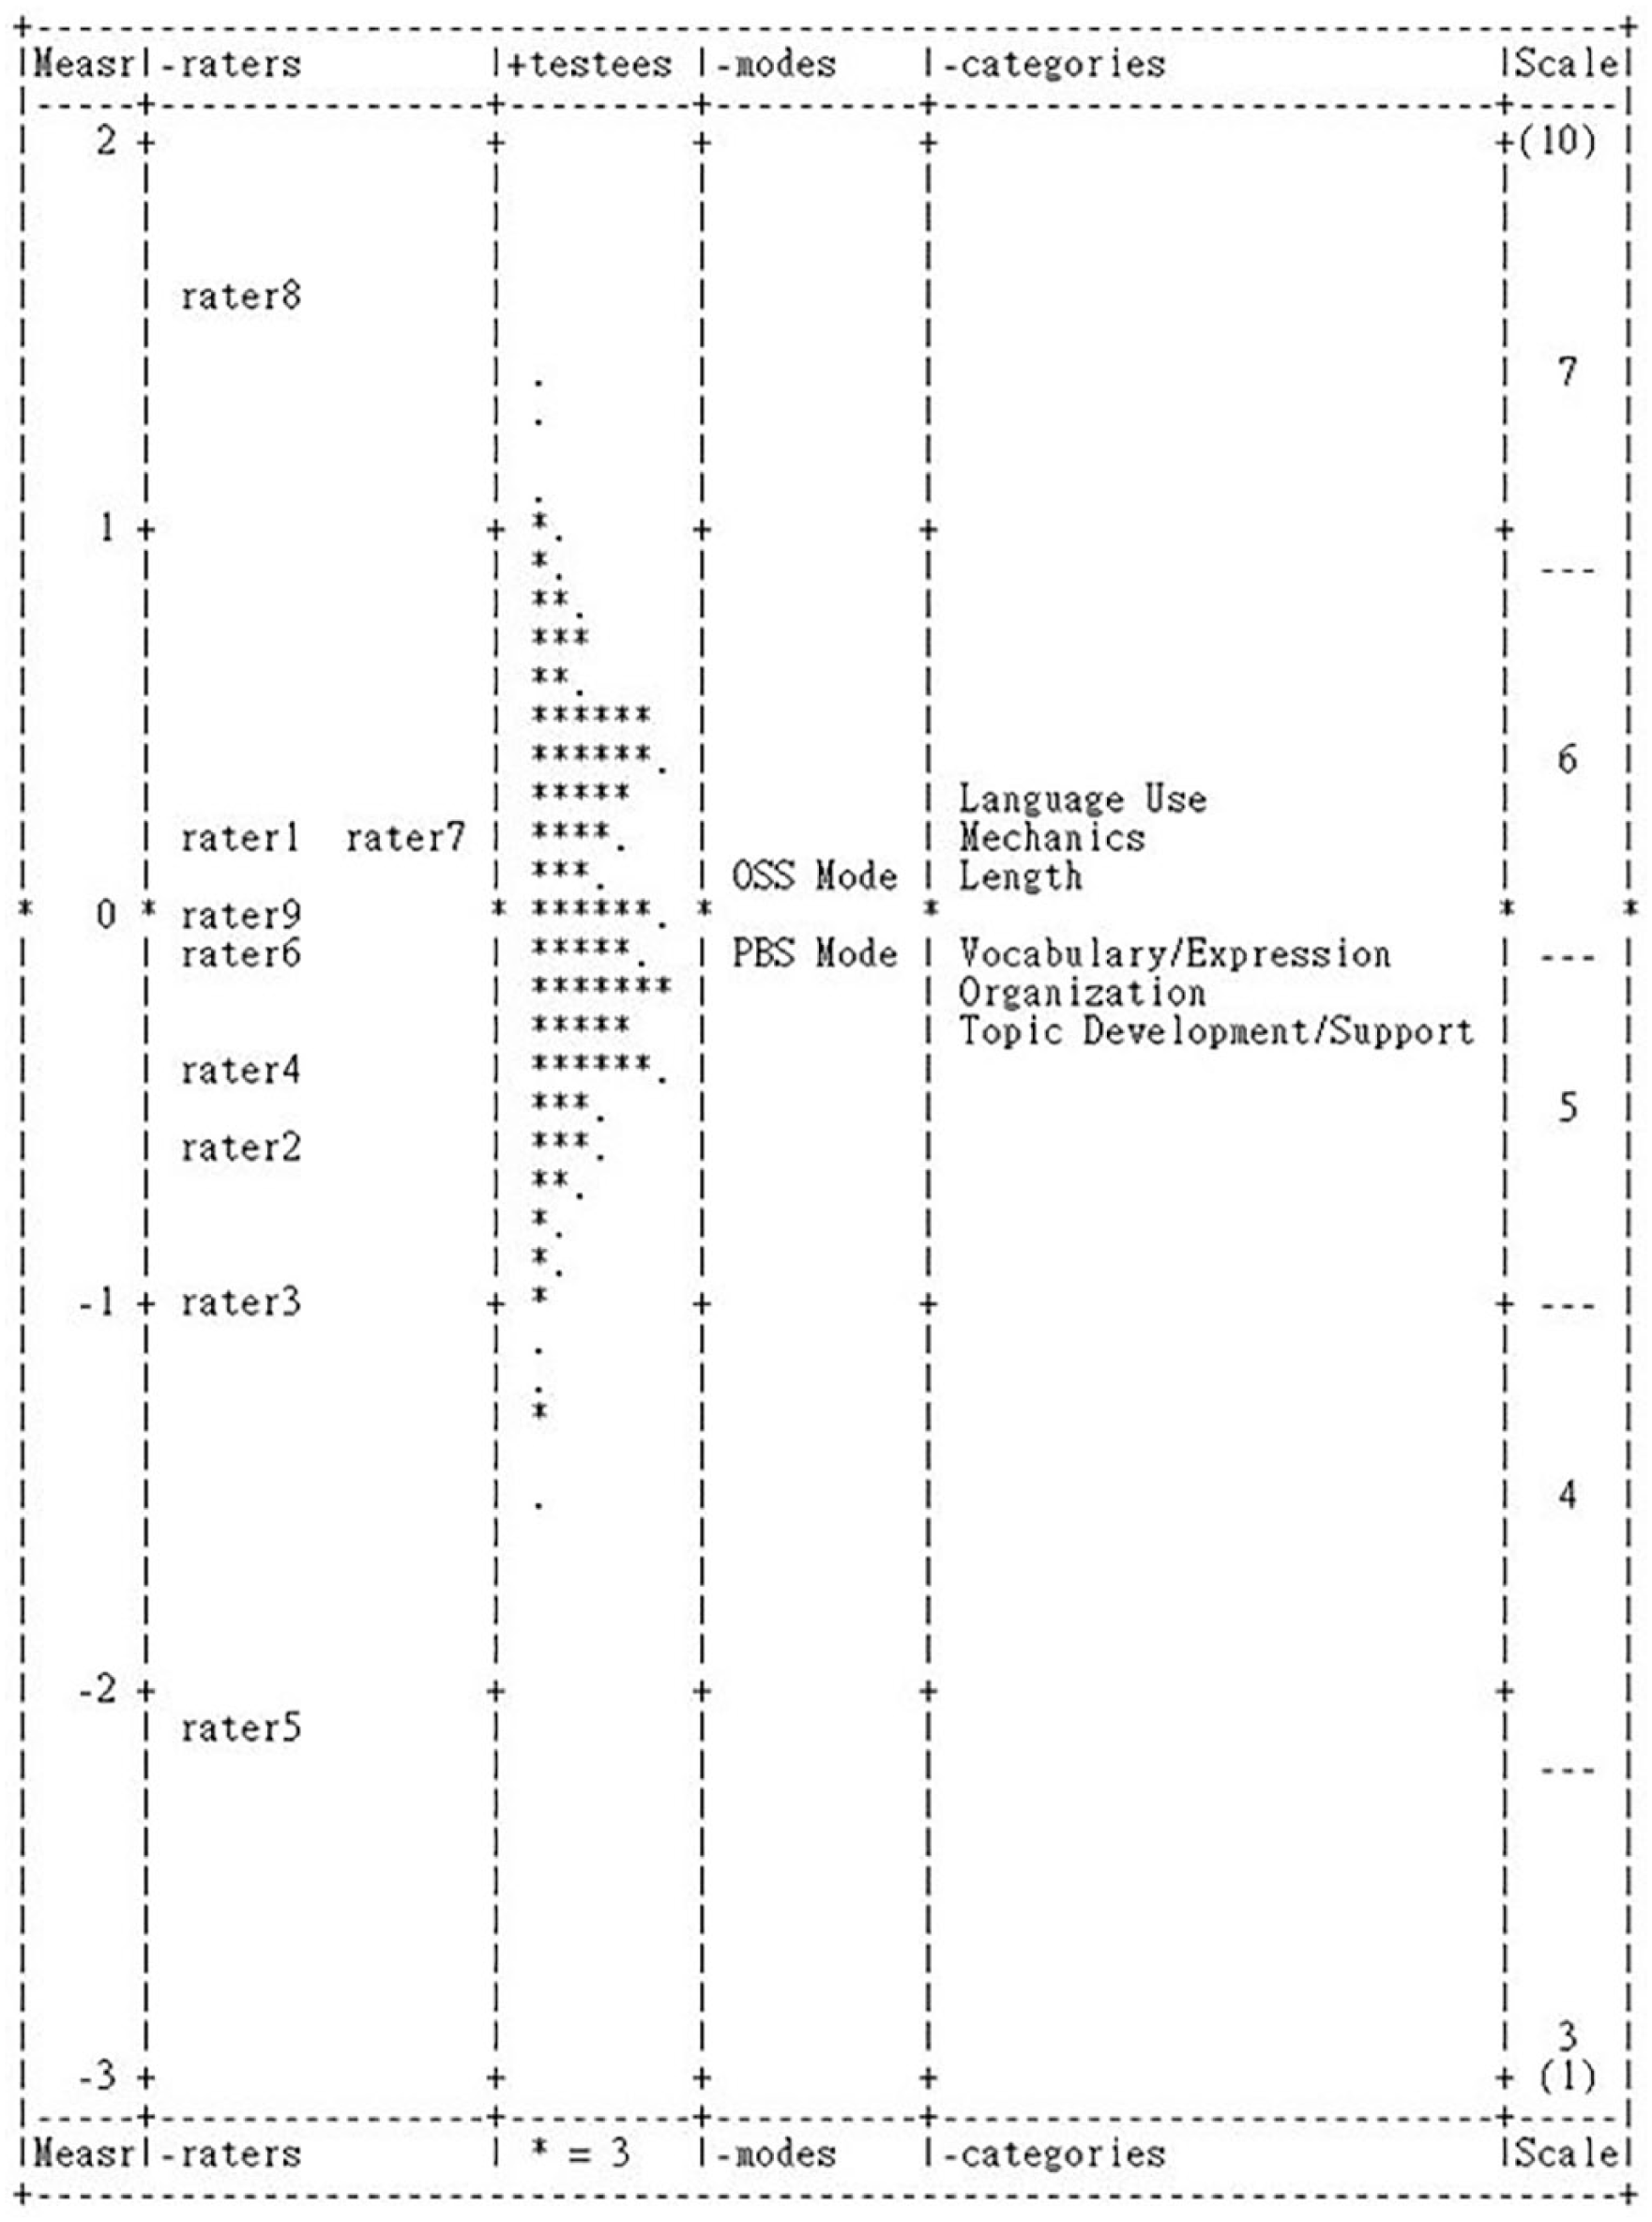
Vertical rulers for facets.
To further pinpoint the raters who held a bias toward certain category or categories in or between scoring modes, bias interactions between and among the three facets were scrutinized. Table 3 reports these bias interactions between raters and categories. It must be noted that target measures (TMs) in the table should be viewed as levels of severity; the higher a measure was, the greater severity it reflected. The contrast target measures (CTMs) were computed by subtracting the TMs in the OSS mode from the TMs in the PBS mode. A significant positive CTM indicated that paper scripts were marked more severely than scanned scripts, whereas a negative significant CTM suggested the opposite tendency. The CTMs for Rater 6, Rater 3, Rater 9, and Rater 5 were all positive and significant, implying that these four raters scored paper scripts more harshly than they did the scanned scripts. By contrast, Rater 1, Rater 4, Rater 2, and Rater 8 were more severe in OSS than in PBS mode, as their significant CTMs were negative. The nonsignificant CTM of Rater 7 implied that this rater scored the two formats of scripts with the same level of severity (see Figure 3). Finally, the only two significant CTMs for the categories were Topic Development/Support (.12) and Mechanics (−.13), suggesting that Topic Development/Support was scored more severely in PBS mode, whereas Mechanics was scored more harshly in OSS mode (see Figure 4).
Bias/Interaction: Raters Versus Modes and Categories Versus Modes.
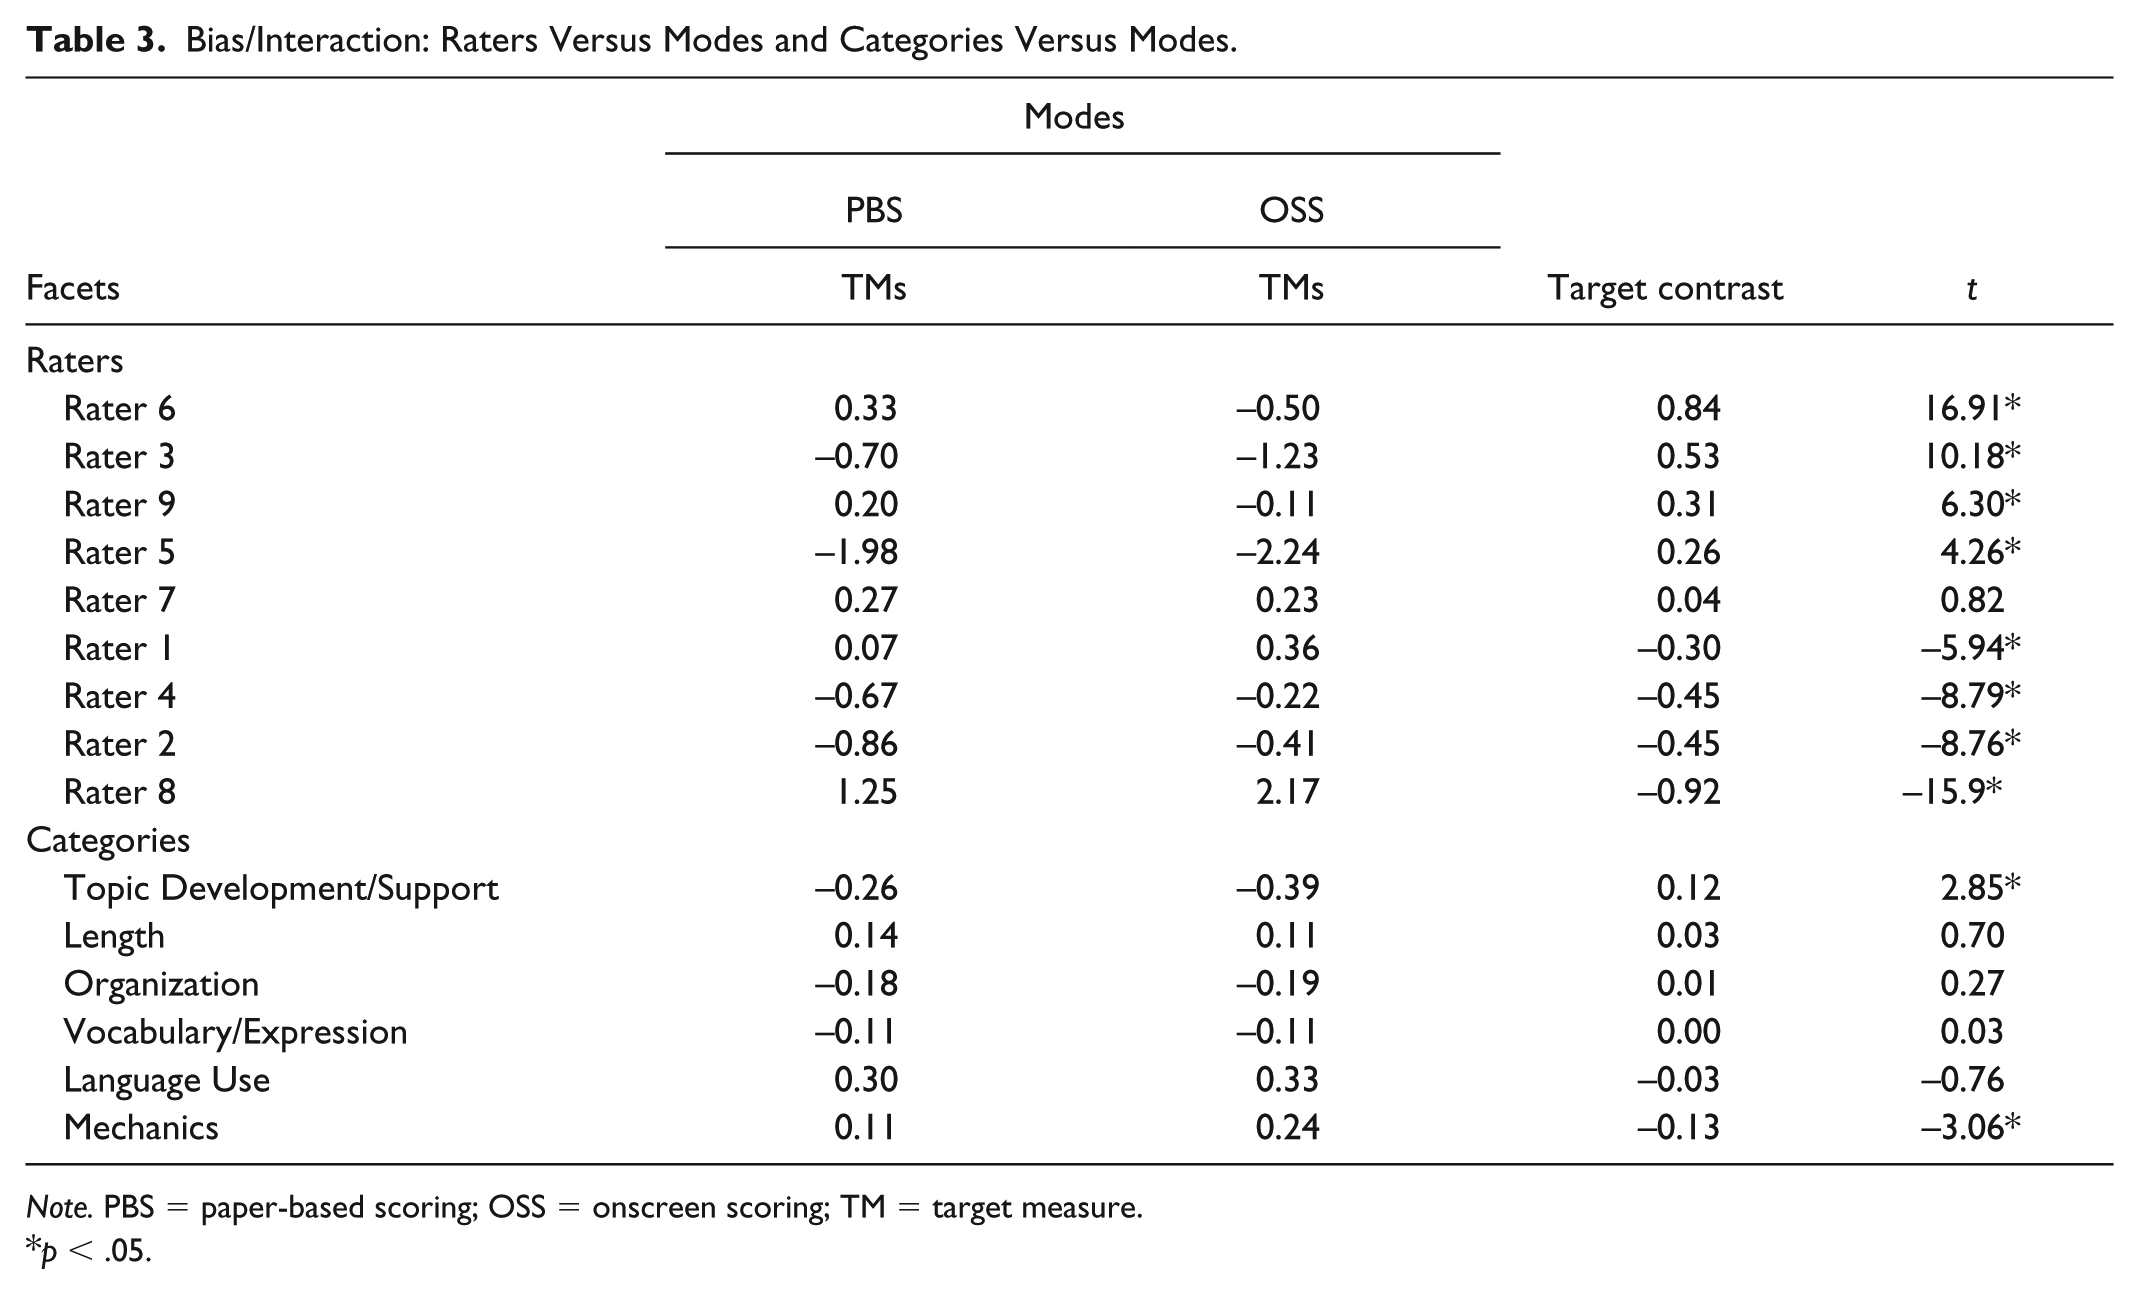
Note. PBS = paper-based scoring; OSS = onscreen scoring; TM = target measure.
p < .05.
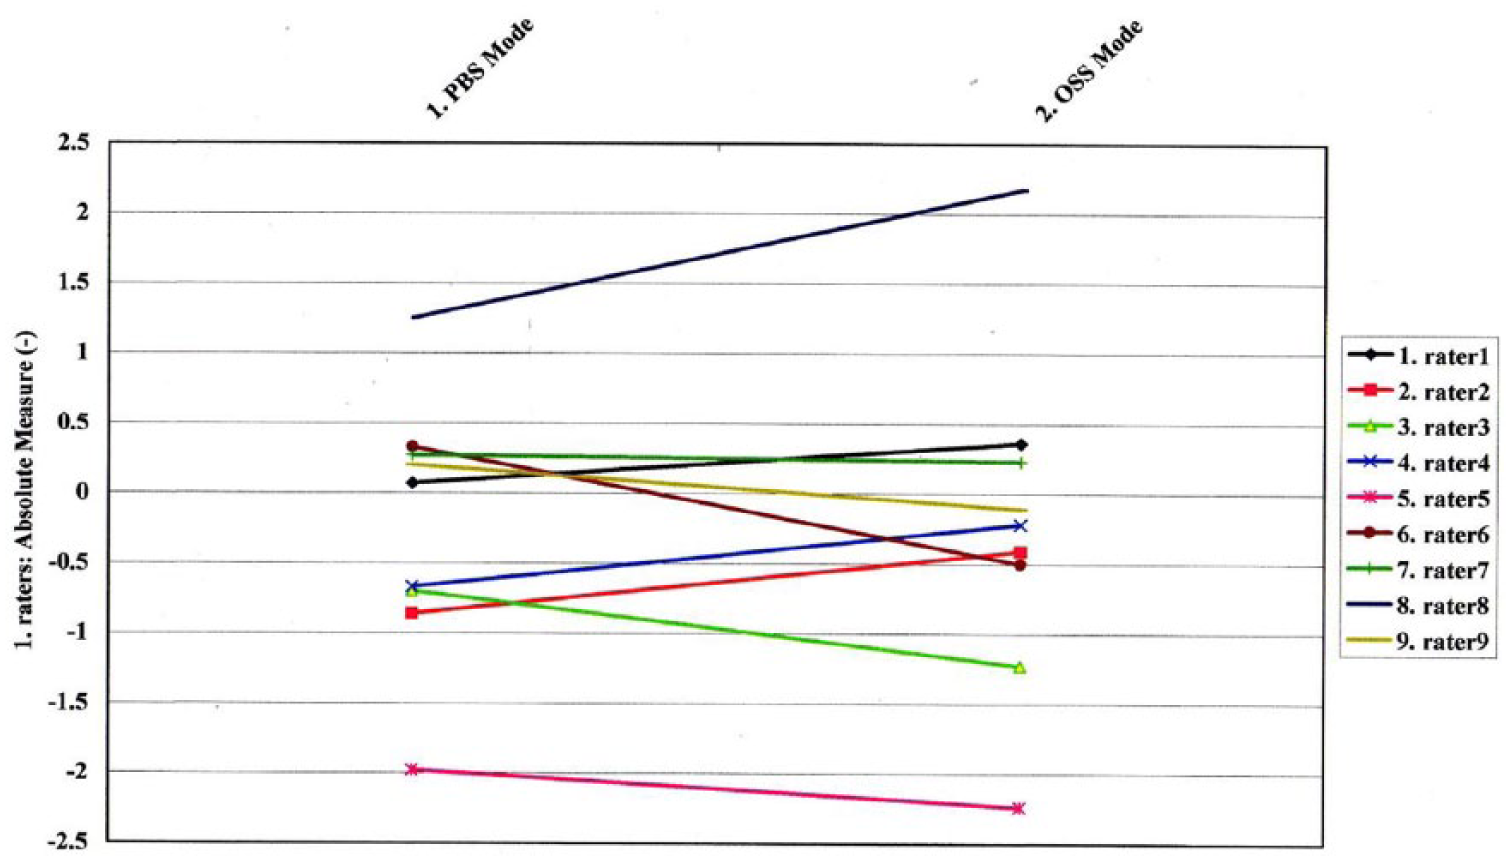
Bias/interaction between raters and scoring modes.

Bias/interaction between categories and scoring modes.
The bias interactions among raters, modes, and categories were also calibrated, and Table 4 reports these results. Among the estimates of the 72 interactions generated by six raters × two modes × six categories, 17 CTMs were nonsignificant. The remaining 55 significant CTMs showed that all nine raters scored at least one category at different levels of severity between the two modes. To illustrate, Rater 8—the most severe rater overall—scored all six categories more harshly in OSS mode than in PBS mode. Rater 1 and Rater 4 displayed an identical scoring pattern: Except for Topic Development/Support, they scored the remaining five categories more harshly in OSS mode than in PBS mode. Rater 2 scored Vocabulary/Expression, Language Use, Mechanics, and Length more severely in OSS mode than in PBS mode. By contrast, Rater 6 scored all six categories more harshly in PBS mode than in OSS mode. Similarly, Rater 3 gave lower scores in five categories (except for Mechanics) in PBS mode than in OSS mode. It is also worth noting that although the composite scores of Rater 7 on the two script formats showed a lack of bias, her scores on Mechanics were more severe in PBS than in OSS mode. Taken together, all raters gave biased scores to at least one category between the two scoring modes.
Bias/Interaction: Raters Versus Modes Versus Categories.
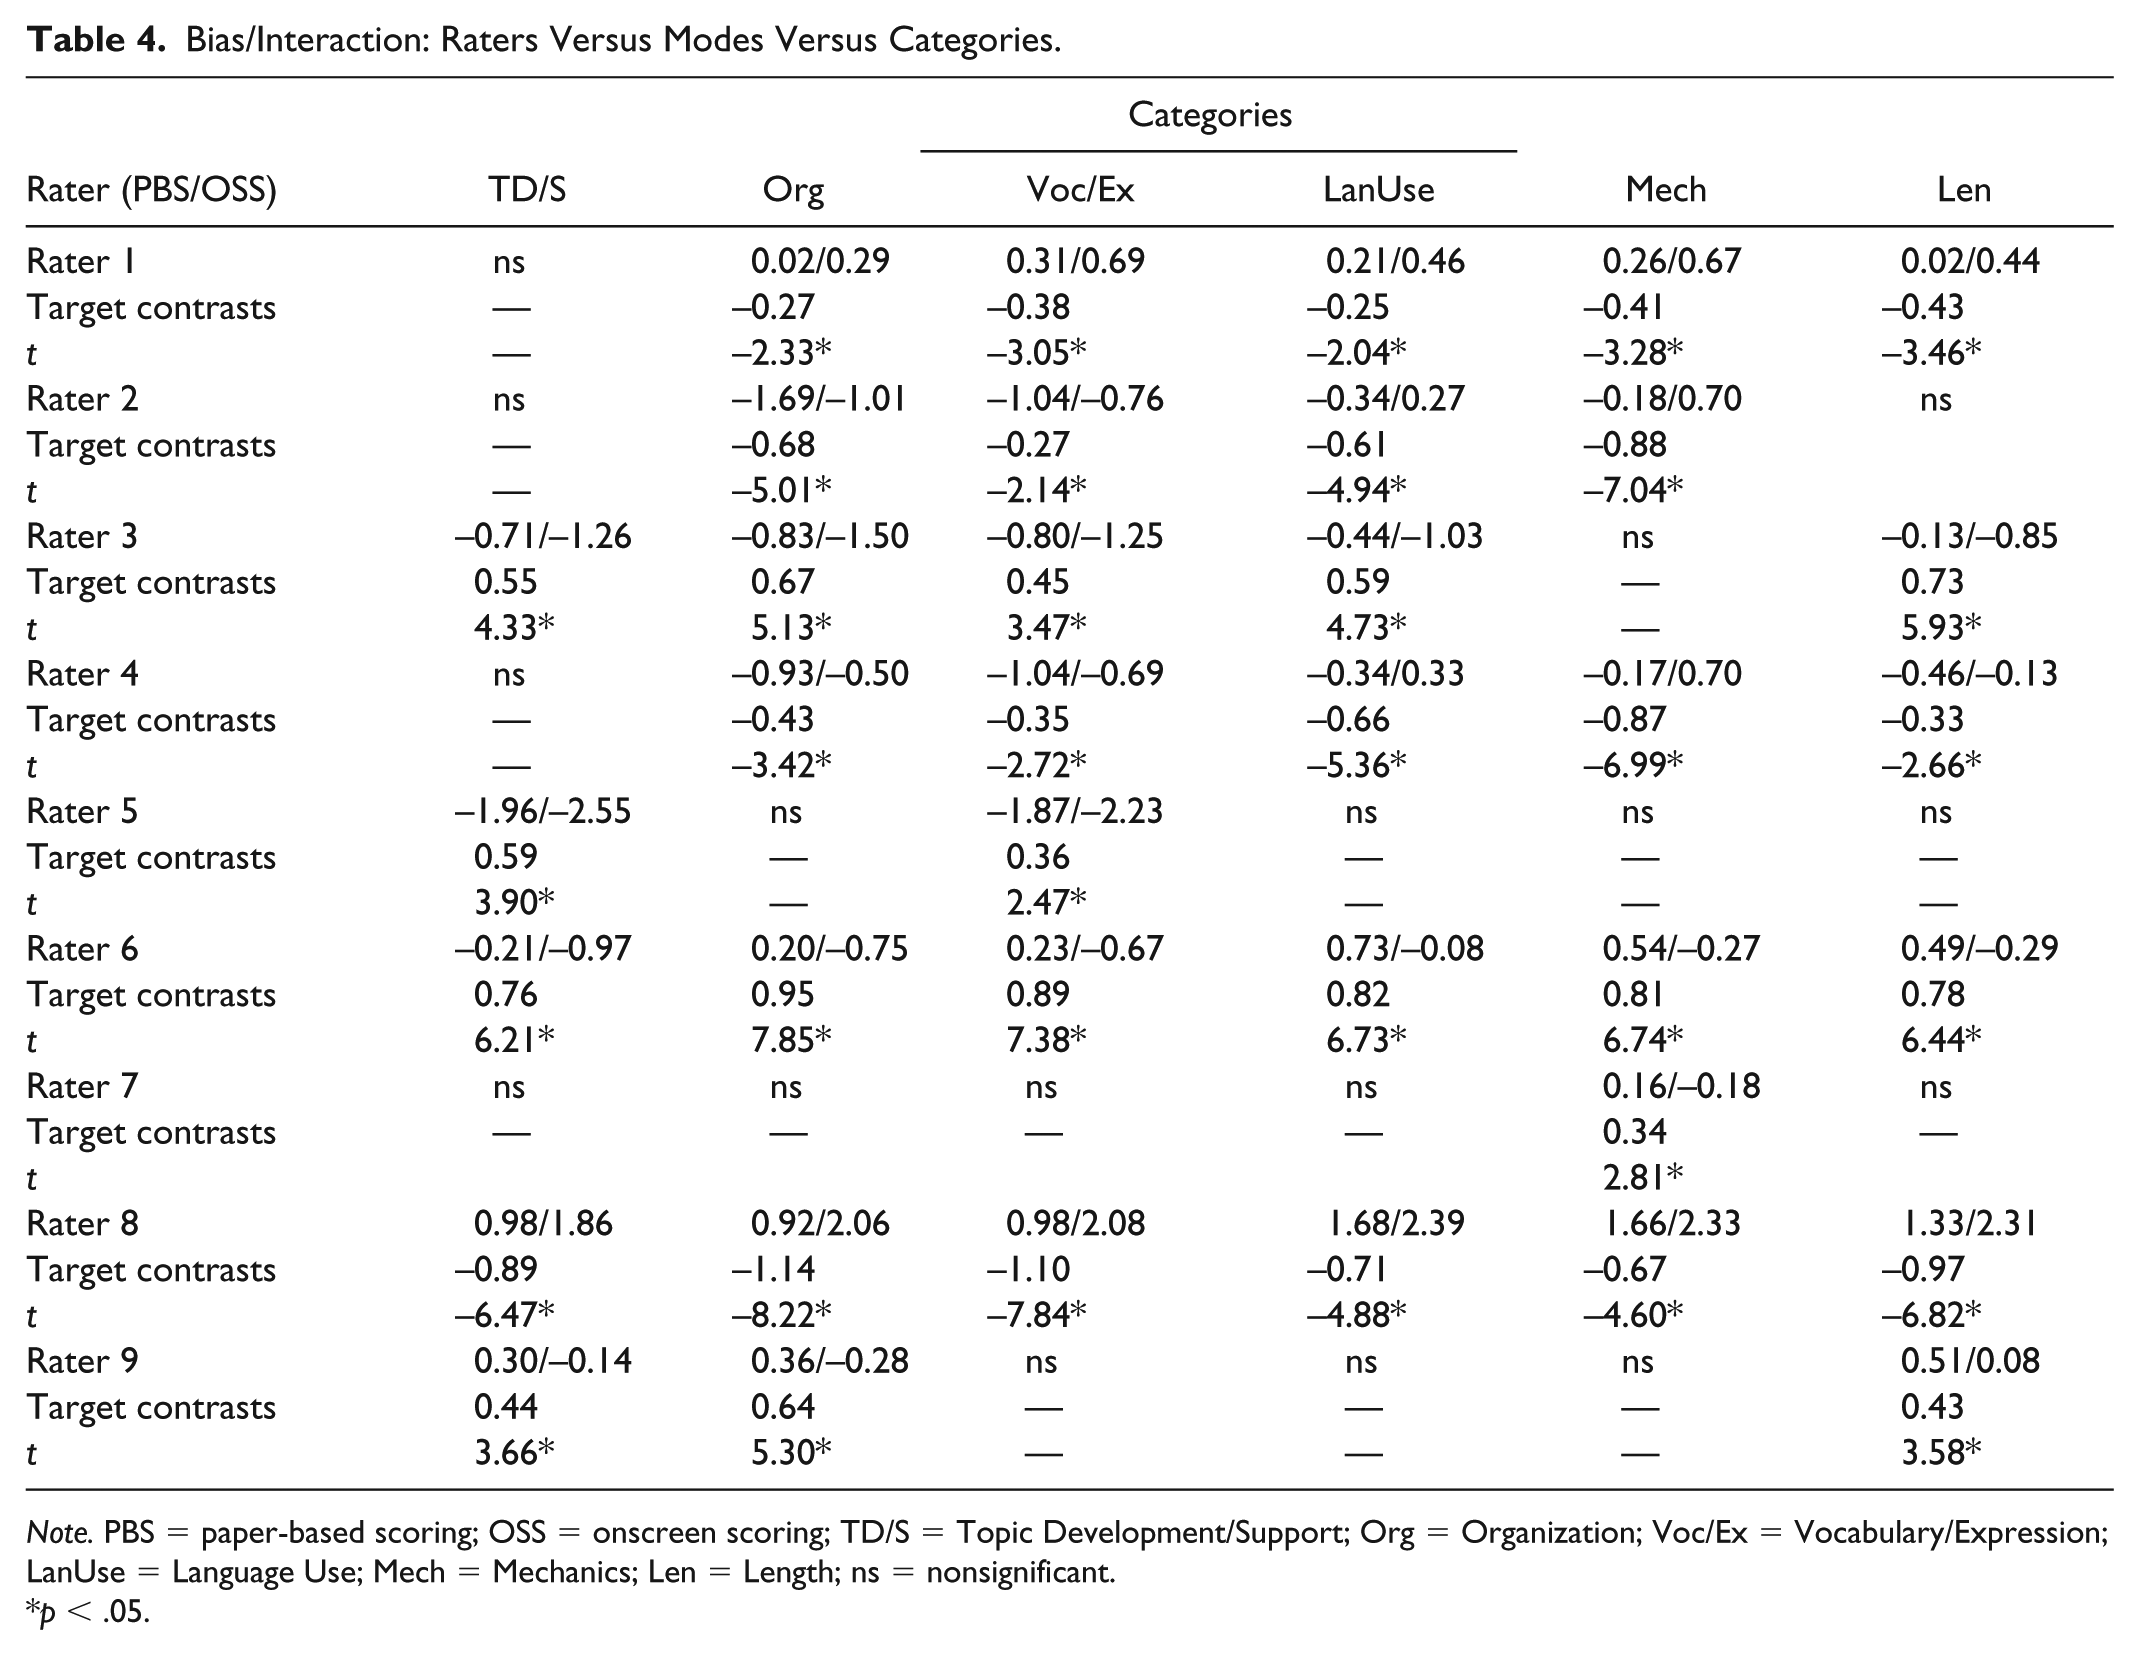
Note. PBS = paper-based scoring; OSS = onscreen scoring; TD/S = Topic Development/Support; Org = Organization; Voc/Ex = Vocabulary/Expression; LanUse = Language Use; Mech = Mechanics; Len = Length; ns = nonsignificant.
p < .05.
Raters’ Reflections on Scoring Scripts Between Different Modes
The present study also gathered and analyzed raters’ retrospective reflections concerning their marking experiences in PBS and OSS modes. Three themes emerged after five aspects of the raters’ marking experiences were coded.
Seldom annotations in both modes: No difference or difficulty
When asked whether there had been any difference and/or difficulty in marking scripts presented in different formats, Rater 8 and Rater 7 both indicated that they did not experience difference or difficulty in either mode. For instance, Rater 7 stated, I didn’t feel any difference in marking paper scripts or scanned scripts. Navigating within the same scripts or between different scripts did not pose any difficulty for me. I marked scanned scripts as the way I did to the paper scripts. I did not add annotations to these scripts all the time. It is because I know what I was doing and I think I was quite fair when I marked scripts, no matter they were paper scripts or scanned scripts.
To Rater 7, onscreen navigations or annotations did not pose any difficulty, nor did they cause any interference with reading and marking processes. She seldom annotated paper scripts or scanned scripts because she was confident in her ability to capture both the gist of all the scripts and award fair, unbiased scores. This observation was also evident in the interview with Rater 8, who explicitly expressed, Marking scanned scripts was like marking paper scripts. Nothing is different. I read the scanned scripts just like the way I did to paper scripts. I have pretty good memory, so I didn’t often annotate these scripts. I am pretty sure I was very fair.
Frequent onscreen annotations: Difficulty in reading and marking scanned scripts
Other raters who were comparatively severe in OSS mode reported different marking experiences when compared with Rater 7 and Rater 8. To illustrate, Rater 1, Rater 2, and Rater 4 frequently made annotations on the scanned scripts but seldom on the paper ones, stating that typing comments or highlighting scanned scripts interrupted their thinking flow and reading processes. For instance, in her responses to the interview question, Rater 1 stated, I often inserted annotations and highlighted texts when I marked scanned scripts. It is because reading these scripts was quite different from reading paper scripts. I wanted to leave some comments so that I could remind of myself about what I just read and what scores I should give. But, by doing so, I found I could not keep concentrated on marking these scripts. So, I got to spend more time reading through these scanned scripts.
These raters also reported that navigating onscreen scripts using the optical mouse or keyboard distracted their attention and interfered with their marking processes. For example, Rater 4 replied that I feel I had to stop my thinking and marking processes when I wanted to annotate or highlight scanned scripts using my keyboard. So, compared to marking paper scripts, I used to spend more time reading the scanned scripts and my comments before I decided my final scores.
As reflected, when Rater 4 tried to annotate scanned scripts, her keyboarding comments interrupted her thoughts. Therefore, she had to spend more time going through her annotations and contents of scanned scripts before reaching any final decisions on her assessment. In a similar manner, Rater 2 expressed that Keyboarding seemed to interrupt my reading. I feel I was distracted by keying in my comments or highlighting text. So, I had to spend much more time marking the scanned scripts than marking the paper scripts.
As such, because onscreen annotations required these raters to initiate additional keyboarding behaviors, such as typing comments or highlighting text, their marking and thinking processes might be disrupted and intervened. Accordingly, it required more cognitive effort and more time to mark scanned scripts than it did to mark paper scripts.
Moreover, when marking scanned scripts, raters could add their temporary scores for the six categories using commenting tools within Adobe Reader. However, the three raters did not use such tools to temporarily mark the scanned scripts. Furthermore, once scores for each category were entered into Excel spreadsheets, no change on scores was allowed. Therefore, these raters unanimously stated that they were more cautious about awarding scores to the scanned scripts than to paper versions after considering this regulation. For instance, Rater 1 expressed, I did not temporarily assign scores to the scanned scripts, so I always went back to my comments and spent time thinking through what these comments meant to me one more time. I don’t want to rush myself to decide and record my scores.
Rater 2 also stated that I did not like to use commenting tools, so I wouldn’t register any score until I went through my comments and the text I highlighted, at least, twice. I know there was no coming back.
Similarly, Rater 4 responded that I didn’t insert temporary scores when I marked the scanned scripts. So, I read my annotations again and again before I came up with my final scores and registered them in the spreadsheet. I know I had to be cautious. Scores could not be changed after registration.
To comply with the registration regulations, the raters—who could not rely on any temporary score to make ultimate decisions on their assessment—were motivated to revisit their inserted comments and highlighted text to reconfirm or revise their overall recollections and appraisals of the scanned scripts. Accordingly, the amount of time they spent in OSS mode was lengthened.
Frequent paper-based annotations and seldom onscreen annotations: Ease at reading and marking paper scripts
The four raters who were severe in PBS mode (Rater 3, Rater 5, Rater 6, and Rater 9) addressed divergent experiences in carrying out their tasks. To illustrate, Rater 6 emphasized that It was easier to annotate and mark paper scripts than to mark scanned scripts. I simply wrote down my comments and temporary scores on paper scripts. I mean no navigation demands for marking paper scripts made my assessment much easier. Marking scanned scripts is another story. I got tired easily by reading scripts from computer screens. My eyes hurt, which made me lose my concentration so easily.
Similarly, Rater 3 also expressed that onscreen annotations disturbed her reading and distracted her from focusing on marking scanned scripts per the established standards: I often added my comments and temporary scores to paper scripts because it was easy to do so. But, I did not always annotate scanned scripts because it was too troublesome to activate comment tools, key in comments or scores, and then go back to read the script again. I feel my thinking would have been interrupted if I had done so. On the other hand, reading paper scripts and giving temporary scores seemed much easier.
Consistently, Rater 5 also acknowledged this problem by stating that Reading, annotating, and marking paper scripts seemed easy, but it was really painful to mark scanned scripts. My eyes got tired when I stared at computer screens for a while. Reading and marking scanned scripts was very different from reading and marking paper scripts.
Rater 9 also held a similar position, emphasizing that I had tried onscreen annotations for a couple of times, but I found I easily lost my concentration, particularly when I went back and forth between reading scripts, activating tools, inserting comments, returning to scripts, and locating previous comments. Not as effective as I marked paper scripts.
As revealed from these reflections, the four raters indicated that reading and annotating paper-based essays was more efficient than reading scanned essays as it did not require any navigation to do so.
Discussion
Overall, the paper scripts are marked more leniently than scanned counterparts. This tendency indicates that the composite score of the 250 testees for the paper scripts is unfairly higher than that given for the scanned scripts. Nevertheless, it must also be noted that although the scanned scripts are marked more harshly overall, it does not imply that all nine raters exhibit identical bias patterns. It is inappropriate to interpret that every rater acted unanimously biased toward the scanned scripts by awarding relatively severe scores to them. To illustrate, the composite scores by Rater 7 for the scanned scripts and paper scripts are comparable. This finding concurs with some existing research that substantiates comparability between the two modes (Coniam, 2011a; Johnson et al., 2010; Shaw, 2008). For instance, Bennett (2003) observed that “the available research suggests little, if any, effect for computer versus paper display” (p. 15). Coniam (2011b) also reported that “the hypothesis that the method of marking does not affect scores given to test takers when scripts are marked on screen or on paper was accepted” (p. 467). Conflictingly, the overall scores of the remaining eight raters are found to be incomparable. Put differently, the eight raters can be classified into two groups, depending on their relatively high severity in one of the two modes. The PBS-Severe group consists of Rater 3, Rater 5, Rater 6, and Rater 9 because they are all more severe in PBS mode than in OSS mode. However, Rater 1, Rater 2, Rater 4, and Rater 8 constitute the OSS-Severe group as they all exhibit a tendency to be severer in OSS mode. The two bias patterns show that computers used as a medium to display scripts affect the raters’ marking behaviors and their assessment, which further causes incomparability between the two modes. As suggested, severity/leniency of raters who are less experienced in OSM than in paper marking should be carefully examined to pinpoint its effect on rating incomparability.
Moreover, it is worth noting that the raters in the present study are requested to mark EFL college students’ scripts analytically rather than holistically. Each script is assigned six category scores as opposed to a single overall score. The tendency identified in the present study illuminates the significance in researching analytical scores. To illustrate, it is found that if the four raters within the same group are more severe in one scoring mode, they will not show bias toward any category in the other mode. Undoubtedly, this bias pattern would not have been identified by merely analyzing holistic composite scores of scripts. Take the OSS-Severe group as an example: Rater 1, Rater 2, Rater 4, and Rater 8 all show bias toward Mechanics in OSS mode, but they do not show bias toward any category in PBS mode. However, the four raters in the PBS-Severe group do not show bias toward any category in OSS mode, but they all bias toward Topic Development/Support in PBS mode. That may be the reason behind Mechanics being scored more severely in OSS mode, and Topic Development/Support is given harsher scores in PBS mode. Collectively, not every category is scored with the same level of severity between the modes. From this perspective, investigating the bias interactions among raters, rating categories, and scoring modes will shed more light on exactly where rater bias occurs when compared with simply examining single holistic scores.
The significance in exploring bias interactions among facets can also be acknowledged from a detailed examination of Rater 7’s scores. It appears that Rater 7 is the only rater whose overall scores on the paper and scanned scripts are unbiased. Conversely, the rater–mode–category bias interaction analysis discloses a concealed bias pattern for this rater: She is more severe in scoring Mechanics than in scoring the other five rating categories in PBS mode. These two results may seem contradictory, but, as Carr (2000) argued, “any differences between an individual test taker’s subscores would probably be obscured by summing” (p. 229). This may also occur with the aggregate scores of Rater 7 on the two script formats. When all six category scores are aggregated and the summed scores are calibrated to estimate rater bias between the two scoring modes, it may overlook differences in individual category scores. This finding implies that contrasting aggregate scores of paper scripts and scanned scripts may well be necessary, but it is still insufficient. To depict a clearer picture of rater bias, scores for respective categories need to be explored in greater depth.
Moreover, raters’ distinct patterns of scoring, as identified from the interviews, may account for why rating severity occurs. For instance, Rater 1, Rater 2, and Rater 4 in the OSS-Severe group unanimously state that their reading processes and marking behaviors are distorted by adding onscreen annotations. This pattern is corroborated by research of Shaw (2008) who examined comparability of native English-speaking (NES) examiners between the two modes and found that “navigational demands imposed on the examiner by the computer interface affect the reading of text on-screen” (p. 18). However, unlike Shaw who reported comparability, the present study observed substantial incomparability instead. What this discrepancy suggests is twofold: (a) For the NNES raters in the present study, OSS is more physically and cognitively demanding than PBS, and (b) computers exercise a momentous effect on NNES raters’ marking behaviors and their assessment, whereas in Shaw’s study, this effect is so negligible that it merely slightly alters NES raters’ scoring behaviors without affecting their assessment (Johnson et al., 2012). As such, given that both NES and NNES raters are involved in OSS, the computer effect needs to be thoroughly examined to make sure unbiased markings will ensue. Furthermore, the three raters do not insert temporary scores into the scanned scripts but repeatedly go over highlighted texts and annotations. Also, by considering the “no-change” regulation on score registrations, the raters are cautious about making their final assessments. Perhaps due to these interruptions, interferences, and regulation, the three raters tend to spend more time and devote more effort to reading and judging in OSS mode when compared with PBS. Accordingly, they become severer raters when marking these scanned scripts.
In addition, the four raters in the PBS-Severe group all express that reading, annotating, and marking paper scripts are easier than doing so to scanned scripts. The ease of adding temporary scores to paper scripts also drives these raters to initiate this behavior frequently. On the contrary, when marking scanned scripts, they point out that staring at a computer screen rapidly leads to visual fatigue and cognitive distraction. This reflection is consistent with Mangen et al.’s (2013) acknowledgments, that computer screens “are known to cause visual fatigue due to their emitting light” (p. 66). To avoid fatigue and distraction, the raters spend less time marking scanned scripts but devote more time to rereading the contents of paper scripts and revisiting previously added annotations. They tend to frequently reevaluate and even adjust their original assessment and scores. For the PBS-Severe group, the prolonged periods of time and recurrent reassessment may assume a role in their fluctuating severity, as observed between the two modes.
Intriguingly, the analyses on qualitative and quantitative data do not yield entirely consistent findings. As reflected from their responses, Rater 8 and Rater 7 should not have shown any bias toward any format of script or any rating category. However, the results yielded by FACETS indicate that Rater 8 gives comparatively harsh scores to all six categories in the OSS mode, whereas Rater 7 scores Mechanics more severely in PBS mode. The conflict between raters’ reflections and the FACETS results implies that even raters who firmly believe their scores are fair may unintentionally give biased scores. To detect any variation in raters’ severity, in addition to collecting raters’ marking reflections, the MFRM model and FACETS should be applied to scrutinize raters’ scores to ensure comparability (Trace, Janssen, & Meier, 2015).
The present study leads to several implications for test validity and rater training. First, although raters are highly confident in giving fair scores to essays in different presentation formats, their rating severity still needs to be explored using the MFRM model to ensure comparability of the two modes (Elder, Barkhuizen, Knoch, & von Randow, 2007). Second, for any high-stakes writing tests that adopt analytical rating scales, analyzing aggregated scores may be mandatory but remains inadequate. Therefore, category scores should be estimated to provide stakeholders with complete evidence to justify the fairness of these scores. Third, to help raters realize why and when they score essays at different levels of severity, the MFRM model and FACETS may be adopted. Relying on this firsthand information, test developers or administrators may be able to design effective training that benefits raters by eliminating any biased severity. Finally, if human raters are required to score essays from computer screens, the effects of navigation and annotation on individual raters should be examined. Therefore, appropriate measures may be taken to minimize any detrimental impact but maximize score fairness.
Although the present study obtained trustworthy results and promising implications, a few limitations should be noted before its findings can be appropriately interpreted and generalized to other raters. First, the present study recruited nine NNES college teachers who are novices in OSS as raters. More raters of varied academic backgrounds, OSS experiences, and computer comfort levels should be studied to determine whether they display similar bias patterns. Second, some raters who marked scripts from 14-in. laptop computer screens experienced visual fatigue, which calls for additional research into whether larger computer screens would reduce visual fatigue and diminish its impact on rating severity. Finally, the scoring context in the present study differs from those used in nationwide standardized tests that employ OSS mode, such as GCSE in the United Kingdom or GSAT in Taiwan. Thus, findings obtained from the present study may not be suitably and directly applied to human raters on all testing formats.
Footnotes
Appendix
Declaration of Conflicting Interests
The author(s) declared no potential conflicts of interest with respect to the research, authorship, and/or publication of this article.
Funding
The author(s) disclosed receipt of the following financial support for the research, authorship, and/or publication of this article: This work was supported by the Ministry of Science and Technology of Taiwan (MOST-103-2410-H-152-004).