
Abstract
FITNESSGRAM uses an equating method to convert Progressive Aerobic Cardiovascular Endurance Run (PACER) laps to One-mile run/walk (1MRW) times to estimate aerobic fitness (VO2MAX) in children. However, other prediction models can more directly estimate VO2MAX from PACER performance. The purpose of this study was to examine the convergent validity and relative accuracy between 1MRW and various PACER models for predicting VO2MAX in middle school students. Aerobic fitness was assessed on 134 students utilizing the 1MRW and PACER on separate testing days. Pearson correlations, Bland–Altman plots, kappa statistics, proportion of agreement, and prediction error were used to assess associations and agreement among models. Correlation coefficients were strong (r ≥ .80, p < .001) and error estimates were similar between comparisons. Bland–Altman plots yielded similar Limits of Agreement between 1MRW and PACER models. Fitness Zone agreement with 1MRW was moderate-to-excellent with kappa > .40 and agreement > .90. The results support that PACER models contain convergent validity and strong relative accuracy with the 1MRW model.
Fitness assessment is an important but controversial aspect of physical education. The controversy arises from several factors that include deciding which fitness tests to implement for a respective fitness domain, how to implement a chosen test within the time constraints of a physical education class, student reactions to the implemented fitness tests, and most importantly, how to interpret the scores so that a child can receive the maximum benefit from participating in the assessment. The FITNESSGRAM fitness and physical activity assessment program is a significant advancement in youth fitness assessment. Instead of comparing a youth’s score to a reference population to receive a grade, the program classifies students into one of three Fitness Zones by relating a fitness test score to a health-criterion measure (Welk, Going, Morrow, & Meredith, 2011; Zhu, Mahar, Welk, Going, & Cureton, 2011). A child can use the Fitness Zone information to assess his or her own current health status and future health risk. Despite the benefits of this program, there is potential for Fitness Zone misclassification (thus health-risk misclassification) that may lead to unnecessary negative emotional responses from youth. One potential source for misclassification is differences in reporting outcomes based on which fitness test were administered for a respective fitness domain.
There are five domains of health-related physical fitness: aerobic fitness, body composition, muscular strength, muscular endurance, and flexibility. Aerobic fitness, operationally defined by maximal oxygen uptake, or VO2MAX, is considered by many health professionals to be the most important domain of health-related fitness due to its links to cardiometabolic health, and thus is one of the most commonly assessed fitness domains in physical education settings (National Association for Sport and Physical Education, 2011).
Aerobic fitness is the ability of the heart and lungs to circulate oxygenated blood to exercising tissues, the ability of the muscle cells to extract and use the oxygen for energy production, and the ability of the circulatory system to return blood back to the heart (National Association for Sport and Physical Education, 2011). VO2MAX is the criterion measure of aerobic fitness and is often measured in laboratory settings using a maximal graded-exercise treadmill test. Research shows that poor aerobic fitness (low VO2MAX) associates with increased prevalence cardiovascular disease risk factors in adults (Blair, Goodyear, Gibbons, & Cooper, 1984; Blair et al., 1989; Blair et al., 1995). In the pediatric population, Welk, Laurson, Eisenmann, and Cureton (2011) demonstrated that aerobic fitness, quantified by a laboratory VO2MAX measurement, could be used as a proxy measure to differentiate youth with and without metabolic syndrome, and Eisenmann, Welk, Ihmels, and Dollman (2007) showed that higher levels of aerobic fitness associates with more favorable cardiometabolic disease risk profiles, even in youth with higher levels of adiposity.
Despite the health benefits of optimal aerobic fitness, recent evidence suggests that as many as one third of American youth have inadequate levels (Pate, Wang, Dowd, Farrell, & O’Neill, 2006). Prospective studies have shown that poor levels of measured VO2MAX tracks reasonably well through childhood and adolescence and into adulthood where it may affect morbidity and mortality (Malina, 1996). Therefore, children with poor aerobic fitness during childhood are more likely to have poor aerobic fitness as adults. Because of the increased recognition of poor aerobic fitness as a risk factor for adverse chronic medical conditions (Lobelo & Ruiz, 2007), proper assessment of aerobic fitness is needed in physical education curricula to screen youth who may be at risk of chronic disease.
FITNESSGRAM uses a validated classification system to distinguish youth at risk of chronic disease based on aerobic fitness test performance. Cut-off scores (or thresholds) are used to classify students into one of three fitness zones for the aerobic fitness domain: the Healthy Fitness Zone (HFZ), Needs Improvement Zone (NIZ)-some risk, and NIZ-health risk. HFZ indicates that a child has a level of aerobic fitness that is sufficient for good health. The NIZ-some risk subzone indicates that a child has aerobic fitness scores that are close to NIZ-health risk subzone, and that they should strive to improve their score to reach the HFZ (Welk et al., 2011; Zhu et al., 2011). Finally, the NIZ-health risk subzone gives warning to children that their aerobic fitness levels may develop into a potential health risk if they were to continue tracking at that level. Age and gender-specific cut-off scores used to classify students into these Fitness Zones were developed relating measured VO2MAX to the presence (or absence of) “metabolic syndrome” (Welk et al., 2011; Zhu et al., 2011). However, as VO2MAX testing requires a laboratory assessment, direct measurement is not feasible in physical education settings. Therefore, FITNESSGRAM predicts VO2MAX scores via validated field-based assessments.
FITNESSGRAM uses the one-mile run/walk (1MRW) test and the Progressive Aerobic Cardiovascular Endurance Run (PACER) to assess aerobic fitness in physical education settings (Meredith & Welk, 2010). The 1MRW is a widely used field test to evaluate maximal aerobic power with research demonstrating a moderate-to-strong relationship with laboratory-measured VO2MAX, having correlation coefficients ranging from r = −.56 to −.80 and test–retest intra-class reliability coefficients of R > .90 (Buono, Roby, Micale, Sallis, & Shepard, 1991; Cureton, Boileau, Lohman, & Misner, 1977; Kearney & Bynes, 1974). As 1MRW is a field test of aerobic fitness and the correlations with laboratory measures are less than perfect, VO2MAX has to be estimated from 1MRW using a prediction equation using age, gender, and Body Mass Index (BMI) terms, in addition to a 1MRW time. VO2MAX is calculated using the Cureton, Sloniger, O’Bannon, Black, and McCormack’s (1995) formula (1MRW model = Equation 1) as follows:

Even though 1MRW is a validated field-based aerobic fitness assessment, it is the PACER test, developed by Leger and Lambert (1982) that is the recommended aerobic fitness test used in FITNESSGRAM. The PACER test is a 20-m multistage aerobic fitness test that is the recommended (default) aerobic fitness assessment. The PACER test has correlation coefficients ranging from r = .60 to .87 with laboratory-measured VO2MAX (Leger, Mercier, Gadourey, & Lambert, 1988; Mahoney, 1992) and has demonstrated test–retest reliability in school-aged children with intra-class coefficients ranging from R = .82 to .93 (Liu, Plowman, & Looney, 1992; Vincent, Barker, Clarke, & Harrison, 1999). The following reasons are why PACER is recommended over 1MRW for assessing aerobic fitness in children: all students are more likely to have a positive experience performing the PACER, the PACER helps students learn the skill of pacing, and students who have a poorer performance will finish first and not be subjected to the embarrassment of being the last person to complete the test, as is the case with the 1MRW (Welk et al., 2011).
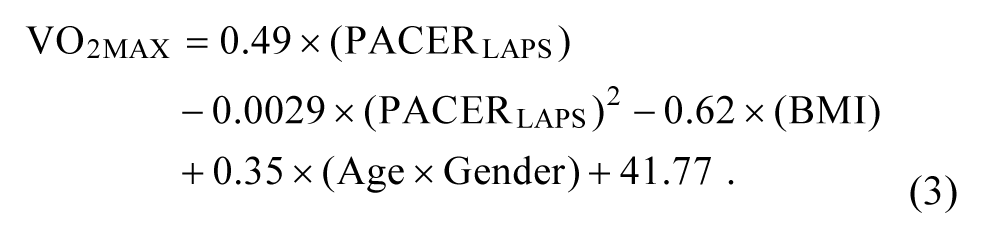
When estimating VO2MAX from PACER performance, PACER laps are converted to 1MRW times using the Primary Field Test Centered Equating Method, developed by Zhu, Plowman, and Park (2010). The converted 1MRW scores from PACER performance, referred to as Mile-PACER equated scores or Mile-PEQ, are then used to estimate VO2MAX by use of the Cureton et al.’s formula (Zhu et al., 2010). Therefore, there is a double conversion that takes place to obtain a predicted VO2MAX score from PACER performance (Zhu et al., 2011). Boiarskaia, Boscolo, Zhu, and Mahar (2011) cross-validated this method in a sample of middle school students using a laboratory-measured VO2MAX criterion. However, other studies have produced linear and quadratic models to estimate VO2MAX more directly from PACER performance using age, gender, and BMI terms similar to that of the Cureton model (Mahar, Guerieri, Hanna, & Kemble, 2011; Mahar, Welk, Rowe, Crotts, & McIver, 2006). The former equation is a Linear PACER prediction model (Linear PACER = Equation 2) and the latter is a Quadratic PACER prediction model (Quadratic PACER = Equation 3) developed from Mahar et al. (2011) as follows:

The aforementioned prediction models have been developed and cross-validated against a laboratory measure of VO2MAX; however, their relationship with each other for the prediction of VO2MAX has not been examined using an independent sample of middle school–aged students. Convergent validity refers to the degree to which two measures (1MRW and PACER predicted VO2MAX) that estimate a construct (aerobic fitness) that should theoretically be related are in fact related. Although 1MRW and PACER relate to laboratory-measured VO2MAX, their correlations with the criterion measure were far from perfect (R < 1.0), therefore prediction of VO2MAX among the prediction models themselves may not necessarily significantly relate to each other in field settings. Criterion-referenced equivalency, or the consistency on being classified the same on two parallel tests, may be adversely affected if the prediction models’ estimates of VO2MAX do not significantly relate to each other. Indeed, when classifying youth into Fitness Zones based on 1MRW and PACER performance, criterion-referenced equivalency between tests occurred roughly 77% of the time for boys and 73% of the time for girls when using older FITNESSGRAM criterion-referenced standards for analysis, which was based on using performance (1MRW times and PACER laps) rather than predicted VO2MAX using the prior explained methods and models (Beets & Pitetti, 2006).
Convergent validity must be examined among prediction models to provide evidence that each model will yield similar estimates of VO2MAX. Evidence for convergent validity will also suggest that these two field tests would yield similar reporting outcomes when administered to physical education students. Conversely, poor evidence for convergent validity would indicate that these two field tests may have differences in aerobic fitness reporting outcomes, meaning a student may receive a different reporting outcome (Fitness Zone Classification) based on which field test was administered. In addition, examining the relative accuracy of these models to each other within grade and gender groups will provide further information of any over- or underestimation trends between various prediction models. Therefore, the purpose of this study was to examine the convergent validity and relative accuracy between 1MRW predicted and PACER predicted VO2MAX from the Linear PACER, Quadratic PACER, and Mile-PEQ models in a sample of middle school students. It was hypothesized that 1MRW predicted VO2MAX will strongly correlate and agree with all three PACER models, giving evidence of convergent validity among models and the ability of the models to be used interchangeably for the prediction of VO2MAX in middle school students.
Method
Participants
Participants included 134 school-aged youth (65 boys, 69 girls) recruited from the sixth, seventh, and eighth grades (M age = 12.9 years, SD = .87 years) from three schools located in a metropolitan area in the Southwestern United States. The sample distribution by grade included 34 sixth graders (17 boys, 17 girls), 52 seventh graders (22 boys, 30 girls), and 48 eighth graders (26 boys, 22 girls). Written consent was obtained from parents and assent was obtained from participants prior to data collection. The University Institutional Review Board (IRB) and principals from the participating schools approved the protocols used in this study.
Procedures
All data collection took place during each student’s physical education class on two separate testing sessions separated by exactly 1 week to allow for full recovery while minimizing changes in aerobic fitness levels. All anthropometric and aerobic fitness assessments were conducted at least 2 hr postprandial during the final two class periods of the school day. A trained graduate student within the Department of Exercise and Sport Science administered all anthropometric measures and fitness tests to ensure consistency during data collection. Students were familiarized with both the 1MRW and PACER in the months prior to data collection. Test familiarization took place in the Fall. All students participated in two 1MRW and two PACER tests as part of their physical education fitness assessments prior to data collection, which occurred in the Spring.
Height, weight, and the 1MRW were administered on Day 1. Students were asked to remove their shoes, as height (to the nearest 1 cm) and weight (to the nearest 0.1 kg) were determined using a portable stadiometer (Seca 213; Chino, CA, USA) and medical scale (Tanita HD-314; Arlington Heights, IL, USA). The 1MRW was administered outdoors on a standard track on school grounds. All students ran on a concrete and level track surface to maintain consistency of measurement. No more than 10 students participated in the 1MRW at any given time. Time was kept via a handheld stopwatch (Robic Oslo M427; Oxford, CT, USA).
The 20-m PACER test was administered on Day 2. The PACER test was administered indoors on a marked gymnasium floor with background music and cadence given by an audio CD. No more than 10 students participated in the assessment at any given time. Students ran from one floor marker to another marker set 20-m apart while keeping pace with a prerecorded cadence (Meredith & Welk, 2010). The test was terminated when a student twice failed to reach the opposite marker in the allotted time frame or when he/she voluntarily stopped. Day 3 served as the make-up day for those students who had not completed a test on Day 1 or 2.
Statistical Analysis
Data were screened for outliers and normality was checked prior to the main analyses. 1MRW times were converted to VO2MAX using the Cureton et al.’s formula (Equation 1) and PACER laps were converted to VO2MAX using the Linear (Equation 2) and Quadratic (Equation 3) PACER models (Mahar et al., 2011) and the Primary Field Test Centered Equating Methods (Mile-PEQ; Zhu, Plowman, & Park, 2010). Descriptive analyses included comparisons among grade levels and between genders on anthropometric measures and aerobic fitness test performance using multiple 2 × 3 factorial ANOVA tests followed by Bonferroni post hoc analyses. If a significant grade effect was found, alpha level was adjusted appropriately using the Bonferroni method.
Pearson correlations were employed to assess the linear relationship between 1MRW and PACER predicted VO2MAX. Correlations were considered strong if r ≥ .60 (Pagano & Gauvreau, 2000). Prediction error was assessed using 1MRW as reference using the Standard Error of Estimate (SEE). Bland and Altman (1986) pairwise comparisons were used to compare 1MRW predicted VO2MAX with PACER predicted VO2MAX estimated from the Linear and Quadratic models and from the Mile-PEQ. Differences between the methods (1MRW-PACER) were plotted on the y axis and the method averages (1MRW + PACER/2) were plotted on the x axis. The mean differences (MD), 95% Limits of Agreement (MD ± 1.96 × SD), and correlation coefficients (r) between method differences and means were reported to assess possible over- or underestimation trends within each 1MRW-PACER comparison.
Classification agreement into aerobic Fitness Zones between 1MRW and PACER predicted VO2MAX was assessed using FITNESSGRAM’s current age and gender-specific criterion-referenced standards (Welk et al., 2011). Each student was classified into the HFZ, NIZ-some risk, or NIZ-health risk based on 1MRW and PACER performance. Agreement was statistically analyzed using modified kappa statistics and proportion of agreement. Kappa was determined weak if <.20, fair if .20-.40, moderate if .40-.60, substantial if .60-.80, and excellent if .80-1.00 (Landis & Koch, 1977). Alpha level was set at p ≤ .05 and all analyses were carried out using STATA v12.0 (College Station, TX, USA) statistical software.
Results
Grade and Gender Differences
Table 1 shows the means, standard deviations, grade, and gender effects for height, weight, BMI, and predicted VO2MAX per grade and gender group. A factorial ANOVA test revealed a significant grade effect for height, F(2,128) = 29.85, p < .001, and weight, F(2, 128) = 27.52, p < .001. Students in Grade 7 were significantly taller and heavier than students in Grade 6 (p < .01), students in Grade 8 were significantly taller than students in Grade 6 (p < .01), and significantly heavier than students in Grades 6 and 7 (p < .01). There was also a significant grade effect for BMI, F(2,128) = 12.04, p < .001, as BMI was higher in Grade 8 compared with Grades 6 and 7 (p < .001). Regarding aerobic fitness test performance, there were no statistically significant differences among grade levels in predicted VO2MAX from the 1MRW or any of the PACER models.
Physical Characteristics and Fitness Scores per Grade and Gender Group.
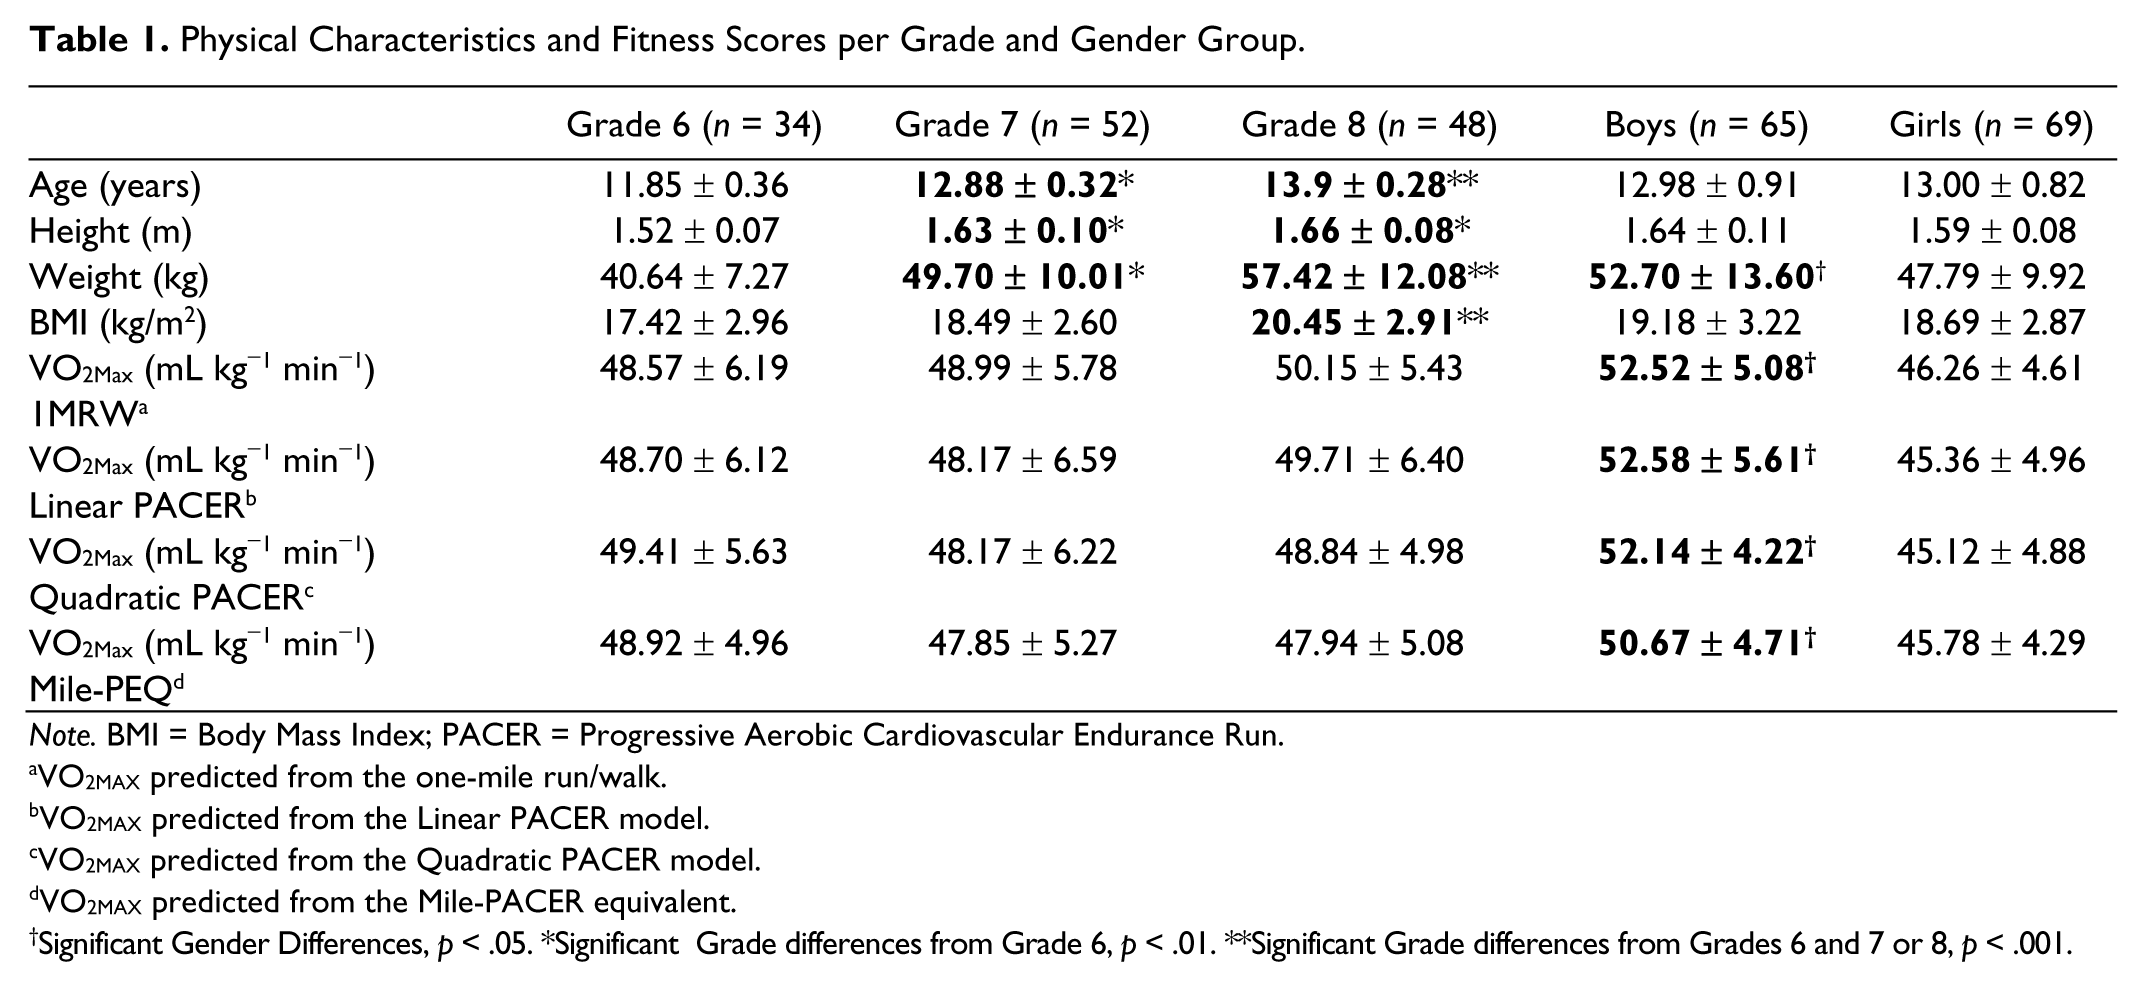
Note. BMI = Body Mass Index; PACER = Progressive Aerobic Cardiovascular Endurance Run.
VO2MAX predicted from the one-mile run/walk.
VO2MAX predicted from the Linear PACER model.
VO2MAX predicted from the Quadratic PACER model.
VO2MAX predicted from the Mile-PACER equivalent.
Significant Gender Differences, p < .05. *Significant Grade differences from Grade 6, p < .01. **Significant Grade differences from Grades 6 and 7 or 8, p < .001.
Regarding the gender effects, boys in the sample were taller and heavier than girls (p < .05), however, there were no differences between the genders in BMI. Finally, regarding the aerobic fitness test scores, boys had statistically higher predicted VO2MAX (p < .001) from the 1MRW and all three PACER models than girls (p < .001). There was no statistically significant grade by gender interactions found in this sample.
Pearson Correlations and Prediction Error
Correlation coefficients between 1MRW predicted and PACER predicted VO2MAX was similar among all 1MRW-PACER pairwise comparisons and were considered strong. The correlation between 1MRW and Linear PACER was r = .81 (p < .001), between 1MRW and Quadratic PACER was r = .80 (p < .001), and r = .80 (p < .001) between 1MRW and Mile-PEQ. Prediction error, assessed by the SEE, using 1MRW predicted VO2MAX as the reference was 3.34 ml kg−1 min−1 for Linear PACER, 3.53 ml kg−1 min−1 for Quadratic PACER, and 3.45 ml kg−1 min−1 for Mile-PEQ.
Bland–Altman Analysis
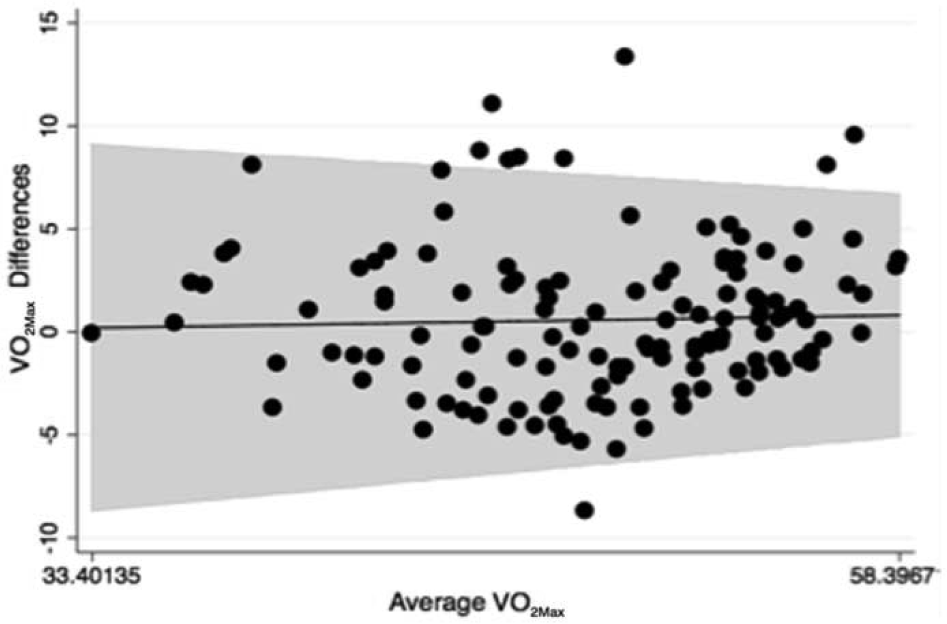
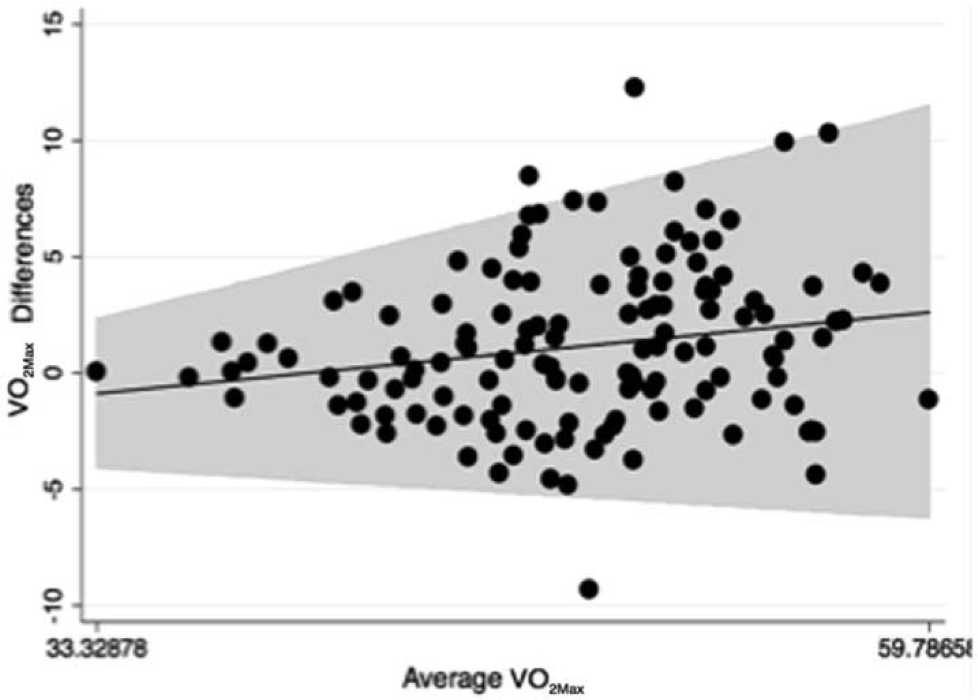
Figures 1-3 present Bland–Altman difference plots comparing the agreement between VO2MAX predicted from 1MRW and VO2MAX predicted from the three PACER models. Linear PACER had a greater tendency to overestimate VO2MAX compared with 1MRW in children with higher aerobic fitness (r = −.18, p < .05). Mile-PEQ had a tendency to underestimate VO2MAX compared with 1MRW in children with higher aerobic fitness (r = .20, p < .05). Quadratic PACER model did not produce a statistically significant trend (r = .04, p = ns). The 95% Limits of Agreement comparing 1MRW to Linear PACER was (−6.908, 7.786; MD = 0.4387), comparing 1MRW to Quadratic PACER was (−6.679, 7.826; MD = 0.5736), and comparing 1MRW to Mile-PEQ was (−5.909, 7.906; MD = 1.148).

Differences between 1MRW and Linear PACER predicted VO2MAX.
Differences between 1MRW and Quadratic PACER predicted VO2MAX.
Differences between 1MRW and Mile-PEQ predicted VO2MAX.
Fitness Zone Criterion-Referenced Equivalency
Table 2 shows the Fitness Zone agreement between VO2MAX predicted from 1MRW and PACER models using the most current age and gender-specific FITNESSGRAM aerobic fitness standards (Welk et al., 2011). Kappa statistics comparing 1MRW to PACER prediction models were all >.40 with proportion of agreement >.95, suggesting moderate-to-excellent agreement between 1MRW and PACER methods.
Fitness Zone Agreement Between 1MRW Predicted VO2MAX and VO2MAX Predicted From Various PACER Models.

Note. 1MRW = one-mile run/walk; PACER = Progressive Aerobic Cardiovascular Endurance Run; CI = confidence interval.
Statistically significant, p < .05.
Discussion
The purpose of this study was to assess the convergent validity and relative accuracy in predicted VO2MAX between the 1MRW and various PACER models including a Linear PACER model, a Quadratic PACER model, and the Mile-PEQ. Descriptive analyses revealed that among all four methods of estimating aerobic fitness, there were similar VO2MAX estimates across grade levels and between genders (see Table 1). Although no criterion measure of aerobic fitness (laboratory-measured VO2MAX) was used for comparison, the availability of the primary field test for aerobic fitness (1MRW) allowed for efficient and validated assessment without the use of expensive and time-consuming methods associated with laboratory testing (Zhu, 2010). The 1MRW was the reference method to compare PACER models because it is a validated and established assessment used in physical education to estimate VO2MAX (Buono et al., 1991; Cureton et al., 1977; Kearney & Bynes, 1974; Welk et al., 2011; Zhu et al., 2011).
The Mile-PEQ method of estimating aerobic fitness from PACER performance is currently the method used by FITNESSGRAM. Zhu, Plowman, and Park (2010) devised the Primary Field Test Centered Equating Method to equate PACER laps to 1MRW times that are then used to estimate VO2MAX using the Cureton et al.’s formula. This method produced small standard errors across the conversion scale (SEE ~ ±1 min) and showed high relative accuracy compared 1MRW times with a correlation coefficient of r = .84, which was similar to the correlations found between each 1MRW-PACER comparison in this study. Boiarskaia et al. (2011) cross-validated the method using a sample of middle school students; however, only classification agreement with laboratory VO2MAX was used in the analysis. In addition to examining the linear relationships and criterion-referenced equivalency (Fitness Zone agreement) among prediction models, this study also examined the actual VO2MAX agreement between 1MRW and PACER using Bland–Altman analysis. Relative accuracy at the individual level can be more thoroughly examined between prediction models for aerobic fitness when actual predicted VO2MAX values are compared.
All three PACER models (Linear, Quadratic, and Mile-PEQ) had strong correlations with 1MRW predicted VO2MAX. The prediction errors, assessed using the SEE, were similar among PACER models with error ~3.5 ml−1 kg−1 min−1 using 1MRW as reference. Although there is no standard of what constitutes acceptable error comparing two field methods, the SEE provides an estimate of comparative accuracy among measures within the same sample. The results from this study suggest that the Linear PACER, Quadratic PACER, and Mile-PEQ had similar predictive accuracy. In addition, there were similar Limits of Agreement among PACER models with 1MRW predicted VO2MAX from Bland–Altman analyses. However, only the Quadratic PACER did not show a statistically significant trend between method differences and means. The presence of a significant correlation (trend) between method differences and means suggests that at increasing levels of VO2MAX, the PACER method either over- or underestimated
VO2MAX compared with the 1MRW. The Linear PACER method, because of a negative correlation coefficient, overestimated VO2MAX compared with 1MRW at higher levels (Figure 1), conversely the Mile-PEQ, because of a positive correlation coefficient, underestimated VO2MAX at higher levels (Figure 3). Therefore, even though the Limits of Agreement were similar among all three PACER models, the lack of a significant correlation coefficient using the Quadratic PACER indicates that this model did not display estimation bias with 1MRW in students with higher levels of aerobic fitness (Figure 2).
Theoretically, a significant bias toward over- or underestimating VO2MAX may lead to lower classification agreement between two methods. However, in this sample all three methods of estimating aerobic fitness from PACER showed strong Fitness Zone criterion-referenced equivalency with 1MRW, displaying high kappa statistics and high proportion of agreement (see Table 2). Indeed, the Mile-PEQ nearly had perfect criterion-referenced equivalency with 1MRW for classifying students into the three Fitness Zones. Therefore, the over- and underestimating trends displayed from the Linear PACER (Figure 1) and Mile-PEQ (Figure 3) did not significantly affect students being misclassified into either the HFZ or NIZ subzones in this sample. A possible explanation for this may be that differences in the estimation of VO2MAX only occurred at higher aerobic fitness values within the range of HFZ classification. Therefore, the differences in VO2MAX estimates between 1MRW and PACER occurred in only those students already firmly within the HFZ, so classification was not affected. If the trends displayed in this study hold in other larger populations of school-aged children, misclassification of aerobic fitness may be present. However, the results from this study support that all three methods of estimating VO2MAX from PACER are able to accurately classify students into Fitness Zones when compared with 1MRW, especially the Mile-PEQ where near perfect criterion-referenced equivalency with 1MRW was seen.
There were some limitations to this study that need to be considered before the results can be generalized. First, only middle school students were examined in this study, so the results cannot be generalized to younger or older age groups. Also, the 1MRW was an outdoors test for all students in this study; therefore, various weather conditions may have influenced the results. Despite this potential confounder, all testing was administered during the afternoon in acceptable weather conditions (dry and warm conditions) for all students participating in this study.
Practical Applications and Future Research
All three PACER models, the Linear and Quadratic PACER, and the Mile-PEQ strongly correlated and demonstrated similar prediction error with 1MRW predicted VO2MAX, giving evidence for convergent validity and strong relative accuracy among models. This suggests that all four models examined in this study can be used interchangeably for the prediction of VO2MAX in middle school–aged children. The physical educator incorporating these assessments into their programs for estimation of aerobic fitness can administer either the 1MRW or PACER, with their respective prediction models, to predict VO2MAX without significant differences in point estimates or Fitness Zone classification among models. Despite these encouraging findings, future research needs to examine the convergent validity of these models using different age groups (elementary and high school students) and in samples with a greater range of fitness levels to determine whether the relationships found in this study hold and can be generalized to larger and more diverse student populations.
Conclusion
This is the first study to examine the convergent validity and relative accuracy between 1MRW and various PACER models using an independent sample of middle school students. Findings from this study suggest that all three PACER models gave evidence of convergent validity and strong relative accuracy with the 1MRW model, with the Mile-PEQ showing the strongest ability to accurately classify students into Fitness Zones.
Footnotes
Acknowledgements
The authors would like to thank the administrators, teachers, parents, and students of Early Light Academy, J.E. Cosgriff Memorial Catholic School, and The Madeleine Choir School for participating in this study.
Declaration of Conflicting Interests
The author(s) declared no potential conflicts of interest with respect to the research, authorship, and/or publication of this article.
Funding
The author(s) received no financial support for the research and/or authorship of this article.