
Abstract
This study empirically seeks to connect more strongly the post-Keynesian macroeconomic idea anchored on the balance of payment (BOP) constraint with the evolutionary microeconomic idea related to the dynamics of technological gap in shaping export quality and long-run growth. It employs autoregressive distributed lag model to examine the validity of Thirlwall’s “Law” on the Nigerian economy from 1981 to 2017. The study found that new version of the model improves significantly in explaining long-run growth of the economy. Therefore, it recommends, among others, a cautious reduction of various components of imports especially final consumption, increasing the export share of commodities with high demand in the international market as well as increasing government spending on R&D to enhance export quality for a sustainable growth of the economy.
Keywords
Introduction
This present study proposes to expand the basic proposition of balance of payment constrained growth (BOPCG) theory with particular reference to Periphery-South economy by including real exchange rate (RER) and the role of national innovation system (NIS) in growth determination. BOPCG essentially contends that growth is demand led and, in particular, export led in line with export-led cumulative causation (ELCC) models. This post-Keynesian perspective specifically recognizes the role of external demand and structural change in explaining the long-run growth path of an economy.
Gabriel, Jayme, and Oreiro (2016) recently show, in line with the above, that growth of exports has two most important consequences on the long-run growth rate. First, it increases the growth rate through the dynamic Harrod foreign trade multiplier and, second, by soothing the BOPs constraint. In addition, it allows higher expansion of other “autonomous” constituents of demand. This means that the increase of other autonomous expenditures is essentially endogenous to the growth of export.
Standing on the above background, Thirlwall (1979) put forward a simple demand-led “law” that defines long-run growth rate as the ratio of export growth to income elasticity of demand for imports, assuming that relative prices are constant. This “law” has survived refutation for the past 40 years and has shown to be relevant in many countries (see McCombie & Thirlwall, 1994; Thirlwall, 2012, for history and survey of literature). Similarly, several studies have sought to extend Thirlwall’s law to incorporate the effects of capital flows (Thirlwall & Hussain, 1982), sustainable debt (Barbosa-Filho, 2001; Moreno-Brid, 1998), interest rate repayment on debts (Moreno-Brid, 2003), multisectoral income elasticities among other factors (Araujo & Lima, 2007; Romero & McCombie, 2016), and externally and internally constrained BOPCG models (Soukiazis, Cerqueira, & Antunes, 2013, 2014).
In the post-Keynesian tradition, the link between the RER and domestic income growth has mostly been ignored. In the conventional BOPCG setup in particular, RER dynamics are treated as irrelevant determinants of long-run growth. This is either because of the substantial empirical evidence that price sensitivities of demand for exports and imports are small 1 or that terms of trade fail to demonstrate a logical movement of appreciation or depreciation in the long run (Razmi, 2005, 2016). In spite of this, recent studies, especially those on the Periphery-South, accentuate the significant function of competitive and stable RER in influencing investment decisions, exports, and consequently easing the BOP constraint on growth. Razmi (2005, 2011, 2016) specifically contends that exporters from the Periphery-South cannot compete with producers from the center-North on identical level in international trade. Whereas the center-North has succeeded in properly improving the composition of its export baskets, the Periphery-South economy like Nigeria still lags behind in diversifying its export structure. This makes substitution between the export goods and foreign ones increasingly difficult. Furthermore, even if these economies produce comparable goods, differences in quality as perceived by consumers are likely to make the hypothesis of similar elasticities of substitution unacceptable.
In line with the above, Spilimbergo and Vamvakidis (2003) estimated manufacturing export functions for 56 countries for a period of 26 years. The functions used included standard aggregate real effective exchange rate (REER) or two distinct REERs disaggregated into two parts: standard REER for Organisation for Economic Co-operation and Development (OECD) countries and the other with respect to non-OECD countries. The result rejected the hypothesis of identical elasticities. The results of the two relative prices differ significantly. Hence, it would be inappropriate to assume that the elasticity of substitution between the goods from the center-North and Periphery-South is the same. 2 This argument is anchored on the relative differences in trade shares and product quality. Furthermore, export and import elasticities of relative price differences may possibly be dissimilar across different time horizons. This could be attributed to likely factors, such as production bottlenecks, contractual commitments, changes in policies, information lags, subsistence of a money illusion, and partial exchange rate pass-through in the short run.
Having discussed the rationale for the inclusion of RER as a constraining variable alongside the major demand-side constraint-income, this study equally seeks to incorporate the role that NIS plays in improving export quality and structural change for a small open economy. This addition is motivated by the fact that for a correct determination of long-run growth path of an economy from the Periphery-South, the role of technological learning and upgrading in shaping exports quality as important restriction ought to be included. While in the center-North the principal restriction on long-term growth is foreign demand, as established by traditional Thirlwall’s model, this may not be the same for a country in the South as a result of severe technological gap that subjects Periphery-South exports to low-quality products category.
As indicated in the literature, whereas substantial empirical evidence abounds regarding Thirlwall (1979), only few studies have examined the effect of technological gap in BOPCG framework (Cimoli & Porcile, 2014; Gabriel et al., 2016; Porcile, Dutra, & Meirelles, 2007). Most importantly, the above studies only considered theoretical aspects of the subject. Therefore, this study hopes to bridge this lacuna by empirically linking more robustly post-Keynesian macroeconomics with the evolutionary microeconomic thought related to the role of technological gap in determining export quality.
The remainder of the article is structured as follows. The section, “The calibration of Thirlwall’s (1979) BOPC growth model,” presents the model. The section, “Evolution of export quality: The role of national innovation system (NIS),” covers the role of NIS in shaping and enhancing quality of exports. The section, “The structural change and performance of the Nigerian economy,” presents the econometric method used. It equally accounts for the structural evolution and performance of the Nigerian economy. The empirics regarding the structural characteristics of the variables, descriptive statistics, and the determination of BOP equilibrium growth rates and policy recommendations are given in the section, “Empirical Examination.” The section “Conclusion” gives the conclusion.
The Calibration of Thirlwall’s BOPC Growth Model
As earlier indicated, the objective of this article is to incorporate evolutionary view of the determinants of long-term growth in BOPCG model to examine whether the actual growth of Nigeria is BOP constrained or otherwise. Accordingly, this study augments the most influential model advanced by Thirlwall (1979) with NIS. The specification of the model starts by specifying two sets of equations (1 and 2) as well as an identity (3) as follows:
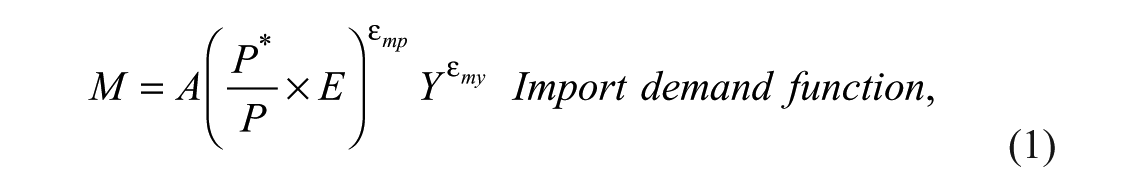

where M is real imports, P is the national price level in the South (denominated in Southern currency), P* is the foreign price level, E is the nominal exchange rate (units of national currency to U.S. dollars), Y is domestic real income, X is real exports, and Y* represents world real income. This study calibrated the initial model by the incorporation of the role of NIS in shaping and enhancing quality of exports. Therefore,
Attaining BOP equilibrium in terms of domestic currency requires that the export equation is equated with the import equation:

When Equations 1 and 2 are substituted into Equation 3, it produces:

After differentiating Equation 4 with respect to time, expressing it in log linear form, and solving algebraically for income growth, it produces an all-encompassing specification as:

Equation 5 reveals that the domestic income growth rate compatible with BOP equilibrium is determined by foreign income growth rate, the center-North, the RER growth rate, as well as the growth rate of quality index of export. The above equation corresponds to the original version of Thirlwall’s BOPCG model with the incorporation of a novel determinant—the quality of exports.
Assumptions
To efficiently apply the model (i.e., Equation 5), the below assumptions are required:
i. The model assumes that there are only two countries in the world economy: center-North and Periphery-South: They produce a single product that is traded without trade barriers with positive elasticity of substitution.
ii. The Periphery-South is a small open economy whose production cannot affect major economic indices in the international market.
iii. The model is exclusively BOP constrained and, for that reason, it is the demand-side factors that determine the growth of domestic income.
iv. NIS is the most important driver of the technological learning process in the Periphery-South: It performs a critical function in the setup because it determines how export quality of products evolves over time.
v. The central problem that Periphery-South is confronted with is how to hasten learning process and trim down the comparative technology gap to advance the quality of the products it manufactures and enlarge the domestic and foreign markets (through improving its export structure and raising nonprice competitiveness).
The fundamental question that remains is “How does export quality evolve in demand-led framework?”
Evolution of Export Quality: The Role of NIS
It becomes relevant to elucidate the endogenous evolution of export quality constraint. Central to this process is the fundamental hypothesis that technology lag or gap subsists that severely challenges the comparative capability of the Periphery-South to enhance the quality of the products it manufactures. Therefore, the rate of change of export quality indicator (
This critical hypothesis (technological gap) finds its basis and authority from both the empirical and theoretical narratives on the factors that determine technological change as well as specialization. Cimoli and Dosi (1996) contend that the evolution of quality of exports follows a cumulative process in which the chances of discovering an innovation and imitating and adapting a leading technological firm (center-North) increases as soon as the firm (for instance, from the Periphery-South) approaches the technological frontier and when considerable externalities (at the industry and country levels) are already in place. This is analogous to Schumpeterian competition, given that it accentuates the importance of increasing returns as well as virtuous circles of learning, competitiveness, and domestic income growth. Specifically, Arthur (1994) maintains that this increasing return is higher for the component of the economy that is knowledge based. The author gave three reasons for this: (a) the knowledge-based component gains from learning by doing and learning by making use of it, (b) the knowledge-based component utilizes experience earned from the use of a specific technology to master associated technologies and to create novel products and processes, and finally (c) the knowledge-based component creates dynamic and hi-tech complementarities that encourages other innovators, imitators, and adaptors.
The above explanation is essentially facilitated by the technological path pursued or established by different countries toward improving quality of its products as well as productive structure. Key to this is the concept of NIS. Albuquerque (1999) views the concept of NIS as an institutional framework that propels technological progress, which enables the flow of systematic and technological information and knowledge essential for the innovation evolution to occur.
According to evolutionary theory, NIS is indispensable for the spread and diffusion of novel knowledge and innovation all over the economy. In addition, it requires the existence of dynamic connections linking diverse participants, including business firms/companies, financial organizations, research/education institutions, public sector funding, liaison organizations, as well as horizontal associates within institutions (Freeman, 1995). The author further contends that there is a relationship connecting the structure of production and income sensitivities of trade flows, which can be explained by the complexity of the production chain in the country. Thus, even countries that have made some progress in industrialization continue to suffer from external constraint on growth when NIS is not in place.
Romero, Silveira, and Jayme (2011) explain that the existence of external crisis on the current accounts of Southern economies is because of their substantial technological backwardness, which mainly stems from the lower stage of development and diffusion of its technological dynamic hub. The basic idea is that new knowledge originating from the technological dynamic hub enhances the trade competitiveness of the structure of production, which makes the export sector to gain from the development of high-quality manufactured goods with superior income sensitivity. This is to say that the achievement of a country in international market depends on product innovation, specifically, producing high-quality products for which world demand will rapidly grow. Therefore, it may be unlikely that simply lowering prices of available goods by compressing costs and real wages will be a sustainable policy in the long run.
Gabriel et al. (2016) recently caution developing countries that economic growth and the prospects for them to catch up with the developed countries is connected to the historical narrative of economic development and the superiority of their NISs. In this sense, economies that have constructed better capability for learning and absorbing spillovers have a greater privilege or chance of catching up. If not, they would continue to remain in a low-growth corner.
Romero et al. (2011) and Resende and Torres (2008) observe that the value of a country’s exports depends on four distinct features of the markets for exported goods: the market structure, the dynamism of the exported product market, the degree of protection, and, finally, the diversification of the productive base of the economy. The last feature is linked to the advancement of NIS, given that the system influences the extent of technological complexity of manufactured national output, with substantial consequences on its exports through the convergence process. The innovation system is critical to Southern economies to realize technological standard as observed in the Northern economies. Thus, the more efficient the NIS, the higher the likelihood of evolution toward the technological frontier of diverse production sectors of the economy. In a somewhat different perspective, Gabriel et al. (2016) employ the framework developed by Bresser-Pereira, Marconi, and Oreiro (2015) to show that an advanced NIS may possibly affect the “industrial equilibrium” RER. Hence, a country with a strong NIS could potentially be more competitive in international trade.
Apparently, the advancement of the NIS permits for better technological sophistication in the productive structure, which is mirrored in the dynamism of trade income sensitivities: superior income sensitivity of export demand and lesser income sensitivity of demand for imports. This ultimately assists in the loosening of the external restriction and higher long-term growth of domestic income. In recognition of the role of NIS in the Nigerian context, different regimes since 1960 have revealed interest in development of NIS in national socioeconomic advancement. The comprehension of this reality stimulated the reestablishment of the Federal Ministry of Science and Technology (FMST) as a distinct body in 1985. Since then, there has been considerable resource allocation to the institution for R&D, though grossly below the 1% of GDP minimum international benchmark prescribed by United Nations Educational, Scientific, and Cultural Organization (UNESCO).
As a synopsis, the nonprice competitiveness of a firm or the aggregate economy depends on the relative technological levels, and that firms or countries nearer to the technological frontier ascend the quality hierarchy and ranking more rapidly relative to the ones that are far off. This exerts substantial consequences on international trade performance. The technological gap could be formally expressed as:

where 0 <
Substituting Equation 6 into Equation 5, while assuming that RER is insignificant in the growth process and λ = 1 (to make the model uncomplicated), the model reduces to:

Equation 7 indicates that domestic income growth compatible with BOP equilibrium rises with world income growth (of the center-North) and the technology gap (
Hausmann, Pritchett, and Rodrik (2005) note that a superior quality of exports tends to promote long-term growth anchored on spillover of knowledge/information, which leads to ever-increasing returns in the manufactured and service sectors of the economy. This means that for viable spillover knowledge from the center-North to Periphery-South, the existence of a sound institution such as the national science technology innovation system ought to be in place. Similarly, Lall, Weiss, and Zhang (2005) construct an indicator of export sophistication based on the average income levels of exporting entities, alongside other conventional measures such as R&D expenditure, to show that the modern sectors of an economy positively respond to export quality and sophistication index. Note that these empirical evidences (Hausmann et al., 2005) are not in BOPCG framework, hence, the necessity of the present article.
Furthermore, when export quality and sophistication is not taken into consideration, the equilibrium growth rate reduces to Thirlwall’s original model:

Or,

Making use of the estimates of the long-run income elasticity of import
The Structural Change and Performance of the Nigerian Economy
The global diffusion of technology is sluggish and unbalanced (Prebisch, 1949). The center-North is at the front in innovation, whereas the Periphery-South is following. Given that technological revolution is strongly connected with structural change and the appearance of innovative sectors, the structure of production of the center-North diversifies passing via most important changes. Nevertheless, these changes and technological revolutions merely got to the localized territories of the Periphery-South productive structure. Consequently, the Periphery-South remains exceedingly concentrated in only some (with low technological content) sectors and places a huge category of its labor force in low productive and subsistent enterprises. Similarly, the long-term deterioration in terms of trade and the volatility of commodity markets are perceived as major constraints to its long-run growth.
In Table 1, the performance of Nigeria’s external sector classified according to the most generally used taxonomy—the Standard International Trade Classification (SITC)—clearly reflects the observation of Prebisch (1949). It is very comprehensible that the export share of mineral fuels constitutes the largest export product for the country 4 and there has been no decline in its export share before and after the Trade Liberalization policy of 1986 until the recent global financial crisis of 2007/2008. Other commodity-based products, namely, beverages and tobacco as well as inedible crude materials excluding fuel showed some upward movement. Interestingly, the share of manufactured exports (machinery and equipment, manufactured basic articles, and chemicals and miscellaneous exports) showed a little improvement especially after 2007. This could be taken as a gradual structural transformation process. Therefore, the Nigerian economy ought to encourage diversification to the export of nonoil sectors, especially by increasing the share of manufactured export sectors in total exports to have capacity to respond and take advantage of international trade opportunities largely emanating from variations in foreign demand.
Structural Evolution of Nigeria’s Export Sector (Percentages).

Source. Computed using trade data from UN Comtrade (2018).
Note. bever. and tob = beverages and tobacco; crude materials = Crude materials inedible excluding fuel; min. fuels = mineral fuels; animal and veg. = animal and vegetable products; chemicals = Organic and inorganic materials; manufacturing = manufactured products chiefly materials; mach and eq = machinery and equipment; misc manufac. = miscellaneous manufactures; unclassified = commodities not classified elsewhere in Standard International Trade Classification.
On the import side, it is clear from Table 2 that machinery and equipment has the largest share. This import category is meant to support domestic production and, perhaps, to increase sophisticated products as the center-North. When firms import high-technological goods, they have the chance to learn from its competitors either through scrutiny or reverse engineering. A cursory examination of the import sectors reveals that Nigeria remains a net importer in virtually all sectors except mineral fuels. The sectoral shares of imports virtually decline after the trade liberalization policy of 1986. Over the period of analysis, the reduction in crude material, animal and vegetables, manufactures, and chemical imported goods is modest. Conclusively, the external structure and performance of the economy is highly unbalanced against the manufactured export sector, which remains the main setback of the economy.
Structural Evolution of Nigeria’s Import Sector (Percentages).

Source. Computed using trade data from UN Comtrade (2018).
Note. Bever. and tob. = beverages and tobacco; crude materials = crude materials inedible excluding fuel; min. fuels = mineral fuels; animal and veg. = animal and vegetable products; chemicals = organic and inorganic materials; manufacturing = manufactured products chiefly materials; mach. and eq. = machinery and equipment; misc. manufac. = miscellaneous manufactures; unclassified = commodities not classified elsewhere in Standard International Trade Classification.
Econometric Method
The long-run estimates used in the computation of domestic income growth rate were obtained by using the autoregressive distributed lag (ARDL) approach. The research also carried out bound test analyses to determine the long-run relationships among the variables. The rationale behind this approach is that it outperforms other cointegration techniques when the sample size is small and when the variables are integrated of different order. Therefore, conducting stationarity tests may only be necessary to ascertain that none of the variables is integrated of an order higher than 1. Similarly, bound testing technique methodology proposed by Pesaran, Shin, and Smith (2001) gives unbiased parameter estimates of the long-run estimates irrespective of endogeneity of some of the regressors.
For cointegration investigation, ΔYt is modeled as a conditional error correction model (ECM):

where Δ represents the first difference of the series and σ captures the speed of adjustment of the variable toward the long-run equilibrium. Y represents the dependent variable. Set of Z variables comprises three potential determinants: growth rate of world real income, RER, and growth rate of export quality index. The study determines the appropriate lag structure of the equation based on the Akaike information criterion (AIC) criteria. 5 The study also proceeds to conduct diagnostic tests, such as the Breusch–Godfrey test for serial correlation, the Breusch–Pagan–Godfrey test for heteroskedasticity, the Autoregressive Conditional Heteroskedasticity (ARCH) errors, normality test, Ramsey Regression Specification Error Test (RESET), Cumulative Sum of the recursive residuals (CUSUM), and Cumulative Sum of Squares (CUSUMSQ). After establishing the adequacy of the models, the study employs the F-bounds test to determine the existence or otherwise of a long-run relationship. The criteria for a long-run relationship is that the F-stat must exceed the (asymptotic) upper critical value (or upper bound) calculated by (Pesaran et al., 2001). The conclusion of F-stat is supported by absolute value of t-stat when it equally falls outside the upper critical bounds.
Empirical Examination
Unit Root Test
Prior to the estimation of the model, unit root test ought to be carried out to ascertain the order of integration of the variables. Nevertheless, for a scope of study as in the present one, it is extremely probable that there could be a structural break in the variables. Accordingly, the ordinary Augmented Dickey–Fuller (ADF) and Philips–Perron (PP) tests may not be sufficient as it is liable to accept the null hypothesis of nonstationarity. The structural break in the stationarity test was initially suggested by Perron (1989). However, Zivot and Andrews (1992, 2002) among others consider Perron’s test as inadequate because it considers structural break points ex ante. It is suggested that the suitable evaluation process ought to be one in which the break dates are endogenously selected by the data.
Consequently, although ADF and PP unit root tests were conducted, this present study basically uses the tests suggested by Zivot and Andrews (ZAU; 1992) thereafter, for the analysis. The ZAU test is a chronological test that uses the complete sample and utilizes diverse dummy variables for every potential break date. A break period is selected where the t-stat is smallest (in absolute levels), which gives the most convincing proof against the null assumption. Generally, ZAU test is always carried out based on three models:


where,
Accordingly, it is possible to test the null hypothesis for all the equations,
The results from Table 3 permit investigation, given that none of the variables is I(2) or of any higher order.
Unit Root Test Result.

Source. Author’s computation.
Note. The critical values of ADF and PP at .10, .05, and .01 are approximately −3.62, 2.96, and −2.62, respectively. Therefore, */**/*** signify significance at .10, .05, and .01, respectively.
The critical values of ZAU with intercept at .10, .05, and .01 are: −4.58, −4.936, and −5.43, respectively. Therefore, †/††/††† indicates their significance at respective critical point.
A substantive description, explanation, and sources of the series are clearly presented in the appendix.
Descriptive Statistics and Overview of the Nigerian Economy
To fully understand the dynamics of the overall economy, a descriptive statistics is conducted and presented in Table 4. By observing the historical tendency of the growth performance of the economy, average growth of the economy is about 4.77% with maximum and minimum values at 21.18% and –10.75%, respectively. The minimum growth rate could arguably be regarded as the initial effect of the structural adjustment program (SAP) in 1987.
Descriptive Statistics of Variables Used in Growth Calculations.

Source. Authors’ computation.
This is further illuminated by the long trend of the variable in Figure 1.

Real GDP growth rate.
The economy moved from the lowest negative growth to the highest growth in 2002, perhaps due to the positive impact of private sector–led development pursued by the democratic government after the collapse of military regime as well as phenomenal rise in oil prices that tends to have significant consequences on the growth.
Considering the value of standard deviation that stood at 6.02%, it could be said that there is a considerable dispersion in the series, which is supported by the high value of measure of kurtosis 4.30, indicating that real GDP growth is leptokurtic. The Jarque-Bera statistics indicates that the variable is normally distributed. As for the distribution of the entire series, Jarque-Bera statistics reveal that the variables are normally distributed except growth rate of world real income and RER. 6
Note that Nigeria is the 26th largest economy in the global ranking. In addition, it is the leading economy in Africa where it is the principal exporter of oil products, with the biggest natural gas reserves. Due to its rebasing exercise, Nigeria’s GDP approximately doubled from US$270 billion in 2013 to US$510 billion in 2014.
This GDP increase by about 90% resulted from, inter alia, reestimation of the contributions of certain sectors of the economy, such as telecommunications, entertainment, and retail, which were previously not captured or underreported; the informal sector was reestimated to account for about 44% of GDP (World Trade Organization, 2017).
Regarding export quality index, it could also be said that the variable is normally distributed with the rate of change of about 20.09% corresponding to 1989. Perhaps, the reestablishment of the ministry of national science, technology and innovation system of 1985 substantially contributes in the improvement of the index.
Nigeria’s local currency—the Naira—has struggled against the dollar since the 1980s, which makes its management very difficult. The growth of RER averaged 2.785111 over the sample period. The country has passed through different foreign exchange rate policy regimes. Before 1985, exchange rate policy was fixed parity exclusively with the British pound sterling and the U.S. dollar. The policy shifted to market-determined monetary targeting in the first phase of liberalization program trade policy (1986 and 1993) and RER appreciated to 178.0913. Similarly, following the transition to democratic rule, the need to broaden and deepen the foreign exchange prompted the implementation of the interbank foreign exchange market (IFEM) 2000 to 2015. It was recorded that at the inception of IFEM the RER index oscillated approximately on a constant drift with indication of appreciation of the exchange rate index (148) compared with the initial period. Given this situation, it cost the Central Bank of Nigeria (CBN) approximately US$100 million each day to preserve the local currency within the conventional band of 160 to 176 to the U.S. dollar before 2015, causing 25% reduction in foreign reserves to roughly US$33 billion. However, the intervention could not prevent the local currency from plummeting in the face of oil price decline. The CBN further imposed controls on deposit money banks’ foreign exchange transactions, blocked the authorized foreign exchange auction platform/window, and routed those trading activities to the interbank market. The interventions, however, continued to widen the gap between the rates existing in the interbank market and unofficial markets or bureau de change operators.
Nigeria recently had to abandon the pegged/fixed exchange rate for floating exchange system to see if it could achieve stability in the foreign exchange market. Though still less competitive, in the most recent year, 2017, RER index improved to 115.4815083 from 127.4815083 in 2015.
After achieving the highest growth of about 60.21% a year before the global financial crisis, the export sector suffered the most loss in 2009 with a growth rate of about −30.7018430%. This slow growth is attributed to the fall of commodity prices in the international market as well the unbalanced productive structure of the economy. With fall in government revenue and deteriorating exchange rate, the stability and fiscal sustainability of the Nigerian economy over the medium- and long terms seem depressing.
Testing the Model on the Nigerian Economy
The basic research question of this part of the study can be clearly stated as follows: To what extent does the incorporation of evolutionary determinant of growth in BOPCG model explain Nigeria’s economic growth process? And, in achieving this objective, Equations 1 and 2 are estimated to determine the elasticity coefficients essential for the computation of the growth rate of domestic income consistent with BOP, as specified in Equations 5 and 7.
From a cursory examination of the overall results from Table 5, it can be asserted that the parameter estimates are obviously in conformity with the underlying theoretical postulations as they demonstrate their expected signs and significance. Starting with the export demand equation, it is shown that the export growth is highly elastic and statistically significant to changes in the growth of world real income (
Estimated Elasticities of Export Demand Function for Nigeria, 1981 to 2017.
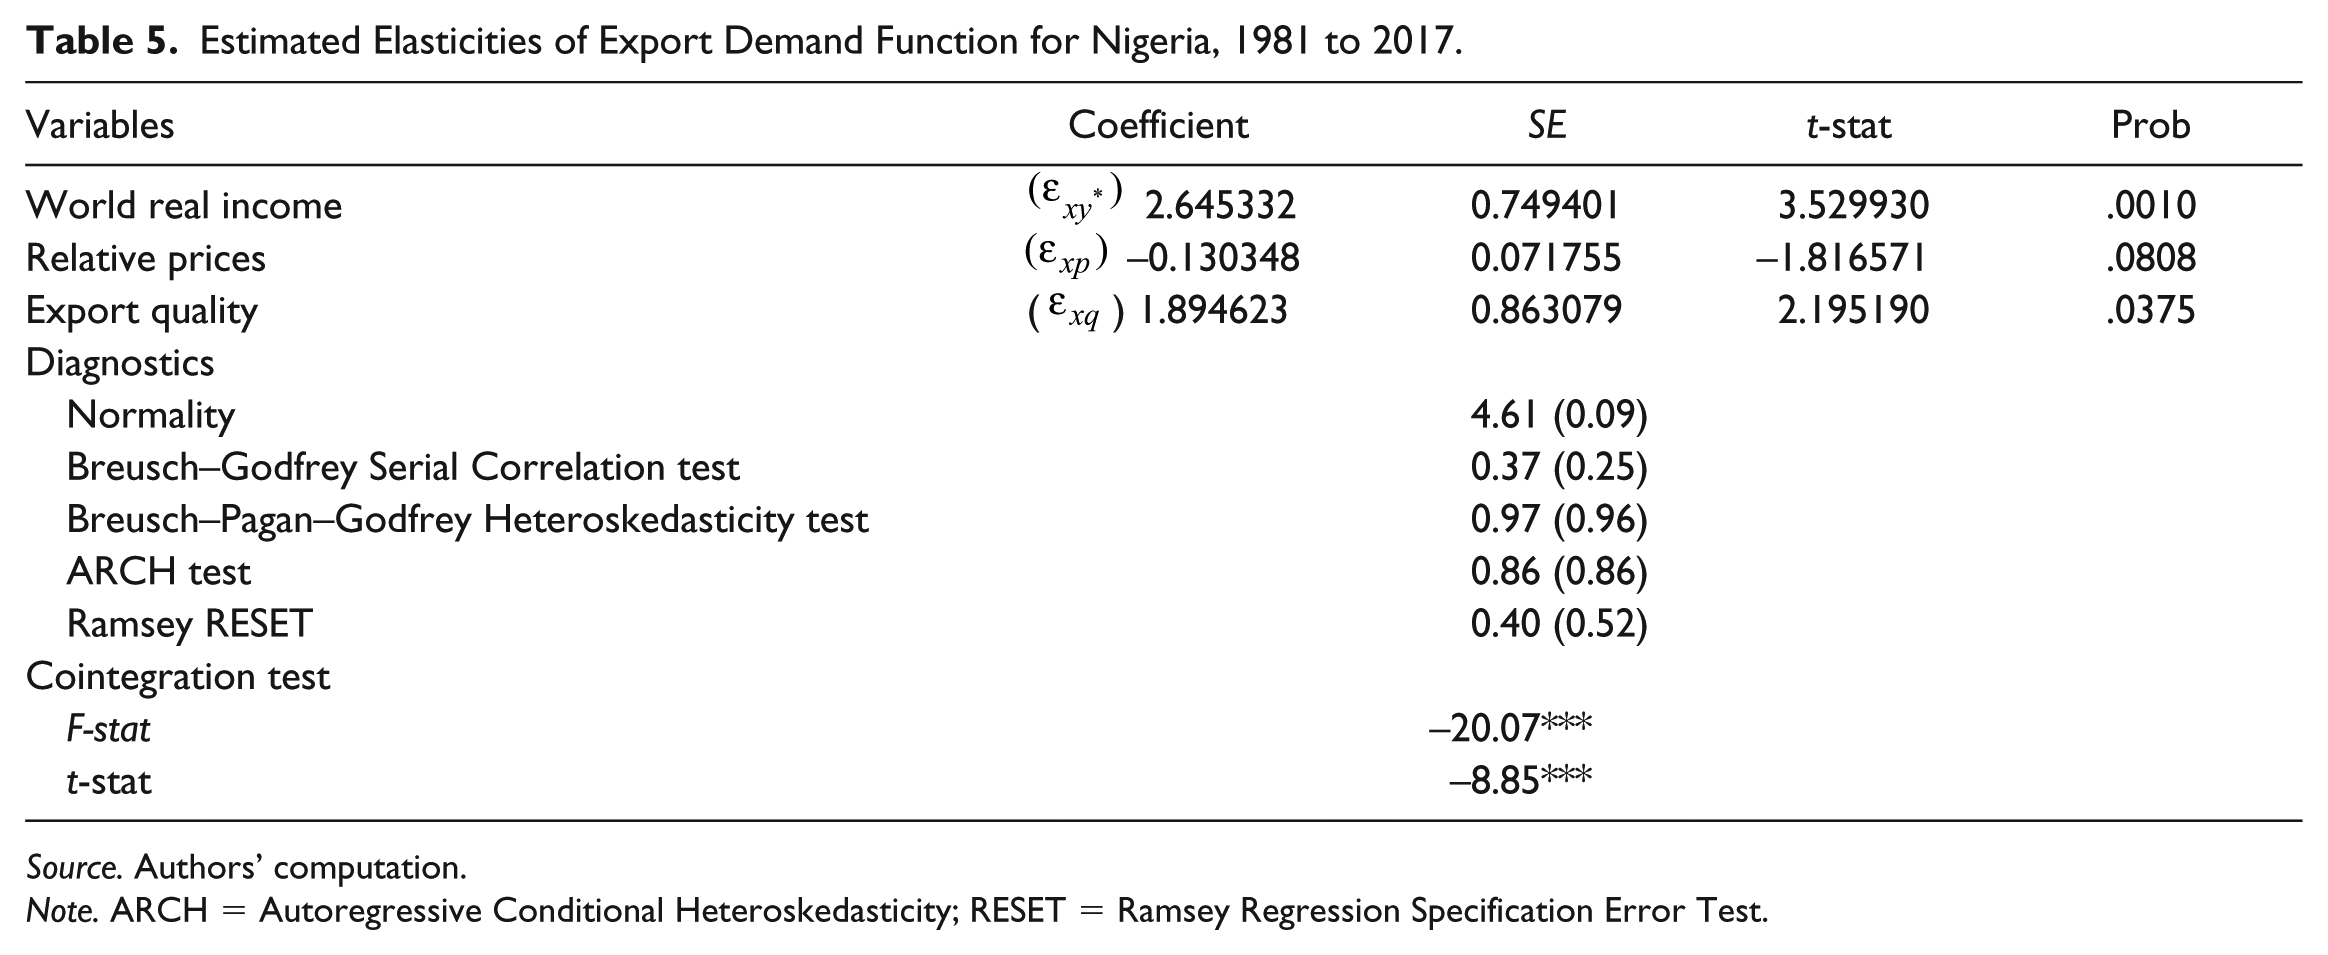
Source. Authors’ computation.
Note. ARCH = Autoregressive Conditional Heteroskedasticity; RESET = Ramsey Regression Specification Error Test.
An important aspect of the present study has to do with ascertaining the role of NIS in facilitating the evolution of quality content of exports as well as how it contributes to improving productive structure. The study found that the export growth is highly elastic to variations in export quality index (
Our findings show that there is a long-run relationship between the variables, given that the F-stat falls outside the upper critical bounds at .01 level of significance. This is similarly confirmed by t test at the same level of significance.
Note that Thirlwall’s initial model requires the computation of the aggregate income elasticity of demand for imports. Here, ARDL model with structural break for the estimation is employed to obtain robust estimates as follows:

Real imports (m) depends on real domestic income (y) and RER
The Breusch–Godfrey Serial Correlation test of autocorrelation shows that there is no problem of serial correlation in the equation residuals. Similarly, Breusch–Pagan–Godfrey Heteroskedasticity test as well as the ARCH test confirm that variance is homoskedastic in the long run. Finally, the normality hypothesis of residuals also confirms that the residuals are distributed normally.
Similarly, Ramsey RESET is implemented to further illuminate our analysis. The outcome of the test in Table 5 shows that there is no specification error in the model as the coefficient on the power of fitted dependent variable is greater than all the levels of significance (.10, .05, and .01). Therefore, it is concluded that the estimated equation does not suffer specification error. This is further supported by the residual stability tests, CUSUM and CUSUMSQ, in Figures 2 and 3. The decision regarding these tests is that when the statistics fall within a .05 level of significance represented by two direct lines whose functional form is specified in Brown, Durbin, and Evans (1975), it is concluded that the estimated elasticity coefficients of the variables are stable over time.
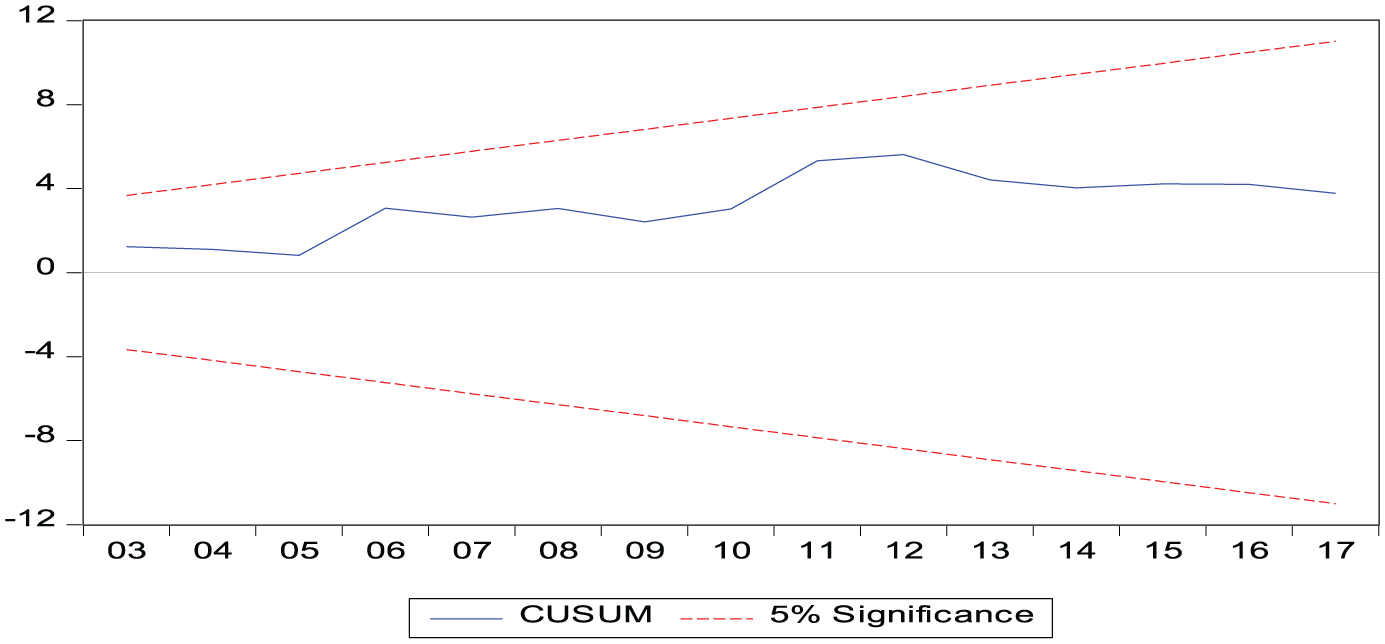
CUSUM Plot.

CUSUMSQ Plot.
Given that the statistics of the two tests are inside the .05 level of significance, it is concluded that the estimated model is stable.
Computation of the Growth Rates
Having obtained the required growth rates and elasticities, it is then possible to calculate the growth rate compatible with the BOP equilibrium and it put side by side with the actual growth rate over the period 1981 to 2017. The long-run averages in Table 6 are taken from the descriptive statistics in Table 4.
Determination of BOP Equilibrium Growth Rates.

Source. Authors’ computation.
Note. Income (
The article estimates two main equilibrium rates of growth. From Equation 5, the BOP equilibrium growth rate obtained as ẏB1 = 5.16% is higher than the actual growth rate ẏ = 4.77% for the time frame examined. Therefore, one may assert that Nigeria grows at a rate that is 0.39% relatively lower per annum than that permitted by the BOP equilibrium condition. When Thirlwall’s model as specified by Equation 7 is estimated, BOP growth turns out to be lower (ẏB2 = 4.07%) than the actual growth of domestic income (ẏ = 4.77%). Therefore, without considering other factors, one may assert that Nigeria grows at a rate that is −0.70% relatively higher per annum than is permitted by the BOP equilibrium condition per se.
Therefore, relying on the estimate of Equation 5, which incorporates all relevant determinants, it is asserted that Nigeria grows slower than the rate permitted by BOP equilibrium. In line with the intuitive prediction of the BOPCG model, Nigeria has enormous capacity to accelerate growth than it actually experienced. It is evident that growth of domestic income could be biased downward when RER and the role of NIS in enhancing export quality are disregarded in BOPC growth model. To grow at a sustainable rate, Nigeria ought to grow at equilibrium growth rate of ẏB1 = 5.16% if the NIS is fully exploited and when RER is set at a competitive level.
Policy Recommendations
A genuine policy recommendation for the Nigerian economy to be on a sustainable rate of growth without upsetting the BOP equilibrium has to do with developing policy measures that improve the external performance as well as encouraging NIS toward the export of products with high quality in the international market.
Regarding the first policy recommendation, Nigeria needs to design or sustain policies that have the capacity of raising the export share and income sensitivity of demand for exports. Recently, the Nigerian government launched the Nigeria Industrial Revolution Plan (NIRP) 11 after the global financial crisis, with a policy objective of ensuring that export goods have substantial market share and are competitive in the global market. Sustaining the policy measure would be desirable. In the same vein, supporting the manufacturing export sector to cheaply import critical factor inputs that it can’t produce (capital goods, raw material, and other intermediate products) duty-free would also be a commendable effort.
For the reason that relative prices matter for growth in the Nigerian context, a purposeful and sound policy ought to be evolved to dampen the import elasticity of demand for imports, especially the final consumption component that the country largely has the capacity to produce. In 2015, the CBN identified over 40 products for which it would cease to finance their importation. The bank puts the cost of importing the items (ranging from rice, frozen chicken, flour, textiles, and soap to personal jets) at US$12.3 billion. This is costly for the country, given the continued fall in government revenue and need to increase public expenditure to cater for about 200 million people. Sustaining this policy requires making local manufactured products more desirable and attractive in the domestic market (by enhancing the supply characteristics of the products—quality, packaging, designs, and product differentiation) and placing high tariffs on luxurious imports. In addition, volatility in export prices could be minimized if Nigeria sustains its membership in several commodity agreements for which it is a signatory, such as the Organization of the Petroleum Exporting Countries (OPEC), Tin Agreement, the International Sugar Agreement, the Coffee Agreement, the Cocoa Agreement, and the Natural Rubber Agreement.
Similarly, given the enormous technological gap and the significant contribution of export quality to export growth, developing an efficient NIS is necessary. Nigeria ought to take advantage of the high-tech imports not only toward improving export share and performance but also by domesticating, assimilating, and adapting the foreign technologies, which would encourage the process of technological upgrading through technological diffusion. This would sustainably enhance the technological content, elasticities, and demand for the manufactured products in the international markets in the long run. Following the “Asian Tigers,” especially South Korea, copying and imitating foreign technology will assist in bridging the technology gap and bolster external performance and sustainable growth of domestic income. Therefore, public authorities have a function to perform in raising R&D expenditure from the present 0.27% as percentage of GDP to meet the UNESCO standard of at least 1% of GDP. 12 This could be in the form of direct financial support of scientific and industrial research. Similarly, reducing taxes on firms to benefit from lesser tax rates on profits earned via patents, research, innovation, or other ingenious enterprises would be appropriate. Other essential recommendations may include investment in human capital, investing in infrastructure, and public–private partnership toward creating conducive environment for research and innovation. This would assist in improving the country’s ranking in Global Competitiveness from the current 125th out of 137 to a more superior and competitive level. This would also encourage the inflow of foreign direct investment (FDI) and, given that FDI is often characterized with substantial hi-tech technology, the opportunity of learning and adapting foreign technology would increase.
Conclusion
The view that BOPs imposes a binding restriction on long-run growth of domestic income has been a major area of much analysis by demand-side-led growth theorists, particularly ever since the emergence of Thirlwall (1979). The present study reevaluates the BOPs constrained growth (BOPCG) framework by the use of a model that parsimoniously blends post-Keynesians and evolutionary perspectives and produces results close to the original model. The study uses ARDL to basically take into consideration the heterogeneous nature of order of integration of the variables, which spans 1981 to 2017.
The coefficients of the variables are in conformity with a priori expectation in terms of signs, magnitude, and significance. It clearly reveals that when relative prices and the export quality index are not included in the estimation, domestic income growth rate may be biased downward. Although the empirical investigation indicates that the various versions of the BOPCG theory are appropriate for determining growth path for Nigeria, a plausible hypothesis is, however, one that need not only be correct mainly because of demand-side factors only. Evolutionary microeconomic factors relating to technological gap in shaping quality of export products are also important for a developing country.
The study therefore recommends, among other things, three structural changes that have the capacity of increasing the growth rate of domestic income without hampering the BOPs position of the economy: (a) raising the export share of exports; (b) cautious reduction of various components of imports, especially final consumption; (c) changing or improving the income sensitivity of exports; and (d) investment in R&D activities; when technical know-how changes, individuals can create more with either the equivalent quantity or lesser inputs, thus raising productivity. When productivity increases, domestic income follows suit. Similarly, Nigeria ought to formulate and execute policies toward adapting and domesticating foreign technology into the production of medium and high-tech manufactured exports to optimize the gains derivable from international trade in the long run. Therefore, it is obvious that if Nigeria is to efficiently transform its economy and assume her due position in the comity of nations, export and NIS ought to be ascribed the utmost priority.
Footnotes
Appendix
Declaration of Conflicting Interests
The author(s) declared no potential conflicts of interest with respect to the research, authorship, and/or publication of this article.
Funding
The author(s) received no financial support for the research, authorship, and/or publication of this article.