
Abstract
This article illustrates the links between different ways of assessing disadvantage at school and subsequent qualification outcomes at age 16 in England. Our previous work has compared variables that represent current or recent snapshots of disadvantage (such as eligibility for free school meals [FSM]) with long-term summary variables and found the latter to improve measures of both social segregation between schools and explanations of raw-score differences in attainment. This new work takes an even more detailed longitudinal approach, modeling the course of one age cohort of 550,000 pupils from the National Pupil Database through their entire schooling to the age of 16 in 29 distinct analytical steps, using “effect” sizes, correlations, and a regression model. The steps represent stages such as what is known about each pupil when they were born, who they attended school with at age 10, and where they lived at age 14. The model also includes variables representing where data are missing for any pupil in any year. Using capped Key Stage 4 points as an outcome measure, these stages can predict the outcome with R = .90. This is considerably higher than for models using either snapshots or summaries of disadvantage. Key predictors are poverty and special educational needs at age 5, and throughout schooling, coupled with prior attainment at ages 6, 10, and 13. With predictors fed into the model in life order, there is little evidence of differential progress for different language and ethnic minority groups and no evidence of regional differences or a type of school effect. The article concludes with the implications of these results for assessing disadvantage when considering school contexts and for policy makers. Given the small but apparently consistent negative school composition “effects” in every year, one clear implication is that school intakes should be as mixed as possible both socially and academically.
Keywords
Introduction
Measuring Disadvantage
In England, schools have traditionally received extra funding for pupils with special educational needs (SEN), disabilities, and learning challenges. Since 2010, schools have also received additional funding, known as the Pupil Premium, proportional to the number of disadvantaged pupils they take. This is partly based on a number of small categories such as living-in-care, but the vast majority is based on pupils known to be living in relative poverty according to official records. The basic indicator is eligibility for free school meals (FSM), a welfare entitlement for those pupils from families on income support and related measures. FSM eligibility is collected officially, reported to government, has a clear legal basis, and requires documentation. It forms not only the basis for the Pupil Premium but also a useful indicator of context for school performance and national inspections.
FSM eligibility is not a constant characteristic of an individual pupil, in the same way that ethnicity or sex usually is, but is linked to the economy and family circumstances, meaning that some pupils move in and out of FSM eligibility over their school careers. It has already been established that traditional measures of FSM eligibility have some limitations. A small but important number of disadvantaged pupils are missing key data on eligibility, and they are unevenly spread between schools (Gorard, 2012). This can affect their education directly by denying their schools Pupil Premium share and making their schools appear to be performing worse than they actually are using contextualized measures, in Ofsted inspections, and in calculations of the Pupil Premium attainment gap. This would make them doubly disadvantaged. In addition, using current FSM status means ignoring what Noden and West (2009) termed a “hidden poor” of those pupils previously eligible for FSM but not subsequently (p. 4). These pupils may still be suffering the impacts of earlier disadvantage. Partly for this kind of reason, the Department for Education now produces a measure “EverFSM6” which covers pupils both currently and previously eligible for FSM over the past 6 years. This is what is now used for Pupil Premium calculations, and so for calculating the Pupil Premium attainment gap. This gap compares the results in each school for Pupil Premium pupils and the rest. A large gap is seen as an undesirable outcome.
However, even this may not be enough. EverFSM6 still ignores pupils in secondary school who had been eligible more than 6 years previously. This “invisible” group has attainment results that are in some ways more similar to the EverFSM6 pupils than those who have never been eligible. This is an argument for extending the analysis over more than 6 years. Also, all EverFSM6 pupils will trigger receipt of Pupil Premium by their schools, but their absolute level of deprivation may vary considerably in a way that is subsequently linked to their attainment. There are marked differences between those currently FSM-eligible and those not currently eligible but who are EverFSM6. The not currently eligible pupils are closer both in other characteristics (such as ethnicity) and in attainment to those who have never been eligible than the currently eligible pupils are. This makes using the Pupil Premium attainment gap intrinsically unfair, by favoring those schools or regions with more pupils moving across the threshold and fewer who are FSM-eligible year-after-year (Gorard, 2018). Therefore, analyses have been run, and found to create stronger predictive models, using the number of years that any pupil is known to have been FSM-eligible, and other indicators of possible disadvantage such as SEN (Gorard and Siddiqui, 2018).
This article looks at how we can best combine indicators of pupil disadvantage when looking at relative school performance in England. Our prior work has been based on more sensitive measures of disadvantage such as duration rather than binary classifications (Author, 2018). One example is the duration of poverty. Using the number of years a student has been known to be eligible for FSM and how segregated a school system is by poverty and other indicators of disadvantage, it is possible to explain substantive differences such as the apparently superior attainment of schools in different regions and of different types. Any policies predicated on surface differences in attainment are being misdirected. There are implications for policy in terms of regional comparisons of school performance, the “effectiveness” of different types of schools, educational effectiveness more generally, and how we assess the clustering of disadvantaged pupils in particular schools and areas. The results suggest that current school performance figures, including Progress 8 in England, are unfair to the most disadvantaged schools.
Segregation Between Schools
Pupils from poorer backgrounds have substantially lower attainment at school in the United Kingdom and around the world, and they make negative progress compared with other students while at school, meaning that the poverty gap widens (Department for Education [DfE], 2017; Rutkowski, Rutkowski, Wild, & Burroughs, 2018). Schools can make these inequalities worse through their method of allocating places to pupils. A key issue, therefore, is the clustering of poverty within particular schools—the extent to which poor pupils go to schools with others like them. In England, around 30% of students would have to exchange their schools if this social segregation between schools were to be eliminated. Evidence from around the world shows that such segregation is unnecessary and harmful to students (Gorard, 2018). It is associated with greater unfairness in practice, worse opportunities for the most disadvantaged, lowered aspirations, and lower participation rates in later education (Schmidt, Burroughs, Zoido, & Houang, 2015). It may reduce tolerance and understanding between the segregated groups (Platt & Burgess, 2018).
The clustering of students with similar characteristics in particular schools is partly determined by factors outside education, indeed often outside immediate government control. The economic cycle, the nature of regional populations, residential segregation within regions, local population density, the quality of public transport, and patterns of recent immigration are all determinants of either the level or trend in social segregation between schools. Other determinants are quite clearly within education and government control. The policy of inclusion for children with disabilities and learning challenges and the growth of diagnoses for nonvisible disabilities have led to a general decline in segregation by SEN. The allocation of oversubscribed school places in terms of catchments, distance, or feeder schools exacerbates the impact of existing residential segregation (Saporito, 2017). Policy solutions include area-wide banding or local authority lotteries when allocating contested school places, combined with means-tested free travel, to any feasible school rather than simply to the nearest available. However, the biggest single controllable factor is the diversity of national school provision.
The quality of education available in a national school system should not depend upon where a student lives or which school they attend. Therefore, new school types or schemes for only some pupils are not the way forward. For example, faith-based and grammar schools take many fewer poor pupils than expected (DfE, 2017), thereby increasing local segregation between schools. The poverty gap in education will more likely be reduced by reducing differences between schools, opportunities, and treatments, than by celebrating them. There should therefore be no state-funded diversity of schooling, with the state willfully continuing to provide what they claim (by implication) is an inferior experience for some. For example, if grammar schools were clearly better schools, then their advocates are effectively arguing that the 80% of local pupils in secondary-modern schools or the 100% in areas without grammar schools should be condemned to an inferior education by the state. In fact, it is not yet clear that any type of school is better than any other, and so the money invested in them could have been used more fruitfully elsewhere. All young people should be included in mainstream institutions as far as possible. Controlling the school mix like this is one of the most important educational tasks for central and local governments—but it is one that they routinely evade (or worse).
School Effects?
School composition “effects” linked to this segregation between schools appear once individual variation has been accounted for and when the school average prior attainment or pupil background is still linked to individual pupil attainment. This composition effect might suggest that pupils in very disadvantaged schools do much worse than expected. If accepted, this has implications for policies on allocating school places. Composition effects appear stronger where the sorting of pupils into different tracks by ability is stronger (Danhier, 2018).
However, much of the literature suggests that composition effects are small to nonexistent (Gorard, 2006a). Relative attainment between stages of schooling is very stable over a pupils’ school career, even when their home and socioeconomic status (SES) background changes. There is, therefore, a high correlation between pupils’ school grades in successive years, and this means there should be little scope for strong composition “effects” (Marks, 2018).
There is a reported danger of under- or overestimating school compositional effects due to measurement error, making them appear as phantom results (Televantou et al., 2015). Pupil-level measurement error can produce spurious school-level compositional effects. As pupil data become less reliable, it picks up less of the variation in outcomes, but the aggregate school figures are more tolerant and so now pick up some of that variation (Gorard, 2006b). Perry (2018) suggests adjusting regression models of school performance for the average school outcomes and demonstrates why—based on value-added analyses in England over time. In years when value-added (VA) models were corrected for school-level outcomes, then the correlation between VA and raw scores was lower, as it should be. Otherwise it was high at .7 or more, meaning that value-added was not an independent estimate of progress made by pupils. As with improved measures of disadvantage (above), this has implications for measuring the supposed performance of schools net of their pupil intake and for claims about the superiority of different types of schools in England, such as Academies, Free schools, and faith-based and grammar schools.
Regional Comparisons
In England, policy makers frequently make comparisons between school outcomes in different regions, and use these to direct policy and funding. For example, the former Chancellor George Osborne and the former Chief Inspector of Schools in England Michael Wilshere have both stated that attainment at age 16 is too low in the North of England (Holliday, 2017). According to Ofsted, there are more than twice as many secondary schools judged inadequate in the North and Midlands compared with the South and East. Such claims influence policy in and beyond education, including whether to improve transport links in the North (Bounds & Tighe, 2016). According to the Confederation of British Industry (CBI, an employers’ federation), ensuring that pupils get good General Certificate of Secondary Education (GCSE) or equivalent qualifications would be the most effective way of tackling productivity differences across the United Kingdom, rather than prioritizing faster road and rail links in the Midlands and North of England as the government had planned to do. This has led to demands that schools in low-attaining areas like the North of England should improve so that they are not letting their pupils down. A frequently used example of how to do this is the London Challenge, which was supposedly successful in raising the attainment of poor pupils even in heavily disadvantaged authority areas (Hutchings, Greenwood, Hollingworth, Mansaray, & Rose, 2012).
These claims about regional differences in school performance are examined in the model that follows in this article. However, it is worth noting that schools in London have received more funding per pupil than schools in the North for a long time, and that this funding increased further for the London Challenge. And that the London schools started their challenge with already higher attainment and a lower poverty gap. No account was taken of the economic recession, leading to parents not using private schools so much, and the historic differences in use of private schools between North and South. Nor was full account taken of the very different ethnic compositions of the two regions. The London results were perhaps largely the “effect” of socioeconomic background and other geographical differences (Burgess, 2014). It is not clear how successful the London Challenge really was.
All of these issues are investigated further in the research that follows.
Method
The research presented here is based on the National Pupil Database (NPD) for England—specifically the 2015 Key Stage (KS) 4 cohort, with attainment, school, and background information for every year that they were in compulsory schooling. Similar analyses to the ones described here have been conducted with the 2014 and 2016 KS4 cohort, with the same substantive results. There were 549,186 pupils with relatively complete records. Any missing data mostly arose where the pupil had previously not been part of the state-funded sector in England (perhaps moving to England from elsewhere). Most variables had little or no missing data for KS4, so there were no missing values at all for pupils’ sex or their month of birth. But missing data increased for records of pupils’ prior years at school. For example, 668 of the KS4 cases were missing KS2 attainment data, and 181,111 were missing KS1 attainment data.
For all categorical background variables, such as whether a pupil was identified as having a SEN in any year, a further flag variable was created for that year recording whether each pupil was missing a value for that measure. Pupils with missing data are often very different from the average, and this has to be taken seriously in analysis (Gorard, 2012). Cases with missing values cannot simply be deleted as this would lead to high attrition and a huge potential for bias (Gorard, 2010). The missing values in the original version of the variable were recoded as “not known,” as having an SEN or other indicators of possible disadvantage. For all real-number variables, such as KS1 attainment scores, any missing values were noted and replaced with the national average for that cohort. This is not entirely satisfactory but is judged to be the best way to retain all cases, without ignoring missing values or unduly affecting the results of the models used. Trying to “predict” missing scores using the data that are available is more likely to bias the results than using the average.
A regression model was used to predict the KS4 capped GCSE or equivalent scores for each student. The version of NPD used in this article included all of the background and attainment variables, except those that are very sensitive (such as living-in-care) or most disclosive (such as the most detailed SEN or ethnic group information). The explanatory pupil-level variables include the following.
Attainment
KS1 points score—attainment at age 7
KS2 points score—attainment at age 11
KS3 levels—attainment at age 14
Pupil characteristics
Birth month and year—used to compute age in year
Sex of pupil—still recorded as a binary in 2015
FSM eligibility—a flag variable showing whether a pupil is from a home officially classified as having an income below the poverty line
Ethnic origin or group (major)
English as an additional or second language
Special needs with or without a statement
School and home
School type attended
Local authority area of school and home
Index of Deprivation as a Child Index (IDACI) score—a measure of average deprivation for the area where the pupil lives or goes to school
Whether the pupil moved to the current school in the past 2 years
These variables were examined for each of the 11 years from pupils entering primary school up to end of KS4 (2004/2005 to 2014/2015 academic years). Some values such as school attended or area of residence changed over time, notably when pupils moved to primary schools. Some, such as English as an additional language (EAL) or ethnicity, show the development over time of the official system of identification or of the pupils themselves.
New variables were created, usually by combining two variables or summarizing changes over the school career. Apart from new variables flagging all missing data, the pupil- and school-level variables derived from the data include the following:
Attainment
Mean KS1, 2, and 3 scores for each school
Pupil characteristics
The month of birth in the school year—relative age within year group
The number of years in total a pupil was eligible for FSM, or identified as EAL or SEN, up to KS2, 3, and 4
Flag variables representing each category of ethnic group (Major), SEN or not, and SEN statement or not, for each year
Flag variables representing whether a pupil was FSM-eligible for every year of their schooling
School and home
The number of pupils, and the number of pupils in each background category, in each school
The between-school FSM segregation residual, for each school
The between-school segregation residual of pupils always identified as FSM-eligible, for each school
Flag variables representing school type, such as Academy Converter or not
Economic region of England
Whether a pupil attended school in the same local authority as residence
Whether a pupil attended school in an area with grammar schools
The between-school segregation residual for FSM eligibility is the amount by which each school’s intake deviates from the national average (using the Gorard Segregation Index [GS index]). In this case, it is the difference between the number of FSM pupils in each school cohort divided by the number of FSM pupils in that cohort in England, and the number of all pupils in each school divided by the number of all pupils in England (Gorard et al., 2003).
All possible predictor variables were considered in terms of their link to KS4 attainment scores. Real-number predictors were correlated with KS4 attainment using Pearson’s R coefficients, and the mean KS4 attainment was compared for each category of categorical variables. The latter were converted to “effect” sizes by dividing the difference between means by their overall standard deviation.
A regression model was developed over a considerable period to create a result with the largest R value (“effect” size), but the fewest, simplest set of predictors with relatively stable coefficients. For this reason, we did not include interaction terms here, even though they are theoretically interesting while hard to interpret. Having fewer predictors not only simplifies the eventual explanation, it also considerably reduces the problem that best-fit regression models can find spurious explanations with even random “predictors” as long as the number of predictors is high relative to the number of cases (Gorard, 2006b). And it reduces any problems caused by collinear predictor variables, such as predictors changing sign unexpectedly.
The outcome or “predicted” variable is the KS4 capped GCSE (or equivalent) score for each pupil. Prior attainment scores are clearly linearly related to the outcome scores, as are the other real-number variables such as IDACI scores. Most of the other predictors are dummy or flag variables, such as eligibility for FSM or not. The predictors were added to the model in groups representing years at school, including everything that was known about the pupils at that time. For each year, individual data were entered first, followed by school-level aggregates. Therefore, the first group included the sex and age-in-year of the pupil, plus other background variables for 2004/2005 such as ethnic group, EAL, SEN, and FSM, whether any of these was missing for that year, and then the school and home terms for that year. Many of the flag variables, such as SEN status, are used for each year. The values for any pupil can move between the two states every year, and so this analysis is similar to a lagged approach. Results are shown for each step, including the impact that each new variable or set of variables makes to the overall model. The 2005 data set provided did not contain ethnic group or SEN. Therefore the 2006 ethnicity and SEN data are used for the baseline in Year 1. A further step was included for any year that represented the end of a KS—including the KS1, KS2, and KS3 attainment scores for pupils and schools. At end of KS4, variables were added representing summaries such as the number of years a pupil had been identified as EAL. Variables were then added representing regions of England and type of school attended at KS4. Entering the predictors like this clarifies the key possible determinants of KS4 attainment at school, in strict biographical order (so that later values cannot act as proxies for earlier ones). For the full model, the standardized coefficients are shown for each step. Where the coefficient is effectively zero, or the variable has been removed as having no variation or otherwise not relevant to the model, the result is displayed as “-.”
The eventual model is not any kind of definitive test, and any correlations with the outcomes do not necessarily imply causation (although absence of correlation does imply no causation). In development, each variable was added to and removed from the model individually and the results checked for changes in R and substantial changes in coefficients. Those that made no difference (to four decimal places) were omitted. Separating the variables into more or fewer steps, using fewer variables, and handling missing data differently, all lead to slight differences in the sizes of R and the coefficients. However, the main model presented is tolerant of changes, and minor changes in format do not lead to unexpected changes in the sign of the coefficients.
The data represent all pupils in state-maintained schools in England. Therefore, issues such as statistical generalization, clustered standard errors, and significance testing are not relevant to any part of this article.
Predictors of KS4 Attainment
Looking first at some of the missing data, it is clear that any data missing on pupil characteristics are linked to poorer attainment outcomes (Table 1). This is true for any year, and the link is strongest when pupils are in Year 10 (2014). The “effect” sizes, especially for FSM and SEN, are large. In fact, they are among the largest found in the data. There are several possible reasons for this. It is partly that NPD returns are sometimes less complete in special schools. But the gaps remain even if only mainstream schools are included in the analysis (pupils missing FSM data attain 204.21 KS4 points on average, for example). It is partly about moving to a new school. But the gap remains even if those listed as moving to their KS4 school in the last 2 years are ignored. Pupils missing data may be from particular ethnic groups such as Travellers (not disaggregated in this data set). They may be recent immigrants or refugees without relevant documentation. However, even combined, these explanations are not sufficient for the scale of the difference. Pupils’ missing data represent a kind of disadvantage (Gorard, 2012). Ignoring them or making them invisible through imputation or similar is both invalid and unfair. Missing data are used as an extra category for each relevant variable in the regression model that follows.
Comparison of Means for Missing Data, Year 10.
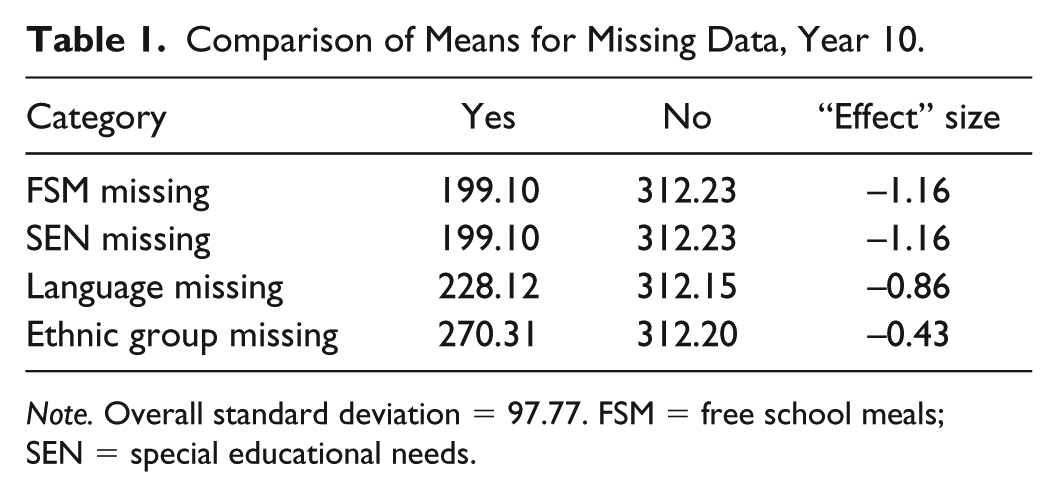
Note. Overall standard deviation = 97.77. FSM = free school meals; SEN = special educational needs.
Looking at the known background characteristics of pupils, only having a statement of SEN yields an “effect” size at least as great as for missing data (Table 2). It is interesting that the differences between those with and without a statement of SEN remain relatively constant over the entire school career and are the same in Year 11 as in Year 1. The same is true of SEN without a statement, eligibility for FSM, and ethnic group. Unsurprisingly, pupils identified as having SEN or eligible for FSM have considerably lower scores than their peers, on average. In general, ethnic minority groups have slightly higher attainment than White U.K. pupils, although Black pupils have very similar attainment to White U.K. pupils.
Comparison of Means for Background Characteristics.
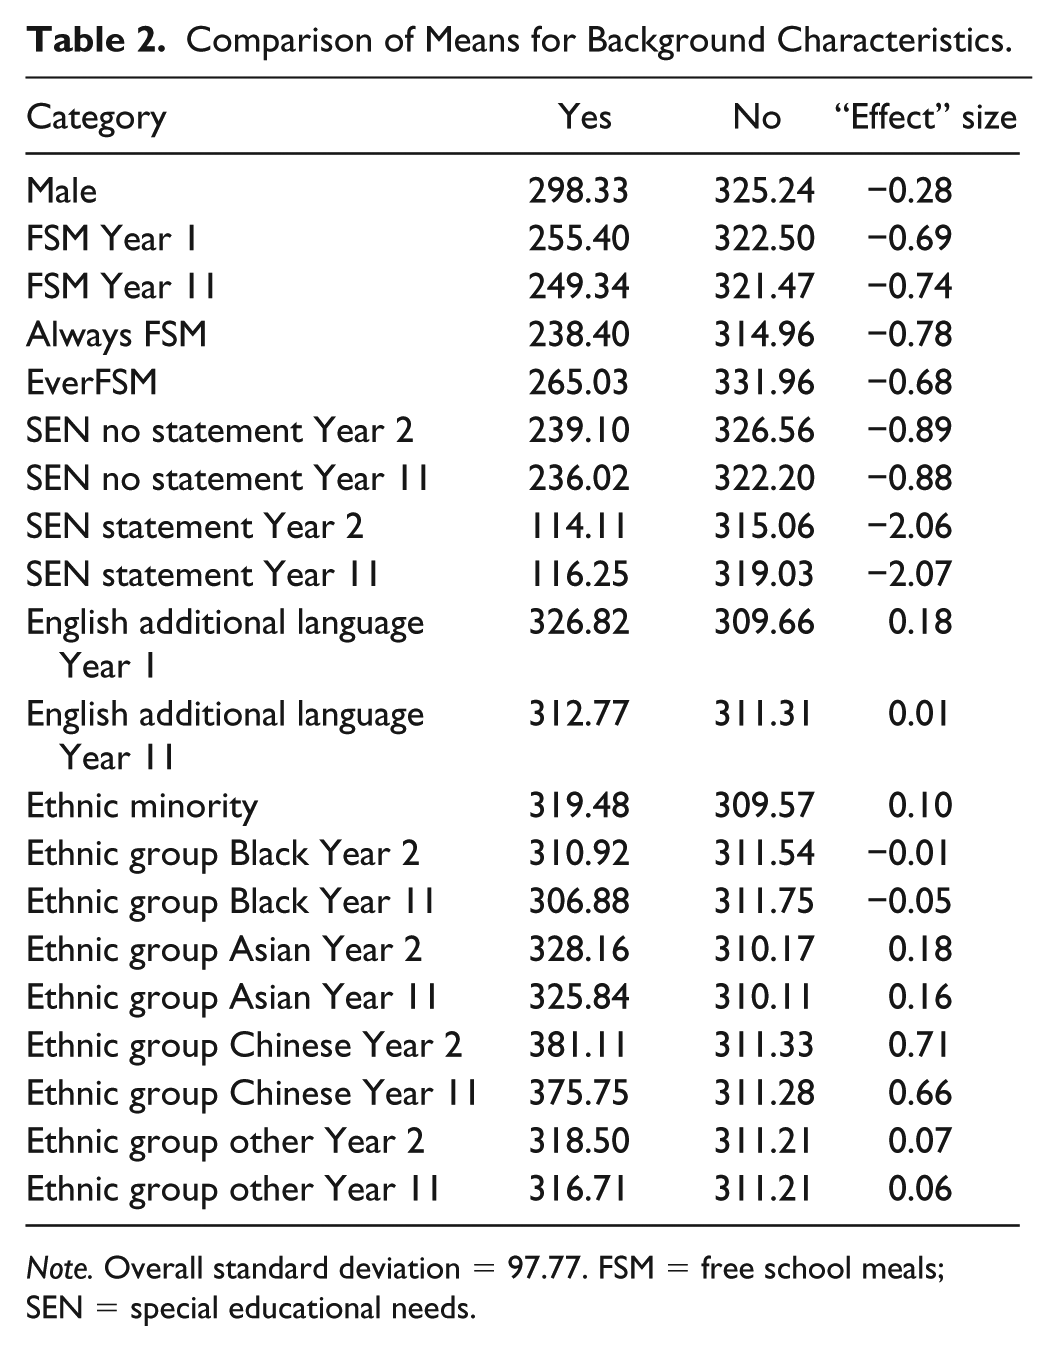
Note. Overall standard deviation = 97.77. FSM = free school meals; SEN = special educational needs.
The “effect” sizes for always being FSM-eligible and being eligible for at least one school year are similar, and for being FSM-eligible in any 1 year. EverFSM is a better predictor of attainment than EverFSM6 (whether eligible in the past 6 years). Males have worse school outcomes than females, on average. Unlike ethnicity or SEN, not having English as the first language at home is not linked to lower attainment. At the outset, it is linked to slightly higher eventual attainment, and eventually, it makes no difference as a predictor at all.
Pupils who are younger in their year tend to have lower attainment, although the correlation is small here (Table 3). Going to school with pupils for whom English is not a first language (EAL) is linked to higher attainment, as is going to a larger school (but only in the secondary phase). Otherwise, summaries of the characteristics of pupils in school are linked to lower attainment. Attending a school with more SEN or FSM pupils, and where these pupils have been so labeled long term or always, is linked to markedly lower attainment. The pattern for how long other pupils in a school have been listed as SEN (of any kind) is substantial. Whether this represents the basis for a school composition effect is explored later. In general, figures for segregation such as for FSM-eligible pupils are better predictors of individual attainment than how many FSM-eligible pupils there are in a school.
Correlations Between Individual and School-Level Characteristics, and KS4 Attainment.

Note. KS = Key Stage; EAL = English as an additional language; SEN = special educational needs; FSM = free school meals.
Some reasonably large correlation “effect” sizes also appear for prior attainment (Table 4). The total or average KS points are always much better predictors than the individual subject scores (such as for English or maths). The “effect” sizes grow with each KS, as the pupils approach KS4. They also grow for the average school points per pupil, used to adjust for individual measurement error (see above).
Correlations Between Individual and School-Level Prior Attainment, and KS4 Attainment.

Note. KS = Key Stage.
The level of deprivation in the local area of residence (the IDACI) is linked every year to KS4 attainment—the strongest link being a correlation of –.229 for Year 11. Schools in poorer areas have lower average attainment, and to a certain extent so do pupils at this schools, of course. However, other than that, area of residence in relation to school is not correlated highly with KS4 attainment (Table 5). For example, pupils have slightly higher attainment in grammar school areas and slightly lower in the North East of England. Both of these small differences are the bases for current policies on school “improvement,” and so it is important to see whether they are solely due to the nature of local populations. As discussed under missing data, pupils arriving at their school just before KS4 may be somewhat underprepared or otherwise disadvantaged. Crossing a local authority boundary to attend school at primary age is linked to slightly worse subsequent attainment, at primary but not at secondary age.
Comparison of Means for Area of Residence.

Note. Overall standard deviation = 97.77. NE = North East.
There are some large “effect” sizes linked to the type of school attended for KS (Table 6). The most obvious relate to special and grammar schools. Special schools are reserved for pupils with SEN and other learning challenges. Grammar schools are reserved for pupils who pass a set of tests at age 10 to 11 (the 11+) and who are among the highest attaining at that age. It is no surprise that either have very different outcomes to the average. The key question is what happens to these and other differences between school types once their pupil intakes are controlled for.
Comparison of Means for Type of School.

Note. Overall standard deviation = 97.77. UTC = University Technical College.
Regression Findings
Some of the patterns described so far could be due to differences in school intakes and between areas or to some variables acting as proxies for others. To understand the complex interrelationships better, they are all entered into a regression model in life order.
The multiple correlation between predictor variables and KS4 outcomes grows with every year at school, from .546 at the start of primary school to .900 at the end of KS4 itself (Table 7). The first value is remarkable because this step in the model involves no direct measure of prior aptitude or attainment and is only about the personal characteristics or status of each pupil (and where these are missing). The full list of these characteristics is shown in Table 8. The same background characteristics, but updated, also add to R for each year at school, but never by as much as for Year 1. The derived school-level background variables tend to add a little more to R in each year, but have a negligible correlation once individual data are known. There is a larger increase in R whenever prior attainment scores, such as those at KS1, are added, but less so with each stage (presumably because at least some of what is being measured is relatively stable). Again, the school-level attainment variables tend to add a little more to R in each year, but have a negligible correlation once individual attainment data are known. There is no evidence that the type of school attended is linked to attainment, once fuller pupil biographies have been taken into account. The majority of variation in outcomes that can be explained, has been explained by the final step. There is very little left for regional or even individual school “effects.”
R Value for Each Step of the Model.

Note. KS = Key Stage.
Standardized Regression Coefficients, Years 1 to 6.
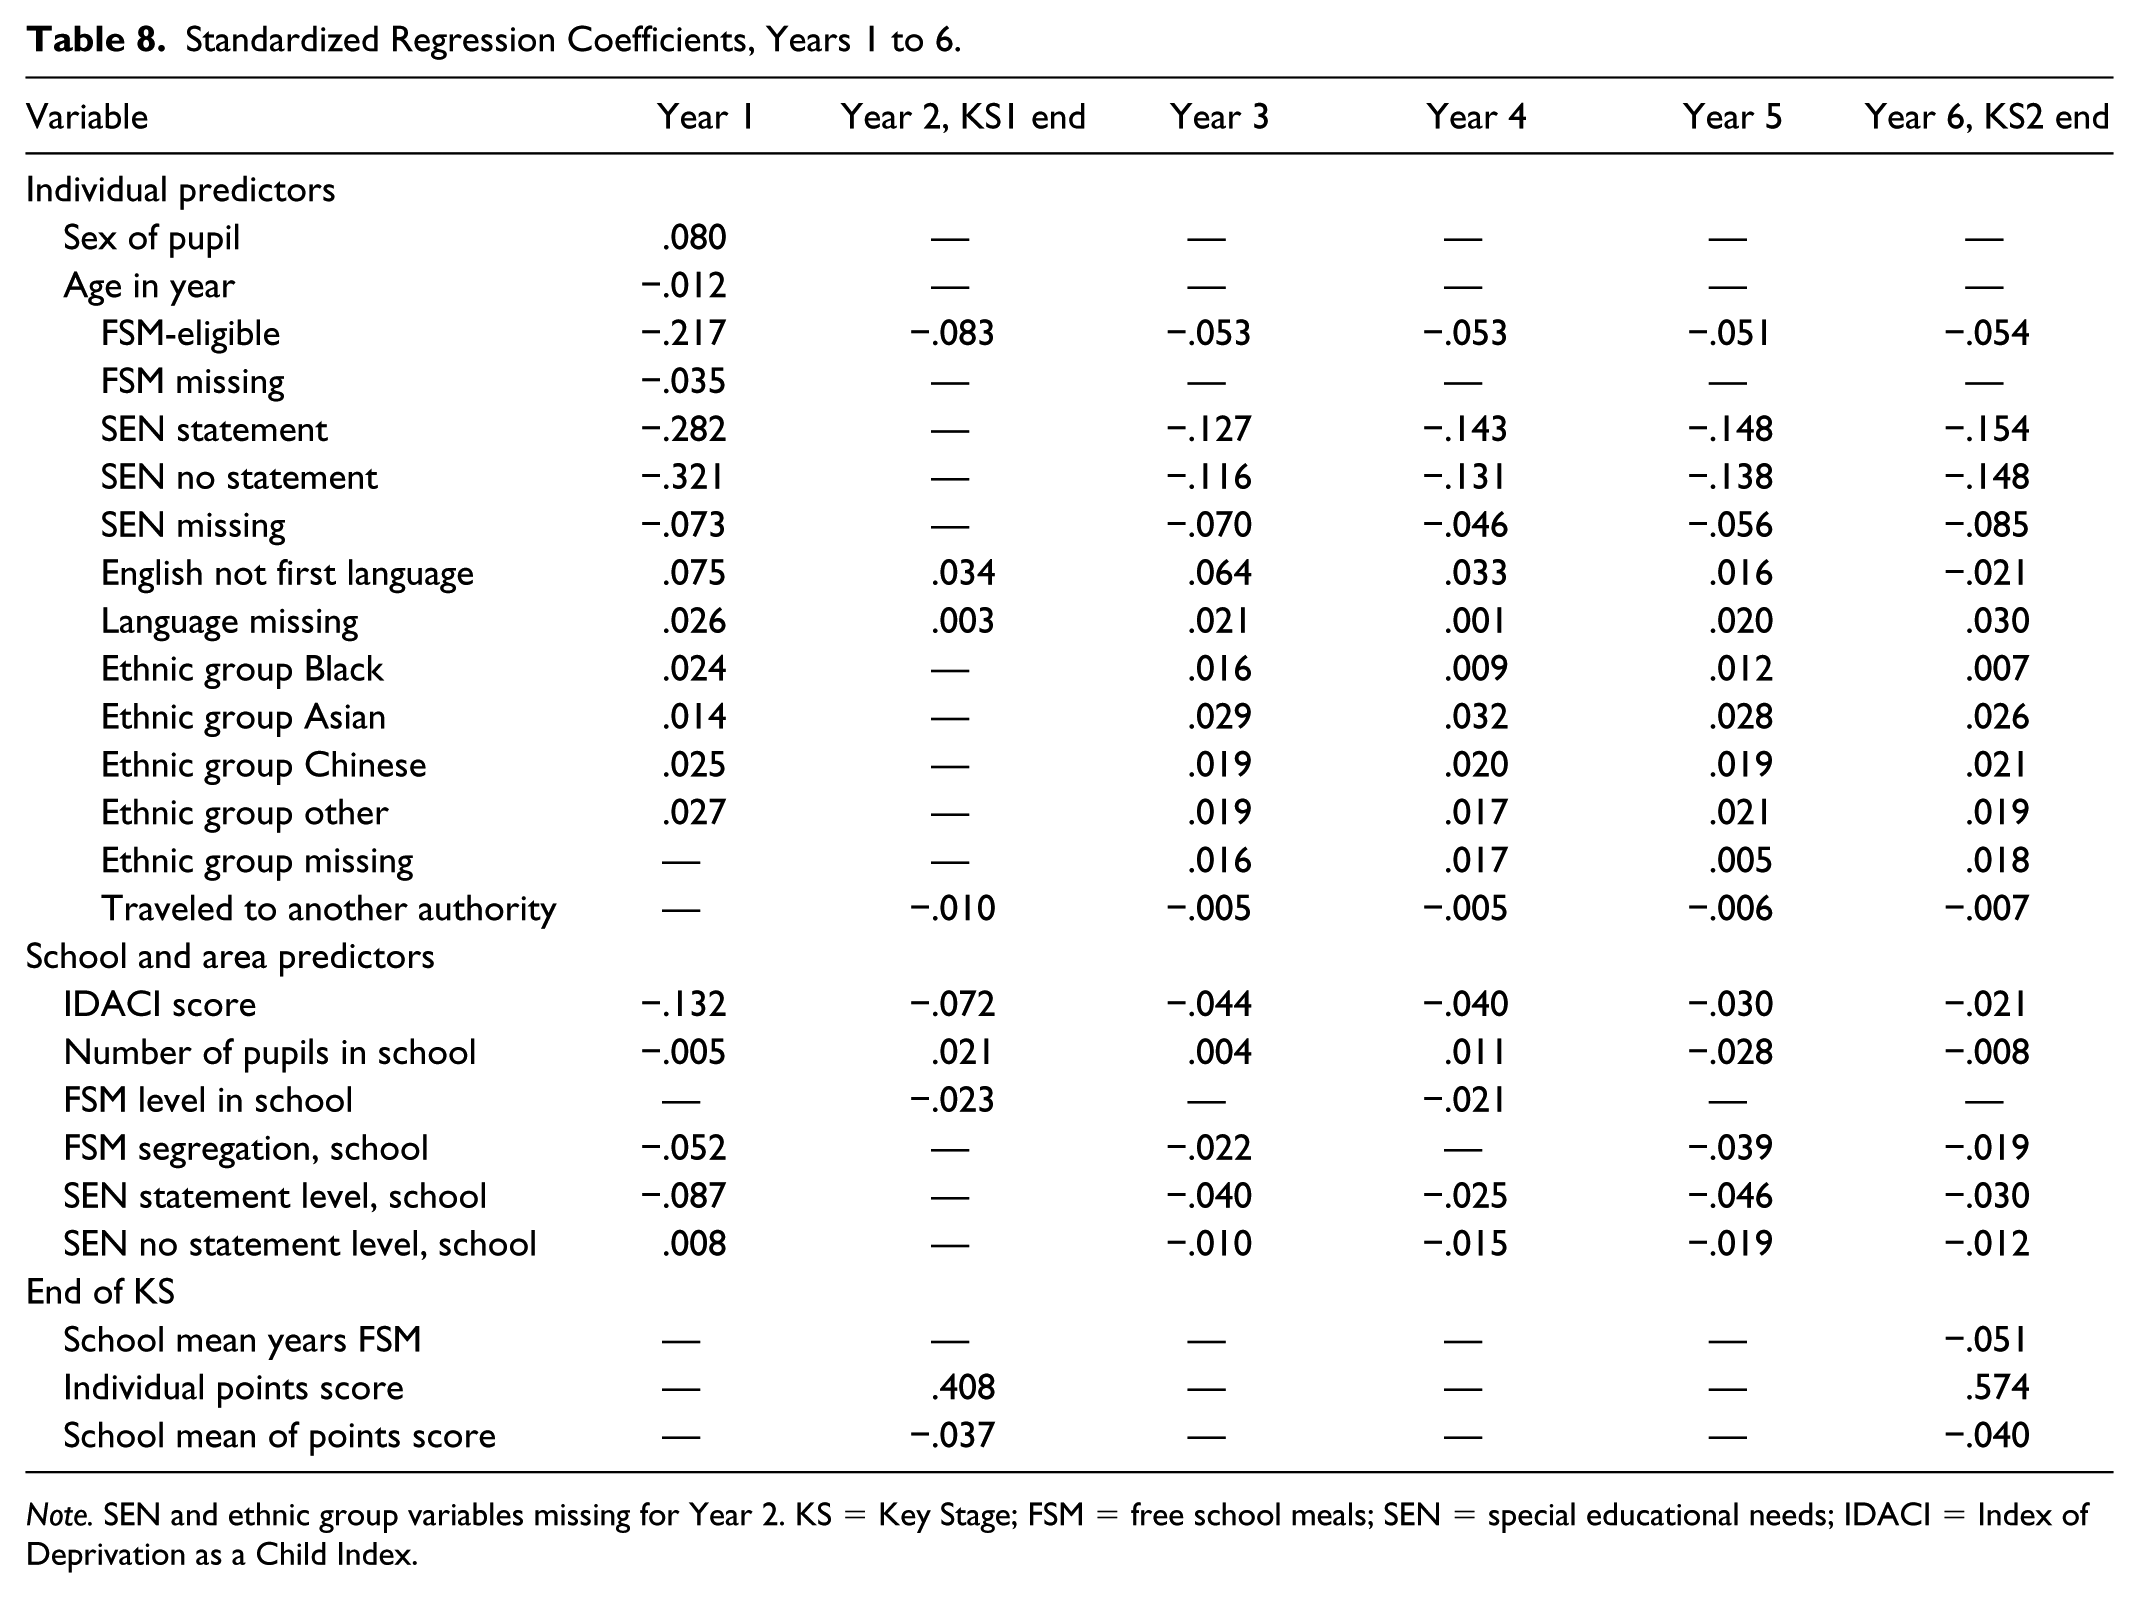
Note. SEN and ethnic group variables missing for Year 2. KS = Key Stage; FSM = free school meals; SEN = special educational needs; IDACI = Index of Deprivation as a Child Index.
At the outset of schooling, females are predicted to attain about 16 more KS4 points than males, on average. For the age in year, the youngest pupils in any cohort will attain about 13% of a standard deviation (or just over three KS4 points) lower than the oldest pupils, on average (Table 8). When a young child starts school, the clearest predictors of their eventual KS4 results are FSM and SEN status. Little that is done then or later changes this fact. Poorer children can expect to attain 57 fewer KS4 points than their peers. And those with a statement of special need at the outset can expect 210 fewer points, on average. In 2015, the average KS4 points score for all pupils was 311, and the standard deviation was 98. A difference of 210 points is completely life-changing.
In general, younger, poorer, male, FSM-eligible (or missing FSM data), SEN, and White pupils (or with missing ethnicity) were predicted lower KS4 scores from their first year at school onward, when all other variables are held constant. All other groups had better average attainment outcomes, including all recorded ethnic minorities and those not known to have English as a first language. None of these categories is perfect either in theory or in the allocation of cases, and there may be pupils with poor English, or who are younger in their year, misclassified by their schools as having SEN, and so on. But the model suggests that poverty and learning challenges are key determinants and need to be emphasized more in policy, practice, and school “performance” measures (Gorard, 2018).
Table 8 (Year 1) also shows that the recorded percentage of FSM-eligible pupils in each school is not needed as a predictor in addition to the segregation residual for FSM-eligible pupils. The latter is generally a better predictor, showing by how much any school has more or less than their fair share of FSM-eligible pupils. As noted above, although the increase in R is small, pupil’s attainment is generally slightly worse in schools that take more than their fair share of FSM-eligible pupils. It is also slightly worse, on average, in larger schools at this primary stage and in those with high levels of SEN pupils. This is likely to be linked to the existence of special schools in some areas and to differences in the levels of challenges faced by pupils with statements (a point returned to later).
In Year 2, too many background variables are missing for the results to be clear. The correlation between end of KS1 attainment and KS4 points is the largest of all single predictors so far. However, on average, pupils do less well than other variables would suggest when they are in schools with higher KS1 points and less well in schools with a higher proportion of poorer children.
By Year 3, whether a pupil is missing a value for FSM eligibility no longer helps to predict KS4 attainment, but missing SEN data still do. The picture for missing SEN from Year 1 to Year 11 is relatively simple. The coefficients for missing any of these data are always negative, and they do not decline over time as might be expected. There are more missing values in Year 1 than Year 11, and once the status has been used as a predictor in 2005, one would expect the link to attainment to reduce over time. Where they appear, the missing FSM and SEN categories appear to be picking up an extra form of deprivation—those not even known to be disadvantaged. The coefficients for missing first language or ethnic group data are more generally positive for each year, smaller than for FSM and SEN, and show some signs of declining over time—from .075 for first language in Year 1 to .033 in Year 4, for example.
The same annual predictors with the same general pattern appear for Year 4 at school. Cross-border travel is only slightly negatively related to eventual attainment. FSM-eligible and SEN pupils are predicted to have lower KS4 attainment, and all ethnic minority groups (as recorded here) are still predicted to have slightly higher attainment at this stage. The apparent relevance of current FSM status gets less over time, presumably as it is explicable by the previous year’s status for many pupils, dropping from –.217 in Year 1 to –.008 in Year 11. A coefficient appears for the first time for the absolute level of FSM eligibility at school level, and this replaces the FSM segregation residual. As noted above, both are not needed, and over 11 years, the segregation figure is the best predictor for eight of those years. Whichever variable appears, the message is the same. Pupils in higher FSM schools have slightly lower attainment on average, even after their own FSM status is controlled for.
The coefficients for attending a school in a different local authority to home are always small and are negative up to Year 6. At primary school, EAL pupils are predicted to have higher-than-average eventual attainment. If not speaking English as a first or primary language is a disadvantage at school, it only appears to be a temporary one. However, as schooling continues, the pattern changes. Those still labeled as EAL by secondary school (perhaps not able to master English as well or recent arrivals in England) are predicted to do slightly worse at KS4. The coefficients change from .075 in Year 1 to –.103 in Year 11.
The pattern of annual variables continues in Year 6—the last year at primary school. Pupils labeled as SEN with or without a statement are predicted to have lower attainment, for every year they are in school. The outcomes are more negative for statemented pupils, as might be expected, but both sets of coefficients are substantial. For pupils with statements, the coefficients range from –.282 in Year 1 to –.139 in Year 11. For pupils with SEN but no statement, there is no clear change over time, but a sudden drop in Year 7 when they attend secondary school for the first time (–.148 in Year 6 and –.043 in Year 7). Over and above this, outcomes for pupils in school with high levels of SEN tend to be lower (–.087 in Year 1 to –.021 in Year 11).
As with KS1 attainment, there is a strong correlation between KS2 and KS4 attainment. Again, given other factors, the results in schools with higher KS2 scores and more pupils in long-term poverty tend to be very slightly lower than might be expected otherwise (and vice versa).
The apparent relevance of deprivation linked to current residence (the IDACI score) declines steadily over time from –.132 in Year 1 to –.032 in Year 11. However, there is a jump from the end of primary to the start of secondary schooling. By Year 6, the IDACI coefficient has reduced to –.021, but it rises to –.51 in Year 7 (Table 9). The pattern for the link between attainment and size of school (in terms of pupil numbers) is unclear. It is more often slightly negative at primary school—primary schools can be too small to sustain facilities and staff perhaps. But it is only –.005 in Year 1 and –.008 in Year 6. However, the coefficient changes to .011 in Year 7—still small but suggesting that smaller secondary schools (themselves larger than primary) are linked to marginally better outcomes. But then it drops again to –.006 by Year 11. In summary, size of school is not a key determinant of school outcomes. As shown in each year, the pupil’s ethnic group makes little difference from the outset. The coefficients for ethnic minority groups (as grouped by NPD here) are all small and generally positive. For example, the coefficient for Black pupils is .024 in Year 1 and .023 in Year 11. In Year 8, the coefficient for Black pupils only is slightly negative for the first year.
Standardized Regression Coefficients for Background Variables, Years 7 to 11.
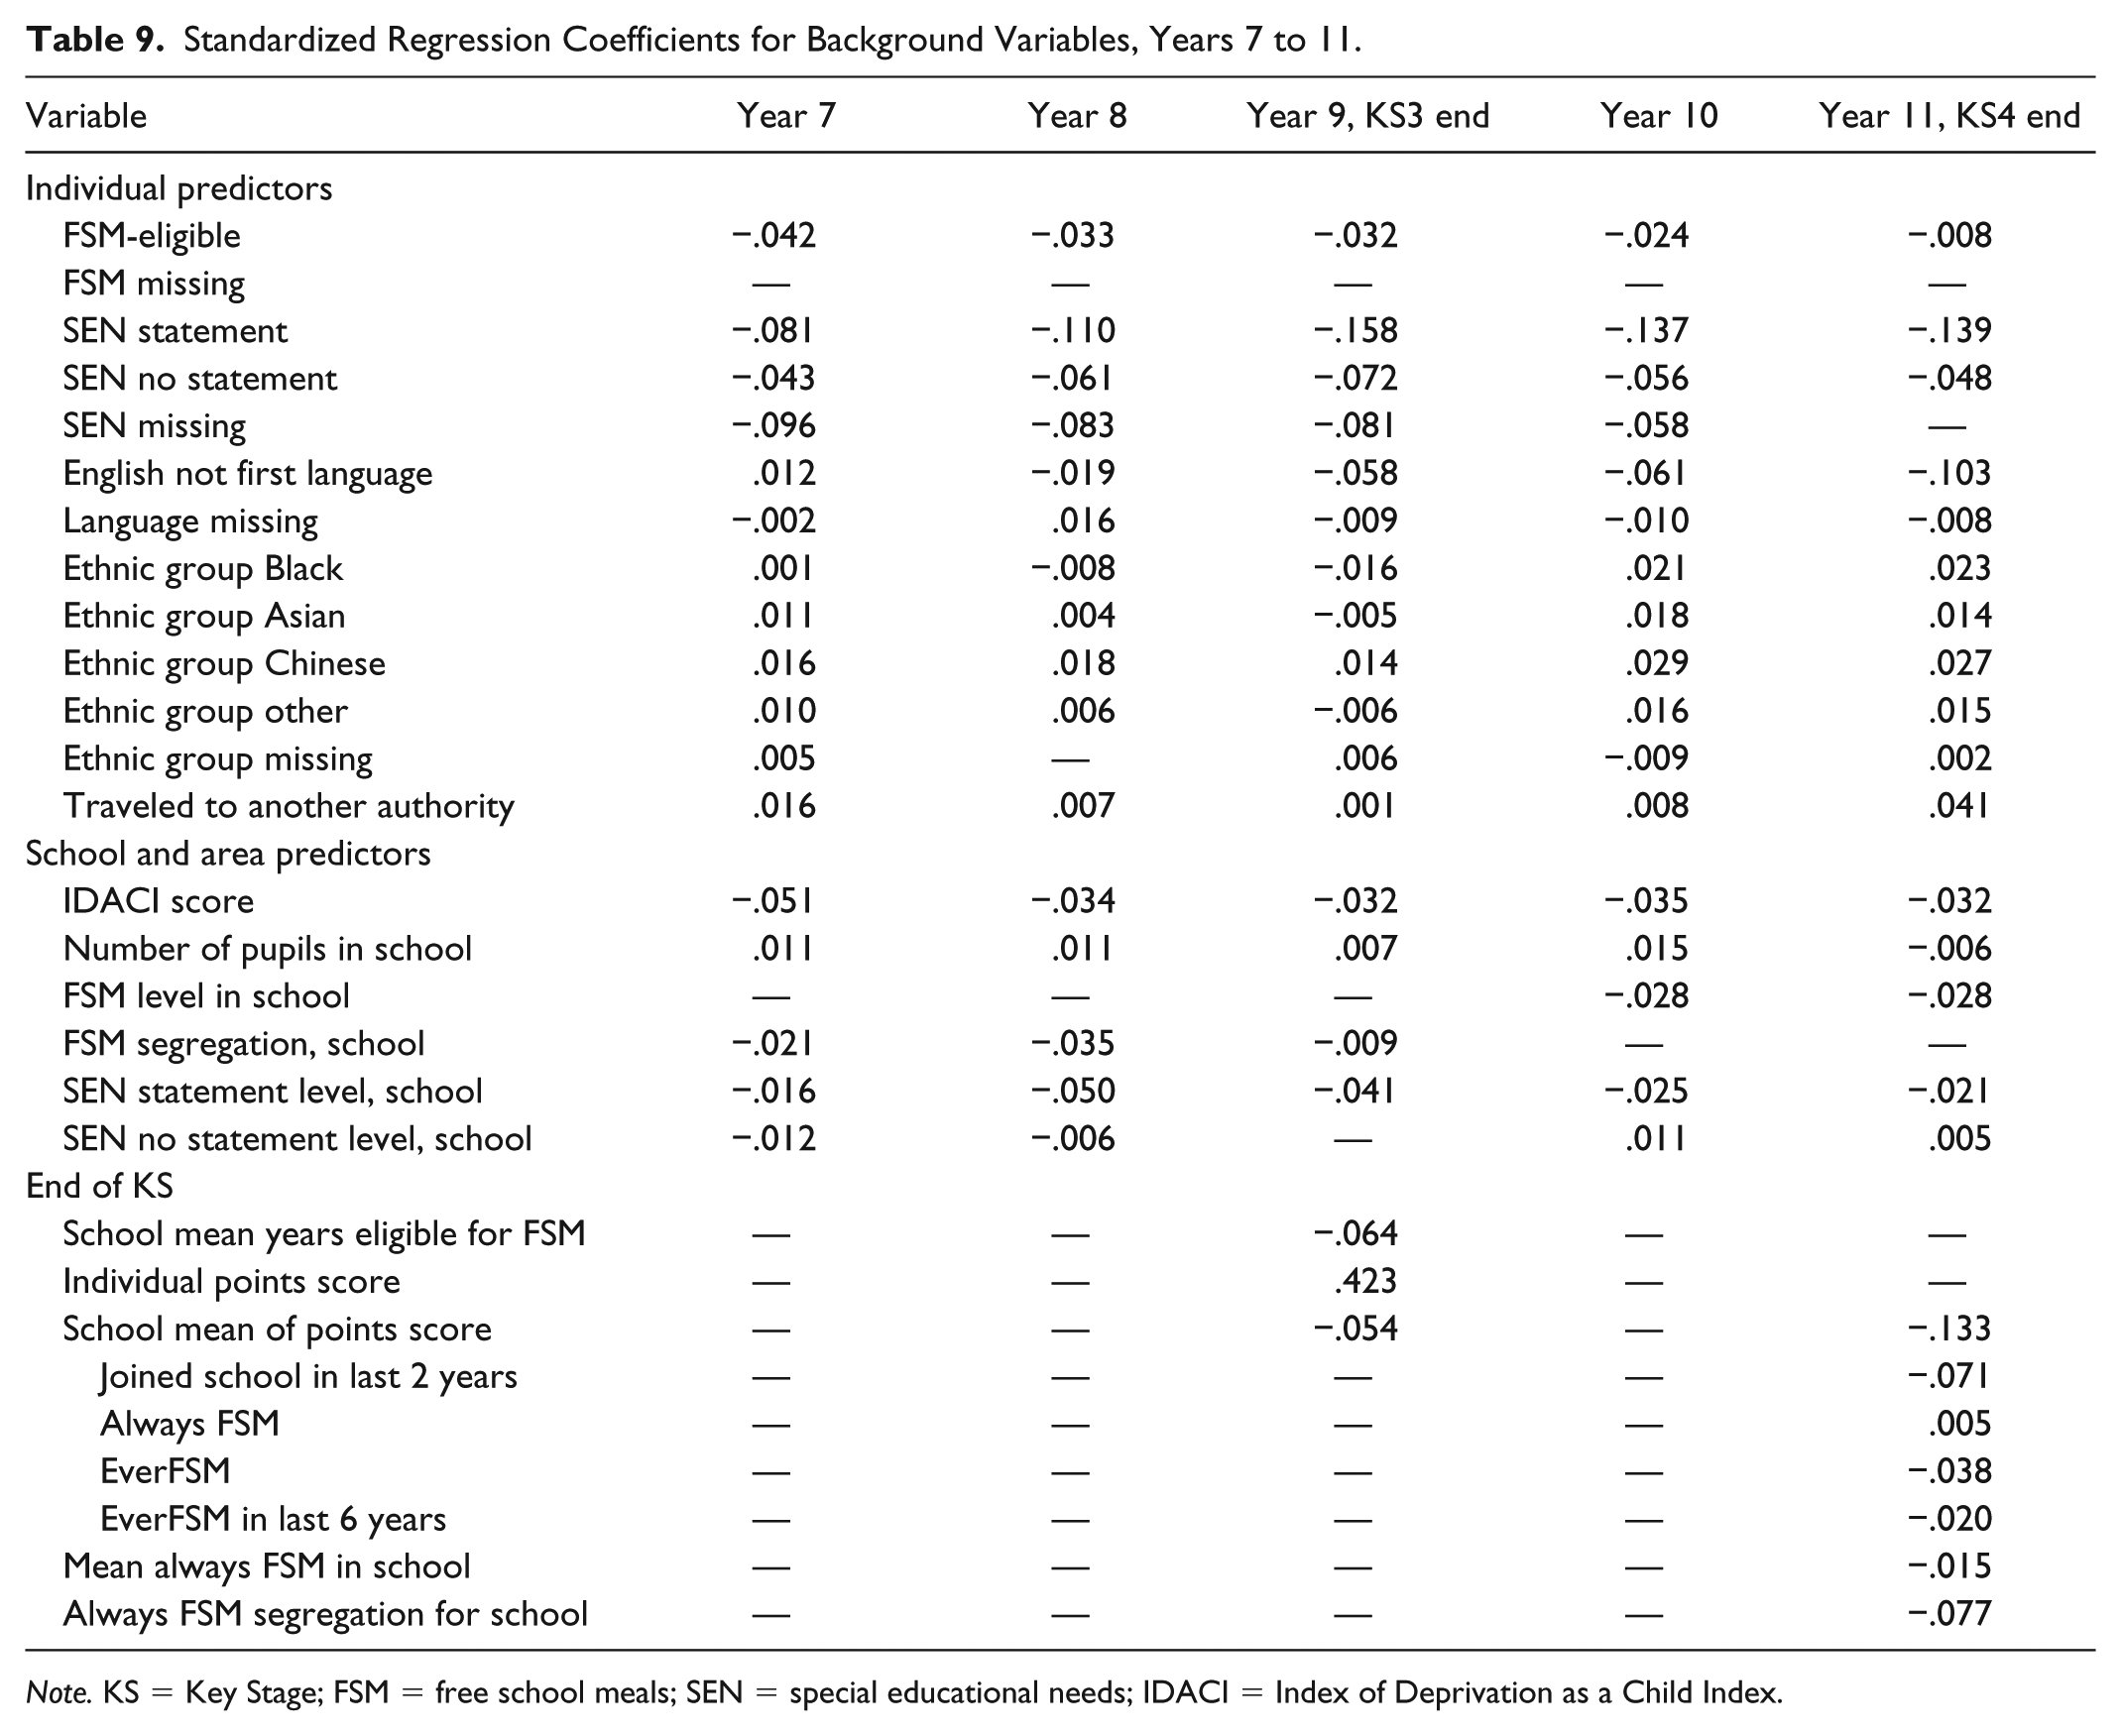
Note. KS = Key Stage; FSM = free school meals; SEN = special educational needs; IDACI = Index of Deprivation as a Child Index.
Going to school in another authority is a negligible factor in each year. There is little or no cross-border traffic in Year 1, but otherwise there is a small negative coefficient throughout primary school. This changes, with a small positive coefficient for the 5 years at secondary school (.008 in Year 10). By the end of KS4, the pattern for most variables is still very similar to that at the outset. All coefficients for ethnic minority groups are small and positive. Being recorded as having SEN is still the best single predictor of KS4 attainment, by a considerable margin.
As with the end of KS2, attending a school with more long-term poor children and lower average attainment is linked to lower attainment at KS3. Individual KS3 attainment is linked to KS4. The link is weaker, perhaps partly because whatever is being measured is partly stable and so already covered by KS2 scores and partly because KS3 is teacher-assessed in a rather different way to the other scores which are meant to be tested and moderated to a national standard. Recent arrivals in the secondary school attended for KS4 tend to have poorer outcomes. This presumably includes pupils arriving from other school systems and countries who may be less prepared for the assessment and pupils from Traveller families and others who may have had a disrupted formal education. The true picture could be worse than this, because the coefficients for missing FSM or SEN data in previous years are always negative, and the missing data can act as a proxy for pupil mobility. The coefficient for the segregation between schools of the long-term poor is negative and relatively large (compared with the usual FSM segregation residual). This again suggests that more attention should be paid in policy and school performance measures to the kinds of poverty in schools, and not just to snapshot variables such as EverFSM6.
There is almost no relationship between the economic region of the school attended for KS4 and pupils’ KS4 outcomes (Table 10). Once other factors are controlled for, there is no evidence here of underachievement in particular regions of England, and there is no North–South divide, only differences in school populations. Any policies based on differences in school quality or effectiveness are therefore misdirected. There is also no difference between school outcomes in areas with selective (grammar) schools and others, confirming that the system of selection leads to no overall benefit for attainment. Policies based on creating more grammar school places to increase attainment more generally are therefore also misdirected. The coefficients for all school types are small and mostly negligible. The most substantial is positive for special schools (.073).
Standardized Regression Coefficients for KS4 Region and School Type.

Note. KS = Key Stage; NE = North East; UTC = University Technical College; VA = voluntary aided; VC = voluntary controlled.
Discussion
Limitations
The model portrayed here is not a definitive test, a causal pathway, or a full explanation of the outcomes. There will still be explanatory variables missing, measured in error, or taking up variation as proxies for others. Changing the specification such as the number of steps or the order of entry of variables can change the decimal places in coefficients.
However, the model is relatively stable under these kinds of changes, including the overall R and the relative importance of types of variables. The same results appear for each cohort for which we have data. The key is not the precise value of coefficients, but the overall substantive picture when possible explanatory variables are entered in life order. If there is a causal pathway, then it must run forward in time (attainment at KS3 cannot sensibly determine whether a pupil is living in poverty at age 7, for example). And where variables have no substantive input to the model, then they may not be causal (but some, such as region of residence or type of school, might appear in cross-sectional analyses as proxies). What are the implications?
Measuring Disadvantage
Our prior work has confirmed that considering long-term indicators of disadvantage, rather than simply flags for current or recent status, leads to better understanding of both disadvantage and its impact on outcomes. So, for example, the number of years a pupil has been known to be eligible for FSM is a better summary variable than either current FSM or EverFSM6. What this new work shows is that examining FSM status in sequence for every year that a child is in the school system is even better than both approaches. Using the flag variable for FSM, a regression model for KS4 outcomes has an R of around .72, and using the number of years eligible for FSM instead, the same model has an R of around .82 (Gorard, 2018). Here, the model using trajectories has an R of .90. There are other changes to the model here, but the biggest difference lies in using FSM and other indicators of disadvantage in this longitudinal way. The duration and precise pattern of childhood disadvantage matter when considering school outcomes, especially for FSM and SEN, more than the flag indicators suggest and more than any other available indicator.
In the full model, the coefficients for ethnic group (major) are small, and removing these flag variables makes very little difference to R in each year. The values for each ethnic minority are always small and almost always positive. In terms of attainment and progress at school, ethnic minority status as measured here is not a key determinant. There are raw-score ethnic attainment gaps, but they may be a proxy for other determinants such as SES and first language, plus temporary unfamiliarity with the system for any new arrivals in England. The DfE (2017) also concluded that differences between ethnic groups were almost entirely linked to family income. Disaggregating Asian pupils or Black Caribbean and Black African pupils might alter this picture. But no equivalent longitudinal analysis of a full age cohort has been done with these more detailed categories. For the present, we must assume that average attainment and school progress are the same for pupils who differ only in terms of their ethnicity.
Having a first language other than English is similarly no long-term barrier to progress. In general, EAL pupils in Year 1 are predicted to obtain slightly higher KS4 scores than their peers. The problem, if there is one, may be short term, which is why pupils (still) labeled EAL in Year 11 appear to do slightly worse than their peers.
Missing Data
The coefficients for missing disadvantage data are larger than for ethnic groups. In Year 1, the largest coefficient for ethnic group was .027 for “Other,” whereas missing FSM data had a coefficient of –.035 and SEN missing had a coefficient of –.073. Neither is large, and the coefficient for missing FSM data reduces with each year, partly as the amount of missing data declines. The coefficient for missing SEN data grows in the primary years and is always an issue. Missing data are partly a result of simple mobility. Pupils arriving from other home countries or from outside the United Kingdom will not have data for earlier years at school. The same applies to pupils transferring from private schools in England. There is no reason to assume that any of these groups are disproportionately disadvantaged. They may have to adjust to a new curriculum, but the model outcome is 11 years after the coefficients from Year 1, and differences in curriculum are unlikely to have such a long-term impact. Some groups such as Travellers (not disaggregated as an ethnic minority in this data) may move schools regularly, and for them missing data could represent the official statistics still catching up with the changes. For Year 11 only, moving between schools is associated, on average, with a small penalty in terms of KS4 outcomes. Some groups may be refugees who do not have the necessary documentation to be known to be eligible for free school meals. Again, these would tend to be at least temporarily disadvantaged. Where young children have a learning challenge or disability that has been undiagnosed so far, meaning that assistance is not made available, this could reduce their chances of progress in the early years, and so of higher attainment at KS4.
Missing ethnicity or first language data in the early years is not linked to lower outcomes, presumably because neither factor is key to attainment, and so unidentified EAL, for example, is not linked to lower progress once all other factors are taken into account. Nevertheless, missing data matter, and for FSM and SEN, it is a serious concern. There would be a danger in using missing data routinely in predictive performance models, that it would encourage games-playing by schools or individuals (Gorard et al., 2019). However, it ought to be taken into account more in researching school intakes and contexts (Gorard, 2012).
School Composition Effects
The model presented here is not able to decide definitively whether there is a peer effect at school level. The model does clarify that the FSM segregation residual for each school is a better predictor of outcomes than the simple percentage of FSM-eligible pupils. Segregation here is the distance from a fair or evenly distributed school intake, assessed by the GS index (Gorard et al., 2003). As with longitudinal measures of disadvantage, it would be better for future consideration of school intakes to use the segregation residual rather than the simple proportion of FSM-eligible pupils, for example. However, the total R increase due to school (and area) factors in each year is small and almost negligible in comparison with individual measures.
Whether school composition is a phantom or not, the school-level variables tell a consistent story across the duration of schooling. Pupils do worse in schools with clusters of disadvantage or clusters of prior attainment. Put another way, if this composition is real, then schools should be as mixed as possible both socially and academically. This could lead to improved outcomes of between 0.05 and 0.15 of a standard deviation for almost no cost. No new schools need to be built, no new teachers employed, no new buildings or resources provided—just a more even spread of pupil intakes than currently by changing the school allocation process over a number of years. And even if it makes little or no difference in practice, it may have other benefits (such as aspiration or civic participation; see above).
Area of Residence
Once pupil intake characteristics and prior attainment are accounted for, there is no evidence here that schools in different economic regions have different outcomes for equivalent pupils. This is important because a lot of current education policy in England is concerned with surface regional differences in attainment and crediting schools for their results, as in the London Challenge, blaming schools for their failure, as in comments to the Select Committee about the North–South divide, or simply where more work is being proposed, such as in supposedly underperforming coastal areas. As with so much in education, policy makers appear to be reacting to raw-score differences linked to differences in regional populations rather than the performance of pupils, schools, and teachers. Poorer areas of England need investment and infrastructure, not better schools in particular. Education is not a cheap solution to economic disadvantage.
There is no benefit for pupils from living in an area that has retained grammar schools and their counterparts—the neighboring or secondary-modern schools that lose the highest scoring pupils. This is not a better system than in other areas and does not lead to greater attainment for equivalent pupils. Again, this has implications for current government policy, which is being so misled by raw-score results.
School Type
There is no substantial school type effect here. Schools are largely defined by who attends them. Once that is accounted for, there is no great difference between the outcomes of any of them (coefficients of .002-.008). Only special schools (coefficient of .073) might offer any advantage to the subset of pupils with greatest need. But even this could be a phantom composition effect and is not stable enough to base policy on. For example, it is not an argument against the inclusion of SEN pupils in mainstream settings for other reasons. Every new administration in England seems to want to create a new type of school for only some pupils or some parts of the country. Recently, it has been Academies, Free schools, Studios and University Technical Colleges (UTCs), and faith-based and selective schools. None of these have better results than community, comprehensive schools, and some cost a great deal more.
Overall, the findings mean that when policy makers, advocates of the success of the London Challenge, the inspection regime Ofsted, awards committees, and others use the Pupil Premium gap as a measure of success, they are being very unfair. There is a problem for all such Pupil Premium attainment gap calculations caused by missing data and because they take no account of the proportion of local residents using private schools (both influencing the calculation by their absence). They are also unfair because they do not take account of the threshold nature of FSM eligibility. They are ignoring the variation within that category stratified by prior educational challenges like SEN. Almost as importantly, our prior analysis shows that different areas have different proportions of types of FSM pupils, such as the long-term poor. Heavily disadvantaged areas are likely to have more of the always FSM-eligible pupils, and this makes any comparison with other areas based on the Pupil Premium gap intrinsically invalid (Gorard, 2018). This is in no way an argument against the Pupil Premium policy itself, but it does suggest that the impact of the policy needs a rather more robust evaluation than simply measuring changes in the Pupil Premium attainment gap.
School Performance Measures
It is well established that having more information and more accurate measures is linked to smaller estimates of apparent school “effects.” What this article now shows is that using the information we already have but in a more realistic lifelike way has the same impact as having more information. Methods of trying to encapsulate school performance, such as Progress 8 in England, need to take note.
Footnotes
Declaration of Conflicting Interests
The author(s) declared no potential conflicts of interest with respect to the research, authorship, and/or publication of this article.
Funding
The author(s) disclosed receipt of the following financial support for the research, authorship, and/or publication of this article: This research was funded by the Economic and Research Council - grant number ES/N012046/1.
Author Biographies
![]() . He investigates effectiveness and fairness in education systems, publishes widely, and regularly gives advice to governments and funding organisations.
. He investigates effectiveness and fairness in education systems, publishes widely, and regularly gives advice to governments and funding organisations.