
Abstract
This article explores the financial accounts of the United States to analyze the synchronicity in bank and nonbank credit flows with the fund flow patterns of U.S. nonfinancial corporate and noncorporate sector. We differ from prior studies and examine the long-term behavior from 1952 to 2015 in relation to peaks and troughs in business cycle, sector-specific factors, and macroeconomic variations. We find that the nonbank credit flows have evolved as a significant source of credit for corporate and noncorporate sector and exhibit higher levels of synchronicity during the period after 1980. The high synchronicity of nonbank credit flows necessitates sufficient resilience in the business cycle upsurge through countercyclical actions, specifically in the noncorporate sector. Multivariate regression results reveal that noncorporate sector relies more on nonbank credit for short-term cash and working capital requirements, whereas corporate sector opts nonbank credit for long-term investments. We also find evidence of relatively higher inter-sectoral impact of business cycle shocks between corporate and noncorporate sector from 1980 to 2015.
Keywords
Introduction
The U.S. financial crisis of 2007-2009 and the European financial crisis of 2007 are underpinned by a lack of understanding of the financial system and its linkage with the broader economy (Veron, 2013). This has raised alarms across all the sectors of the global economy, which is evident through wide-ranging reforms in financial and nonfinancial sectors. Due to innovations in business models and stronger regulations, there has been a shift from traditional bank borrowings to nonbank credit leading to a significant and larger role for nonbank financial intermediaries, especially in the United States. 1 The focus of the present study is to explore empirically at the aggregate level, the changing aspects of bank and nonbank credit flows and a comparison of its synchronicity with the usage of funds by the U.S. noncorporate and corporate business sectors as separate entities. The distinction between bank and nonbank credit becomes important because nonbank credit is evolving globally as an economically significant financing source. Moreover, nonbank credit exhibits a substantially different character than bank credit. Our analysis is centered on certain key issues. First, we evaluate how the aggregate sources and uses of funds of the U.S. corporate and noncorporate business—measured in terms of leverage, capital expenditure, and liquidity holdings—have changed over the past 70 years, through an examination of the trends across the two sectors. Second, we make an effort to understand whether financial shocks from the corporate businesses act as mechanisms inducing or amplifying fund flow patterns in the noncorporate sector.
The macroeconomic impact of bank and nonbank credit flows across the U.S. economy exhibited different dynamics all through the business cycle (Herman, Igan, & Solé, 2015). Furthermore, there remains an unanswered question whether or not nonbank credit will be stable through credit cycles if there no option of credit and liquidity puts. In the absence of such puts, the challenge turns toward extending controls and restrictions to nonbank credit (Pozsar, Adrian, Ashcraft, & Boesky, 2010). The increasing significance of nonbank credit implies that nonfinancial businesses have to adapt continuously to changes in the business cycle. Furthermore, variations in the cyclical behavior warrant improved sector-specific macro prudential policy measures to increase resilience to withstand susceptibilities. For this, an in-depth understanding of the evolution of bank and nonbank credit patterns of the nonfinancial businesses and their immediate and long-term impact on sector-specific fund flow patterns is essential.
Primarily, businesses borrow to maintain short-term liquidity and fund long-term growth opportunities besides other requirements such as retirement of debt, equity buy-backs and the like. Theoretically, nonbank credit can either reduce or intensify the positions of liquidity and growth related investments of the nonfinancial businesses. On one hand, nonbanks may increase their lending and offer funds at a lower cost than banks, which increases the availability of funds. On the other hand, if nonbanks are subject to stringent regulations based on their risk appetite, it may dampen the nonfinancial business activity. Furthermore, increased synchronization in business models of banks and nonbanks intensifies the transmission mechanism in nonfinancial businesses. In addition, macroeconomic factors such as interest rates, default risk, and monetary policy also contribute to the intensity. Although, the synchronicity between the level of bank and nonbank credit and nonfinancial businesses is of key policy relevance, academic literature on this topic is scant.
Among nonfinancial businesses, the corporate sector is subject to a variety of mandatory disclosures and reporting standards that warrant transparency in the transactions entered into by these businesses in the raising and usage of funds. Several notable firm-level studies have well documented the determinants of the corporate sector borrowings, liquidity, and investment decisions (Bates, Kahle, & Stulz, 2009; Baum et al., 2004; Graham, Leary, & Roberts, 2015; Opler, Pinkowitz, Stulz, & Williamson, 1999). However, noncorporate businesses, which are neither under the purview of stringent regulations nor are relatively large sized as compared with corporate businesses, have not been focused with respect to their fund flows. Even in aggregate level studies where noncorporate sector is included, the sector has been considered as part of the nonfinancial sector as a single entity and hence deeper insights are not available.
The present study contributes to the literature by answering the following questions:
The analysis is performed using aggregate quarterly and annual data from the Financial Accounts of the United States published by the Federal Reserve System over the period from 1952 Quarter 1 (Q1) to 2015 Quarter 4 (Q4). The choice of the sample period and quarterly frequency allows us to capture significant events in the U.S. economy over 250 quarters, covering a wide span of leading, lagging, and coinciding business cycle indicators. Furthermore, conducting such analysis in a reasonably longer horizon enables us to establish model efficiency and overcome shortcomings of a small sample.
The main finding is the increasing significance of nonbank credit in strengthening the liquidity of nonfinancial corporate and noncorporate businesses. However, the evolution of bank and nonbank credit flows has been very different across the two sectors. Although bank credit to corporate business is consistent and stays at the same level, there is a secular upsurge in nonbank borrowings of corporate business since the 1980s (Figure 1 Panel A). With respect to noncorporate sector, there is a substantial secular uptrend in both bank and nonbank credit since 1970s (Figure 1 Panel B). The high synchronicity of nonbank credit flows necessitates sufficient resilience in the business cycle upsurge through countercyclical actions, specifically in the noncorporate sector.

Bank and nonbank real credit flows to U.S. corporate sector (Panel A) and noncorporate sector (Panel B).
Our findings yield two important contributions. First, from a policy standpoint, we analyze how credit flows and fund flows co-move through the business cycle, to facilitate framing of appropriate macroeconomic policies that balance growth and stability objectives. Second, from an aggregate investigation perspective, we make use of the relatively underutilized potential of the “Financial Accounts” of the Federal Reserve to conduct macro-financial stability assessment of credit flows to nonfinancial businesses.
The rest of the article is organized as follows: The section “Data and Method” provides the details of construction of bank and nonbank credit database of the corporate and noncorporate businesses from the Financial Accounts of the United States and the method. The section “Results” discusses the results, and section “Conclusion and Policy Implications” provides the conclusion and implications of the study.
Data and Method
Data
The Financial Accounts offer an all-inclusive summary of credit flows in the United States. The Z.1 statistical releases cover balance sheet data on 25 sectors of the economy (e.g., nonfinancial corporate sector, households, money market mutual funds) and on the flows of the assets and liabilities, fragmented into 22 financial instruments (e.g., corporate bonds, trade credit, municipal securities, total mortgages). The data are available on both yearly and quarterly frequency from the year 1945 and 1952 Q1, respectively.
For the present study, we extract information on financial linkages across banking and nonbanking instruments for the nonfinancial corporate and noncorporate sectors for the period from 1952 Q1 to 2015 Q4. These linkages are established by the borrowings through different financial instruments offered by banking and nonbanking institutions. Table 1 provides the details of equity and debt instruments and the list of banking and nonbanking institutions as per the “Financial Accounts.”
Instruments and Institutions in the “Financial Accounts.”

To get a measure of the financial interconnections, we obtain the list of liabilities (i.e., debt instruments) from the balance sheets of nonfinancial corporate sector (Table B. 103) and nonfinancial noncorporate sector (Table B. 104). Similar to Herman et al. (2015), we focus on the debt instruments because of the obligation to pay interest and thus are more likely to transmit and amplify shocks all over the sector. We adapt Herman et al. (2015) in estimating the gross direct exposure of whom-to-whom lending details of each sector’s liability of a particular instrument. 2
Bank credit of corporate sector includes credit flows through commercial paper, corporate bonds, depository loans, miscellaneous liabilities, municipal securities, other loans, and total mortgages. Nonbank credit of corporate sector includes credit flows through trade credit, commercial paper, corporate bonds, miscellaneous liabilities, municipal securities, other loans, and total mortgages. Bank credit of noncorporate sector includes credit flows through depository loans, miscellaneous liabilities, other loans, and total mortgages. Nonbank credit of noncorporate sector includes credit flows through trade credit, miscellaneous liabilities, other loans, and total mortgages. All the variables are quarterly real values adjusted based on CPI 2015.
Method
Bank versus nonbank credit
An important contribution of this study is a novel multivariate regression framework that allows us to nest bank and nonbank credit flows with the same set of determinants in a single model. The multivariate regression method is applied when it is appropriate to fit two or more outcome variables with the same set of independent variables. The multivariate regression analysis to examine the split of outside borrowings between bank and nonbank sources is built on the rationale that outside financing must cover the demand for funds for investments (capital expenditure) and liquidity management (meeting working capital needs and maintaining cash equivalents).
The first pair of multivariate regression focuses on the split of outside financing of corporate sector between bank and nonbank credit as follows:

The second pair of multivariate regression focuses on the split of outside financing of noncorporate sector between bank and nonbank credit as follows:

In economic terms, the slopes in Equations 1 and 2 for capital expenditure (corp capex, noncorp capex), working capital (corp nwc, noncorp nwc), and cash equivalents (corp cash, noncorp cash) in the two regressions provide estimates of how required financing due to variations in these variables splits between bank and nonbank credit of the corporate and noncorporate sectors, respectively.
Synchronicity of credit flows and fund flows
Analyzing the patterns of co-movements between credit flows and fund flows through the business cycle is essential to design and implement appropriate macro prudential policies that fulfill economic growth and financial stability objectives. We adapt the algorithm of Harding and Pagan (2002) following Bry and Boschan (1971) that identifies the turning points as peaks and troughs in a time series. The logic followed in the algorithm is in identifying a sequence of local minima and maxima that permits fragmenting the series based on expansions and contractions. In line with the original algorithm of Harding and Pagan (2002), in the present study, we set a criterion specifying the phases to last at least two quarters and complete cycles to last at least five quarters.
The algorithm is repeated to generate the peaks and troughs in each variable pertaining to bank and nonbank credit, cash equivalents, net working capital, noncash net working capital, leverage and capital expenditure of the corporate and noncorporate sectors separately. The synchronicity ratio between credit flows and fund flows is measured based on the frequency of co-movements of the two series in the same phase.
Results
Trends in Corporate and Noncorporate Sector
We start with a preliminary trend analysis of the fund flows across the corporate and noncorporate sectors. Recent Federal Reserve flow of funds data release reveal that the share of U.S. nonfarm, nonfinancial noncorporate business contributed a greater part of the U.S. gross domestic product (GDP) in 2015 than in any year since 1970 and the gross value added by noncorporate business to GDP is 18.63%. On the other hand, looking historically, while the ratio of corporate net worth to GDP has been increasing since 1990s and has exceeded the GDP, the ratio of noncorporate net worth to GDP has shown a declining trend from 91.2% in 1950s to 58.72% in 2015 (Figure 2). On the other hand, on examining the leverage, the ratio of U.S. corporate debt to GDP stands at 40% at the end of 2015 Q4, whereas for noncorporate business it has soared to more than 18% from 3% in 1945 (Figure 3).

Net worth to GDP ratio of U.S. corporate and noncorporate sector.

Net debt to GDP ratio of U.S. corporate and noncorporate sector.
We deepen the analysis by looking into the evolution of the ratio of debt to total assets of the two sectors (Figure 4). The main components of debt for both corporate and noncorporate businesses are long-term loans. The dissimilarity between corporates and noncorporates is relatively prominent. A secular uptrend prevails in the noncorporate businesses and the average value of outstanding debt has risen to 18.28% in 2011-2015 from 5.73% in 1945-1950. However, in the recent period since 2010, corporate sector has increased its leverage whereas a downward trend is observed in the noncorporate businesses. This might be a consequence of tightened credit to noncorporate businesses due to the slow recovery of loans since the 2007-2008 financial crisis.

Ratio of debt to total assets of corporate and noncorporate sector.
The theoretical significance of liquidity management is extensive and can be traced back to Keynes (1936) on the key benefits of cash holdings as reducing transaction costs and acting as a buffer in cash flow uncertainties. Empirical work on firm-level cash holdings across the globe confirmed the trade-off theory (Miller & Orr, 1966) that targets an optimal liquidity considering the costs of holding excess cash balances. On the other hand, financing hierarchy theory (Myers & Majluf, 1984) states higher cash holdings act as a financial slack and is associated with higher profitability. There are several firm-level studies of the U.S. corporate sector that documented a significant inverse relationship of leverage with liquidity (measured as a ratio of cash to total assets). These include Bates et al. (2009), Opler et al. (1999), Almeida et al. (2014), and Pinkowitz, Stulz, and Williamson (2013). Studies at the aggregate level have confirmed the same (Graham et al., 2015).
However, studies on the liquidity and borrowing dynamics of the noncorporate business and its synchronicity with the corporate sector are scant. We extend our analysis to examine and compare the trends across the two sectors. A priori, a negative relationship between liquidity and leverage would imply that, cash being a negative debt, firms would resort to hold lesser cash when leverage goes up. Alternatively, if a positive relationship exists between liquidity and leverage, it would imply either ease of credit availability or requirement of funds for growth and investment opportunities in the near future. It could also happen when high-risk firms increase cash holdings as a precautionary measure in constrained periods.
Figure 5 displays the liquidity trends (measured as the ratio of cash holdings to total assets) of the corporate and noncorporate businesses. Since the 1980s, cash holdings of corporate businesses remain almost flat at around 4% to 5%, whereas cash holdings of noncorporate businesses increased four times from 2% in 1971-1980 to 8% in 2011-2015. On the other hand, we get a totally different picture of a phenomenal secular upsurge of the real cash holdings of the two sectors since 1980 (Figure 6).
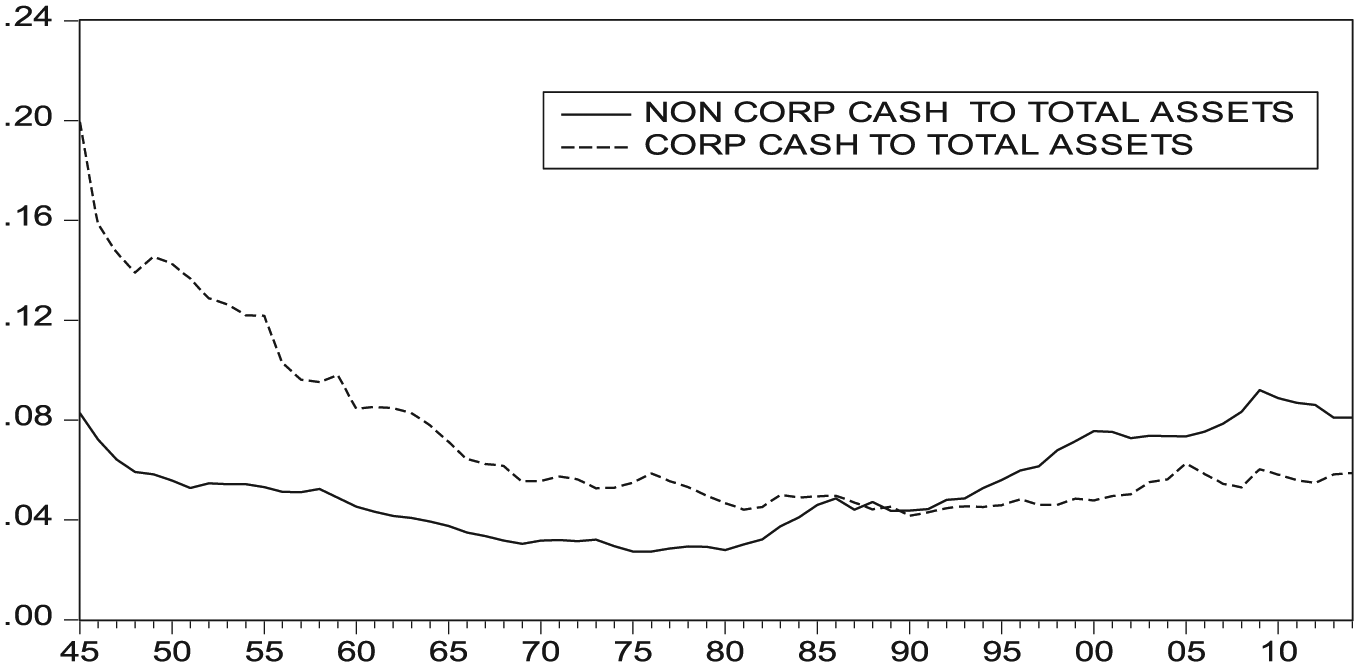
Liquidity of corporate and noncorporate sectors.

Real cash holdings of U.S. nonfinancial corporate and noncorporate sector.
Determinants of Bank Credit and Nonbank Credit
The conceptual variations in regulations, business models, and risk levels are widely varying across bank and nonbank credit as well as corporate and noncorporate businesses. We do not attempt to justify theoretically, the fundamental aspects associated with the elements of credit and businesses of the sectors. However (with this constraint in the backdrop), we empirically estimate the sector-specific financial demands that determine bank and nonbank credit flows of corporate and noncorporate businesses. The multivariate regression model to analyze the split between bank and nonbank credit flows is built on the rationale that outside financing must cover the long-term financial demand for meeting capital expenditure to fund growth, and liquidity management by meeting working capital needs and maintaining cash equivalents. The multivariate analysis of variance (MANOVA) results (Appendix C, D) indicate whether all of the multivariate regression equations, taken together, are statistically significant. The F statistics and p values for four multivariate criteria are given, including Wilks’ lambda, Lawley-Hotelling trace, Pillai’s trace, and Roy’s largest root. The results confirm the statistical significance of the overall model and the independent variables namely cash equivalents, net working capital, and capital expenditure of the corporate and noncorporate sectors, respectively, and justify the application of the model for further analysis.
The multivariate regression results presented in Table 2 consider corporate bank and nonbank credit as dependent variables in the regression framework because outside financing of corporate sector is split between bank and nonbank credit. It can be seen from the results that the coefficients for corporate cash, noncash net working capital, and capital expenditure are substantially different for nonbank credit of the corporate sector when compared with those of bank credit. The results indicate that with higher levels of capital expenditure, there is a tendency to rely more on nonbank credit and less on bank credit (3.465 for nonbank credit vs. –1.287 for bank credit). In economic terms, however, substitution of bank for nonbank credit in response to working capital requirements is negative (−1.151 vs. 0.491), implying that corporate sector prefers bank credit to fund short-term finance needs. The preference of nonbank credit over bank credit for maintaining cash balances is modest (1.638 vs. 1.034). Thus, support for preference for nonbank credit is mixed in corporate sector.
Multivariate Regression Results—Corporate Sector (1952 Q1-2015 Q4).

Note. Table 2 presents multivariate regression results (quarterly) of the corporate sector for the entire sample period from 1952 Q1 to 2015 Q4. The dependent variables are real bank and nonbank credit flows to corporate sector, and the independent variables are contemporaneous real values of cash equivalents (corp cash), noncash net working capital (corp noncash nwc) and capital expenditure (corp capex) of the corporate sector. All the variables are real values deflated based on consumer price index (CPI) 2015. The data sources are provided in Appendix A. Values are unstandardized coefficients, and values reported in parentheses () are t statistics.
statistical significance at 10% level.
statistical significance at 5% level.
statistical significance at 1% level.
In contrast, the regressions in Table 3 that split bank and nonbank credit of noncorporate sector are novel, and do not support the preference for nonbank credit for financing investments of noncorporate sector. Not surprisingly, in light of the high costs of raising long-term funds through nonbank credit, small firms in the noncorporate sector resort to cheaper bank credit. However, there is a positive propensity to switch to nonbank credit to meet short-term working capital requirements and for maintaining cash balances of the noncorporate businesses.
Multivariate Regression Results—Noncorporate Sector (1952 Q1-2015 Q4).

Note. Table 3 presents multivariate regression results (quarterly) of the noncorporate sector for the entire sample period from 1952 Q1 to 2015 Q4. The dependent variables are real bank, nonbank credit flows to noncorporate sector, and the independent variables are contemporaneous real values of cash equivalents (noncorp cash), noncash net working capital (noncorp noncash nwc) and capital expenditure (noncorp capex) of the noncorporate sector. All the variables are real values deflated based on consumer price index (CPI) 2015. The data sources are provided in Appendix B. Values are unstandardized coefficients, and values reported in parentheses () are t statistics.
statistical significance at 10% level.
statistical significance at 5% level.
statistical significance at 1% level.
Synchronicity of Credit Flows and Fund Flows
With respect to the cyclical dynamics (Table 4), both bank and noncredit tend to be relatively more procyclical in the noncorporate sector when compared with the corporate sector. This can be seen by comparing the synchronicity ratios of bank credit between corporate and noncorporate sector for the full sample period from 1952 to 2015 in columns 3 and 9 of Table 4, respectively. Similarly, columns 6 and 12 of Table 4 provide synchronicity ratios of nonbank credit. The procyclical tendency of noncorporate sector is consistent in all the cycles of liquidity, leverage, and investments. The increased procyclical tendency of noncorporate businesses emphasizes the effects of adverse macroeconomic situations. For example, a negative interest rate shock limits banks’ access to funding and forces them to adjust their lending limits. Similarly, existing levels of leverage and balance sheet health effects of noncorporate businesses also have implications for access to bank credit.
Synchronization of Bank and Nonbank Credit to Corporate and Noncorporate Sector.

Note. Synchronization ratio refers to the ratio of number of periods when the variables of corporate and noncorporate sectors are in the same phase with bank and nonbank credit divided by total observations.
We explore whether the findings remain robust across subperiods. Due to the phenomenal change in the financing landscape since 1970, because of the entry of innovative financial instruments such as mortgage securities and money market mutual funds, we split our sample into two parts between 1952 and 1979, and between 1980 and 2015, respectively. The findings indicate the following: There is an increased procyclical tendency of bank credit and nonbank credit with respect to liquidity and leverage cycles of corporate sector during the period from 1980 to 2015. However, investment cycles of corporate sector have higher synchronization with nonbank credit during 1980-2015. In contrast, nonbank credit to noncorporate sector has become markedly procyclical to liquidity, debt and investment cycles, as revealed by the synchronicity ratios in column 14 of Table 4 for the period from 1980 to 2015. Interestingly, bank credit cycle to noncorporate sector investments has remained unchanged. However, liquidity and leverage cycles of noncorporate sector have generally become less synchronized with bank credit during 1980-2015.
We also explore if there is a propagation of business cycle shocks between corporate and noncorporate sectors. We investigate the degree to which liquidity, leverage, and investments of corporate and noncorporate sector act as transmission mechanisms of business cycle shocks. Table 5 summarizes the synchronicity ratios for the full sample from 1952 Q1 to 2015 Q4 along with the two subsample results. We find a very high degree of synchronization between the two sectors, with a remarkable increase in the procyclical tendency during 1980-2015.
Synchronization of Corporate and Noncorporate Sectors.

Note. Synchronization ratio refers to the ratio of number of periods when the variables of corporate and noncorporate sectors are in the same phase divided by total observations.
Conclusion and Policy Implications
The present study analyses empirically at the aggregate level, the changing aspects of bank and nonbank credit flows and a comparison of its synchronicity with the usage of funds by the U.S. noncorporate and corporate business sectors as separate entities. The trends in the determinants of bank and nonbank credit flows to the corporate and noncorporate sector reveal a secular increase in nonbank credit in both the sectors. The study contributes to the literature in the following perspectives: (a) The study makes a unique effort to distinguish aggregate debt from the U.S. Flow of Funds Accounts into bank and nonbank credit not identified in earlier firm-level studies, (b) Using a business cycle identification algorithm, we identify the peaks and troughs in business cycle and its synchronicity with respect to liquidity, investments, bank and nonbank credit of U.S. corporate and noncorporate sector, (c) we adopt a new multivariate regression framework to nest bank and nonbank credit flows with the same set of determinants in a single model.
The business cycle dynamics reveal that nonbank credit flows have evolved as a significant source of credit for corporate and noncorporate sector with markedly higher levels of synchronicity during the period after 1980. Multivariate regression results reveal that noncorporate sector relies more on nonbank credit for short-term cash and working capital requirements, whereas corporate sector prefers nonbank credit for long-term investments. Thus, it is evident from the study that the business benefits of the choice of bank and nonbank credit far outweigh the contractual aspects such as duration and flexibility. We also find evidence of relatively higher inter-sectoral impact of business cycle shocks between corporate and noncorporate sector from 1980 to 2015. The amplified synchronicity levels of nonbank credit flows especially to the noncorporate sector necessitate appropriate resilience measures in the business cycle upsurge through countercyclical actions. Our findings are consistent with Denis and Mihov (2003) that nonbank private debt has evolved as a unique choice in fulfilling the debt financing needs of firms.
The increasing significance of nonbank credit necessitates continuous changes in the timing and intensity of monetary policies to suit changes in the transmission mechanisms. The study emphasizes that credit flows to corporate and noncorporate sector have to be monitored through customized macro prudential regulatory interventions rather than addressing through interest rates. Overall, the findings reveal that nonbank credit will be a significant part of the financial system, especially for nonfinancial businesses through this millennium.
Footnotes
Appendix A
Description of Variables—Noncorporate Sector.

| Total assets | B 104#1 | Total Assets | |
| Net worth | B 104#35 | Net worth | |
| Gross Value Added (GVA) | https://fred.stlouisfed.org | ||
| Liquidity | Cash equivalents | B 104 Sum(#12-14, #16-17) | Checkable Deposits And Currency + Total Time And Savings Deposits + Money Market Mutual Funds (MMMF) Shares + Treasury securities +Municipal Securities |
| Cash ratio | B 104 Sum(#12-14, #16-17)/#1 | (Checkable Deposits And Currency + Total Time And Savings Deposits + MMMF Shares + Treasury Securities+ Municipal Securities)/Total Assets | |
| Working capital | B 104 Sum(#10, 12, 13, 14, 16, 17, 19-22) – (#31 + #32 + #34) | (Inventories + Checkable deposits and currency+ Total time and savings deposits+ Money market mutual fund shares+ Treasury Securities + Municipal securities+ Total mortgages + consumer credit+ Trade receivables + Total miscellaneous assets) – (Trade Payables + Taxes payable+ Miscellaneous liabilities) | |
| NWC to assets | B 104 Sum(#10 + #12-22) – (#31 + #32 + #34)/B 104#1 | Working Capital/Total Assets | |
| Noncash NWC to assets | B 104 Sum(#10, 16, 17, 19-22) – (#31 + #32 + #34)/B 104 #1 | (Inventories + Total mortgages + consumer credit+ Trade receivables + Total miscellaneous assets) – (Trade Payables + Taxes payable + Miscellaneous liabilities) | |
| Profitability | Cash flows | National Income and Product Accounts (NIPA) Table 1.11 Item 13 (converted to million dollars) | Proprietor’s income |
| Cash flows to assets | NIPA Table 1.11 Item 13 (converted to million dollars)/B 104#1 | Proprietor’s income/Total Assets | |
| Leverage | Loans | B 104 #28-30 | Depository institution loans + Other loans and advances + Mortgages |
| Leverage ratio | B 104 (#28-30)/#1 | (Depository institution loans + Other loans and advances + Mortgages)/Total Assets | |
| Investments | Capex to assets | F 104 #5/B 104#1 | Capital Expenditure (fixed investment)/Total Assets |
Appendix B
Description of Variables—Corporate Sector.

| Cash equivalents | B 103 Sum(#8-12, #14-17) | Foreign deposits, Checkable Deposits And Currency + Total Time And Savings Deposits + MMMF Shares + Security repurchase agreements + Commercial paper + Treasury securities + Agency and GSE backed securities + Municipal Securities |
| Working capital | B 103 Sum(#8-12, #14-17, 19, 20, 22) – (#34 + #35) | (Foreign deposits, Checkable Deposits And Currency + Total Time And Savings Deposits + MMMF Shares + Security repurchase agreements + Commercial paper + Treasury securities + Agency and GSE backed securities + Municipal Securities + Inventories + Total mortgages + consumer credit+ Trade receivables) – (Trade Payables + Taxes payable) |
| Cash flows | F 103 #1-2 | Profit before taxes-taxes on corporate income |
| Loans | B 103 #31-33 | Depository institution loans + Other loans and advances + Mortgages |
| Total assets | B 103 #1 | Total Assets |
| Cash ratio | B 103 Sum(#8-12, #14-17)/#1 | (Checkable Deposits And Currency + Total Time And Savings Deposits + MMMF Shares + Treasury Securities+ Municipal Securities)/Total Assets |
| Leverage ratio | B 103 (#31-33)/#1 | (Depository institution loans + Other loans and advances + Mortgages)/Total Assets |
| NWC to assets | B 103 (Sum[#8-12, #14-17, 19, 20, 22, 24] – [#34 + #35 + #37])/B 103 #1 | (Foreign deposits, Checkable Deposits And Currency + Total Time And Savings Deposits + MMMF Shares + Security repurchase agreements + Commercial paper + Treasury securities + Agency and GSE backed securities + Municipal Securities Inventories + Total mortgages + consumer credit+ Trade receivables + Total miscellaneous assets) – (Trade Payables + Taxes payable + Miscellaneous liabilities)/Total Assets |
| Noncash NWC to assets | B 103 Sum(19, 20, 22, 24) – (#34 + #35 + #37)/B 103 #1 | (Inventories + Total mortgages + consumer credit+ Trade receivables + Total miscellaneous assets) – (Trade Payables + Taxes payable + Miscellaneous liabilities) |
| Capex to assets | F 103 #12/B 103 #1 | Capital Expenditure(fixed investment)/Total Assets |
| Cash flows to assets | F 103 #1-2/B 103 #1 | Profit before taxes – Taxes on corporate income/Total Assets |
| Net worth | B 103 #38 | Net worth (market value) |
| Gross Value Added (GVA) | https://fred.stlouisfed.org |
Appendix C
Appendix D
Acknowledgements
We gratefully acknowledge Prof. Yakov Amihud for his comments to improve the work. We thank Professor Richard Werner, University of Southampton, and participants at the Fourth European Conference on Banking and the Economy (ECOBATE 2016) at Winchester United Kingdom, and International Conference on Financial Markets and Corporate Finance (ICFMCF) at Indian Institute of Technology Madras. All errors are our own.
Declaration of Conflicting Interests
The author(s) declared no potential conflicts of interest with respect to the research, authorship, and/or publication of this article.
Funding
The author(s) received no financial support for the research, authorship, and/or publication of this article.