
Abstract
From the roots of corporate longevity that has been built by previous researchers, this article enhances existing work toward measuring the concept of corporate sustainable longevity (CSL) beyond an average firm’s age. By adopting the sequential exploratory mixed method, we performed this study in two phases: qualitative followed by quantitative. In the first phase, we used the Delphi method to verify and validate the thematic elements of the construct and generated a pool of items from the extant literature. In the second phase, we collected the data twice through a survey questionnaire (pilot N = 200 and final N = 271) and validated the scale through exploratory and confirmatory factor analyses. The results generated a five-factor structure of CSL with model fit indices, root mean square error of approximation (RMSEA) = 0.15, goodness-of-fit index (GFI) = 0.917, adjusted goodness-of-fit index (AGFI) = 0.901, normed fit index (NFI) = 0.938, incremental fix index (IFI) = 0.996 with comparative fit index (CFI) = 0.996 with satisfactory discriminant and convergent validities. Cronbach’s alpha ranging from 0.89 to 0.90 provided an evidence of internal consistency reliability of the CSL scale. This novel scale fills the gap in the literature by enabling practitioners and researchers in anticipating the firm’s ability to survive in the long run. The significance and limitations of the study are discussed in the end.
Keywords
Introduction
In the recent development of both theory and practice, there is a dynamic pursuance toward identifying and examining desired approaches and techniques to determine the sustainability of businesses, apart from profitability and profit growth (Cefis & Marsili, 2005; Gilbert, 1983; Glenn & Stahl, 2009). Researchers are also in constant pursuit of understanding the reasons behind business failures (Brito & Brito, 2014; Panza, Ville, & Merrett, 2018; Parker, Peters, & Turetsky, 2002). Such a thread of earlier work that encompasses various methodologies of inquiries led us to a broader context of inquiries. Why and how some businesses manage to thrive over the decades or, in some cases, centuries while many others simply vanished and could not survive to even the average firm age?
Most of the extant research is focused on corporate longevity that refers to the firm’s long life beyond the average firm age. However, research on “what enables a firm to survive longer” that corresponds to corporate sustainable longevity (CSL) is relatively limited. Moreover, current literature on CSL is implicit in nature and denotes it with corporate success, performance, sustainability, and other variables. The studies addressing the concept of CSL explicitly are a handful: see, for instance, Napolitano, Marino, and Ojala (2015) and Davis (2014). Even these studies ignore some important factors that play a vital role in CSL. Such factors are identified in the literature review section of this study.
Furthermore, the empirical evidence on what enables a firm to sustain longevity and how to measure the construct does not exist in the current literature. The existing literature is primarily focused on measuring the longevity of the firm in terms of age; see, for example, Audretsch, Houweling, and Thurik (2000); Williams and Jones (2010). Though CSL is a related concept, it is primarily different from “longevity” because it addresses the “ability” of a firm to sustain its longevity beyond average firm age. Some studies have partly contributed toward the conceptualization of CSL (Ibrahim, McGuire, & Soufani, 2009; Napolitano et al., 2015; K. R. Sharma & Dixit, 2017) and a few others have partly contributed to its operationalization (Fahed-Sreih & Djoundourian, 2006; Fatoki, 2013). However, these studies are neither converging toward a common concept nor are they thorough enough to incorporate all aspects of CSL. For instance, these studies do not address the financial strength and internal capabilities of a firm as determinants of CSL, while financial strength and internal capabilities are core elements of firm survival (Kalleberg & Leicht, 1991; Walsh & Beatty, 2007). Moreover, these studies did not provide an empirical evidence on the validity and reliability of these measures.
It can be concluded from the preceding discussion that existing research lacks a comprehensive conceptual framework of CSL as well as a reliable and valid instrument to measure the construct. Thus, the need for a reliable and valid measurement scale that encompasses the entire concept of CSL is pressing at the moment. Hence, this study endeavors to address this gap by extending the existing conceptual framework of CSL and consequently developing and validating a robust measurement scale. The proposed scale will enable the researchers and practitioners in foreseeing the longevity of a firm at any given point in time by examining the various factors internal to the firm. Moreover, it will enable managers to devise effective strategies for each specific area to achieve sustained longevity. However, it is imperative to note that this scale identifies the internal factors that affect the longevity of the firm. Though both internal and external factors play an equally important role in CSL, the external factors remain beyond the control of the firm’s management. As the nature and control of external factors are completely different, they require a separate investigation in a broader socioeconomic and political environment (Menguc, Auh, & Ozanne, 2010; Panza et al., 2018). This is also consistent with the current research trend to deal with either factor one at a time. Hence, the proposed scale will be constrained to internal organizational abilities. To achieve the objectives, we followed Hinkin, Tracey, and Enz’s (1997) step-by-step guidelines on scale development and validation. To provide further evidence on the validity of the scale, we performed discriminant and convergent validity tests.
This article is organized into five sections. Following the introduction, the “Literature review” section provides a literature review and identifies research gaps pertaining to CSL. The section, “Research method,” illustrates the research methods employed in this study and separately addresses qualitative and quantitative methods. In the section, “Findings and discussions,” the results of the qualitative and quantitative phases are discussed. The quantitative phase consists of two separate studies, that is, exploratory factor analysis (EFA) and confirmatory factor analysis (CFA). The final section, “Conclusion and implications,” concludes this study and provides its implication, future research avenues, and limitations.
Literature Review
Though CSL is a novel term, the concept is well entrenched in the theory and literature. In its literal sense, CSL refers to the ability of a firm to sustain the longevity. This section provides the background of the study and discusses the state of existing literature in terms of definition, conceptualization, theoretical underpinning, and operationalization of CSL.
Background
Most of the firms do not survive in the long run and die before the average firm life or through the second generation in case of a family firm (Ahn, 2018; Cressy, 2006). Even the average firm age has decreased significantly in the past few decades because most firms fail to adapt to the increasing complexities (Panza et al., 2018; Reeves, Levin, & Ueda, 2016). Survival is the biggest common challenge for firms around the world. In fact, only a few family firms survive in the long run (Hillebrand, 2018). Specifically, only 30% of firms survive through the second generation, 13% survive the third generation, and only 3% survive beyond that (Ward, 2011). Contemporary globalization challenges, tough competition, technological advancements, and many more elements threaten the very survival of the firms.
Definition of CSL
The current literature on firm survival, longevity, or sustainability is clearly classified into two distinct categories: corporate longevity and CSL. Where CSL corresponds to “what enables the firm to achieve longevity,” corporate longevity refers to the firm’s long life beyond the average firm age (Williams & Jones, 2010). This definition, however, does not provide an explanation of how old a firm should be, to call it long-lived or a survivor. However, most researchers believe that a firm that succeeds in surviving beyond the average firm age in a geographic region or industry can be considered as a long-lived firm (Becsi, 2002; Ibrahim et al., 2009; Williams & Jones, 2010). It is important to realize that the average firm age varies as per geographic regions and industries. However, research related to CSL identifies the characteristics, abilities or capabilities, and core competencies or strategies a firm should possess to sustain its longevity. A handful of efforts have been made to conceptualize the CSL construct. However, the challenge remains in operationalizing the construct that interacts with multiple disciplines simultaneously.
The current literature implicitly equates CSL with numerous other dependent variables such as financial and nonfinancial performance (Napolitano et al., 2015), organizational success (Fatoki, 2013), profitability (Panza et al., 2018; Walsh & Beatty, 2007), corporate reputation (Nicolò, 2015), competitive advantage (Brito & Brito, 2014), and core competencies (Prahalad, 1993). With respect to the elements that enable a firm to sustain longer, the literature is contradictory. For instance, K. R. Sharma and Dixit (2017), while investigating the longevity of century-old firms identified five keys to the longevity of such firms: be conservative, be rooted, diversify sensibly, compete but also cooperate, and look back. To some extent, these aspects seem contrary and conservative to the established findings in the existing literature that suggest adaptation (Hatum & Pettigrew, 2004), fast learning, and timely response to environmental changes (Pishdad & Haider, 2013) and customers’ needs (E. W. Anderson, Fornell, & Lehmann, 1994).
In fact, such studies identified various strategies and dynamic capabilities for firms to achieve long-term survival or CSL. In the extant literature, success and firm performance have generally been equated with business survival and longevity, as reported by Napolitano et al. (2015). However, in management research, performance and business longevity are not considered as substitutes for each other. A good performance alone does not suffice in predicting the life expectancy of a firm. Multiple internal and external elements contribute to the business longevity. Moreover, the majority of strategy literature mainly focused on identifying the internal capabilities or elements to explain the long-term success, whereas management literature mainly focused on the external elements that affect the CSL (Napolitano et al., 2015). The internal factors of CSL refer to the actors and forces within the internal environment of the firm that influence the firm’s performance and its ability to survive in the long run. The frequently identified internal factors in the existing literature include firm’s various capabilities (Bessant & Francis, 1999; Teece, 2007), learning and growth prospects (Gupta, Guha, & Krishnaswami, 2013; Kaplan & Norton, 2000), human capital (Marimuthu, Arokiasamy, & Ismail, 2009; Oliveira & Roth, 2012), competitive strategies (Balestrero & Udo, 2013; Reeves et al., 2016), maturity stage (Napolitano et al., 2015; Panza et al., 2018), leadership (Marimuthu et al., 2009; Oliveira & Roth, 2012), and financial strength (Kalleberg & Leicht, 1991; Walsh & Beatty, 2007). Whereas, external factors include the type of industry, industry life cycle, level of competition (Napolitano et al., 2015), geographic location (Williams & Jones, 2010), and PESTEL (Political, Economic, Social, Technological, Environmental and Legal) factors (Panza et al., 2018). Based on the internal elements, the existing conceptual framework is discussed in the following section.
Conceptualization of CSL
Toward the conceptualization of the CSL, the studies explicitly addressing the internal elements of CSL are comparatively handful. Researchers, such as Napolitano et al. (2015), Fatoki (2013), Fahed-Sreih and Djoundourian (2006), and Becsi (2002) explicitly explored the elements of CSL. However, the existing conceptual framework lack certain vital elements that significantly contribute to CSL. We extend the existing conceptual framework by conducting an extensive and careful literature scan that yielded 31 thematic elements of CSL. In fact, the elements that contribute to CSL are numerous in the existing literature. Nonetheless, we clustered the similar concepts under an overarching central theme. Initially conceived thematic elements of CSL from the existing literature are discussed in the following paragraphs.
A carefully established long-term vision of the firm that has effectively been communicated throughout the organization serves as a milestone for CSL (Fatoki, 2013; Napolitano et al., 2015). Kaplan and Norton (2000), in their landmark performance tool “the balanced scorecard” have given foremost importance to the vision and organizational strategies apart from financial, customer, internal, and growth perspectives. A shared vision is an important aspect of the successful organization over the long run and central to the long-term success of an organization (Neff, 2015; Senge, 2006). Moreover, effective organizational strategies must be aligned with the shared vision.
The organizational success largely depends upon the ability of its leaders to anticipate the future needs and challenges and devising the right strategies accordingly (Boga & Ensari, 2009; Stearns, Carter, Reynolds, & Williams, 1995). Matzler and Bailom (2007)’s statement “the sails determine the course, not the wind” in their book Enduring Success: What Top Companies Do Differently, is an excellent illustration of organizational vision and strategies and the role of leadership.
Along with vision and strategy, customer relationship, quality products and services, human capital, access to bank credit, stakeholder relationship, adaptation, flexibility, management competency, use of technology, business location, government support, and risk-taking have been perceived as key determinants of firm survival (Fatoki, 2013). Williams and Jones (2010) also recognized firm strategy, apart from the capital structure, the age of its owners, the ethnicity of the family, and the structure of the family, as internal factors that affect the firm longevity in small family-owned businesses in the Jamaican context.
Earlier to this, Stadler (2007) presented four principles of enduring success, namely, “Exploit before you explore, diversify your business portfolio, remember your mistakes, and be conservative about change.” Similarly, Reeves et al. (2016) suggested six principles for corporate survival that included (a) maintaining heterogeneity of people, ideas, and endeavors; (b) sustaining a modular structure; (c) preserving redundancy among components; (d) expecting surprise, but reducing uncertainty; (e) creating feedback loops and adaptive mechanisms; and (f) fostering trust and reciprocity in their business ecosystems.
Other scholars emphasized the role of corporate governance (Ahmad & Omar, 2016; Kole & Lehn, 1997; Parker et al., 2002), leadership role (Reeves et al., 2016; K. R. Sharma & Dixit, 2018), management competency, and firm performance (Abraham, Karns, Shaw, & Mena, 2001; Fatoki, 2013; McDowell, Harris, & Geho, 2016; Mwobobia, 2012) in a firm’s ability to sustain longevity. Numerous scholars underscored adaptation, flexibility to change, and innovation as great promoters of CSL. For example, P. Sharma and Salvato (2013) acknowledged adaptation, continuity, and change as the core of family firm longevity. Among other factors, adaptation has been perceived as the key driver of CSL by Napolitano et al. (2015), Fatoki (2013), and Hatum and Pettigrew (2004).
Similarly, the financial aspects are also equally important and set the foundations for CSL. The main financial aspects in the current literature include profitability and productivity, financial strength or muscles, effective cash flow management, internal and external financial controls (aka auditing), and return on capital as the primary drivers of CSL; see, for example, Narver and Slater (1990), Kalleberg and Leicht (1991), Pérotin and Robinson (2004), Walsh and Beatty (2007), Kim and Gao (2013), Kroes and Manikas (2014), and Nwanyanwu (2015). The firm’s attitude and response toward its stakeholders, particularly the owners, shareholders, investors, customers, and employees, also play a vital role in the organizational success that ultimately leads to CSL (Berman, Wicks, Kotha, & Jones, 1999; Watson, 2007).
Among all others, customer satisfaction is the most important driver of the CSL (Kozak, 2018). Customers’ satisfaction serves as the heartbeat; its absence would mean immediate death of the organization, despite the existence of all other elements. Good customer relationship, customer-oriented organizational strategies, and customers’ perceived value (Grimonpont, 2016; Lavie, Haunschild, & Khanna, 2012) are essential ways to achieve customer satisfaction that ultimately leads to CSL. In fact, the customer satisfaction mainly relies on the firm’s employees. Employees’ knowledge, skills, and experiences (aka human capital) are important assets of the firm that requires proper management. Because human capital plays the chief role in the firm’s productivity and performance, it ultimately leads to CSL (Backman, Gabe, & Mellander, 2016; Oliveira & Roth, 2012).
Other researchers have examined some important internal business processes or capabilities and argued that if these exist, and are managed effectively, they would lead a firm to sustainable longevity. Chen, Chang, and Lin (2010) and Gondal and Shahbaz (2012), in two different empirical studies, found a positive relationship between interdepartmental integration and firm performance that leads to CSL. Tseng, Divinagracia, and Divinagracia (2009) and Golicic and Smith (2013) emphasized on sustainable production processes, whereas Bessant and Francis (1999) and Jung and Wang (2006) pointed out continuous improvement as an important driver of CSL. J. C. Anderson, Rungtusanatham, and Schroeder (1994) and Flynn, Schroeder, and Sakakibara (1995), however, believed in quality management, Katila and Ahuja (2002) and Cottrell and Nault (2004) on R&D, and Aubry and Hobbs (2011) and Irefin (2013) considered superior project management as a way to achieve success and survival.
The firm choice of geographic location nationally or internationally, location of production facilities, proximity to suppliers, intermediaries, and customers also determine the performance, success, and CSL. For instance, Fatoki (2013, p. 136) noted that “firms located in metropolitan areas may have higher chances of success than those located in rural areas.” Similarly, Stearns et al. (1995) predicted that a new firm will have better chances of survival in the upstream value chain as compared with downstream in the industry value chain. Williams and Jones (2010) in an empirical investigation revealed that the location of the firm has a positive impact on its longevity.
Theoretical Foundations of CSL
The theoretical foundations of CSL remain in two theories: the Resource-based View (RBV) theory of the firm (Wernerfelt, 1984) and Balanced Scorecard Framework (Kaplan & Norton, 2000). Specifically, the internal elements of CSL are aligned with the RBV theory of the firm that accentuates various types of resources of the firm. The resource-based view of the firm argues that the ability of a firm to develop certain capabilities enables the firm to achieve sustained competitive advantage (Barney, 1991). It further enables the firm to adapt to the changing competitive environment and improves its survival prospects (Esteve-Pérez & Mañez-Castillejo, 2008). Barney (1991) classified the tangible and intangible firm resources into three distinct categories: physical capital resources, human capital resources, and organizational capital resources. The physical capital resources may include the firm’s plants, tools and equipment, its geographical location and access to raw material, and physical technology in use. Human capital resources usually include employees’ experiences, skills, training, judgments, relationships, and intelligence. Organizational capital resources include organizational structure and its attributes, organizational culture, planning, coordinating, controlling, formal and informal mutual relationships, processes, and procedures. Thus, CSL with respect to its internal elements is consistent with the resource-based view that stresses the role of the firm’s internal resources in developing and sustaining competitive advantage and firm performance that lead to long-term firm survival (Coleman, Cotei, & Farhat, 2013; Esteve-Pérez & Mañez-Castillejo, 2008; Radzi, Nor, Nazri, & Ali, 2017).
CSL, as a result of exploratory factor analysis (performed in this study), appeared in a seamless harmony with the balanced scorecard framework developed by Kaplan and Norton (2000). The balanced scorecard theory provides a framework for devising organizational strategies that create the value for the organization, enhances firm performance, and enables the firm to succeed and survive. It is used as a tool to measure and enhance organizational performance. It is a comprehensive framework to enable firms in translating vision and strategies into a coherent set of performance measures. Based on the firm’s vision and strategy, it requires managers to consider four perspectives of the firm to improve performance. The internal elements identified in the extant literature correspond to the five perspectives identified in the balanced scorecard theory. Therefore, the theoretical foundations of CSL are also consistent with the balanced scorecard theory.
Thus, the conceptual framework of CSL is established in the existing literature, however, its operationalization and measurement scale needs attention. The next section explores the state of existing literature on efforts toward operationalization and development of measurement instrument for CSL.
Operationalization of CSL Construct
In the existing literature, several researchers contributed to the measurement of corporate longevity. However, an instrument to measure CSL does not exist yet. Even the studies on the measurement scale of corporate longevity are conflicting in nature. The diverging concepts and perspectives lead to the different measurement scales. For instance, Abraham et al. (2001), Fang, Chang, and Chen (2010), and Mwobobia (2012) intended to study survival and longevity but measured firm performance instead.
Corporate longevity is usually measured in terms of the time span of the firm beyond the average firm age in a specific industry and country. Almost all the existing studies measured the longevity in terms of firm age. However, in contrast to corporate longevity, CSL is a different concept in the sense that it deals with the “ability” of a firm to sustain its longevity. Although, an integrated conceptual framework (Davis, 2014; Napolitano et al., 2015) has been developed and some scholars, such as Fahed-Sreih and Djoundourian (2006, 2008) and Fatoki (2013) attempted to operationalize the construct. However, their work is more relevant to corporate longevity that measures firm’s age instead of measuring the ability of the firm to sustain longevity (CSL). Moreover, these studies neither covered all the aspects of firm longevity nor have the scales been validated.
It is clear from the above discussions that the existing concept of CSL ignores certain important internal elements that may significantly contribute to a firm’s sustainable longevity. Moreover, the existing scales measure the firm’s age instead of the ability to sustain a long life. In this article, we endeavored to fill these research gaps by extending the existing conceptual framework and subsequently developing a valid and reliable measurement scale of CSL. The following section elaborates the research method employed in this study.
Research Method
The purpose of this study is to develop and validate a psychometrically robust measurement scale for CSL. We adopted a sequential exploratory strategy of mixed-method research. A mixed-method research has two basic choices of strategy, as identified by Creswell (2013): sequential and concurrent. In a sequential strategy, both qualitative and quantitative methods are applied one after other, whereas, in a concurrent strategy both methods are applied simultaneously. The sequential strategy is further classified into sequential exploratory, sequential explanatory, and sequential transformative. In a sequential exploratory strategy, exploratory data are collected prior to quantitative data while in a sequential explanatory strategy, quantitative data is collected prior to the qualitative data, whereas in a sequential transformative strategy, either data can be collected first as supported by the theory and the findings are integrated at interpretation stage. As this study involves the field experts for their expert opinions during the scale development process prior to collecting quantitative data, the most appropriate method for this study is sequential exploratory. Accordingly, this study has two distinct phases: qualitative followed by quantitative.
In the first phase, after conceiving thematic elements of CSL from the existing literature, we adopted a Delphi method in which a panel of field experts was involved to develop consensus on the thematic elements and to perform content and face validity of the CSL construct. In the second phase, we collected data and performed exploratory factor analysis (EFA) to uncover the underlying dimensions of CSL. Subsequently, we performed a confirmatory factor analysis (CFA) to validate the measurement scale. The detailed methodological framework of the study is presented in Figure 1 while the following subsections explain each phase in detail.

The methodological framework of the study.
Qualitative Phase
The method
A thorough scan of existing literature yielded 21 thematic elements that determine the ability of a firm to sustain its longevity. Thereafter, we adopted the Delphi method to obtain the opinions of a panel of field experts. The experts suggested 10 additional thematic elements that contribute to firm longevity. A Delphi method is a structured communication technique that is commonly used in qualitative research. The purpose of the Delphi method is to obtain the most reliable consensus of a group of experts (Dalkey & Helmer, 1963). This is achieved by getting their feedback in a series of controlled communications. Such communication takes multiple rounds until the subject matter gets a unanimous consensus of the panel. By following Dalkey and Helmer (1963) guidelines on the Delphi method, we formed a panel of 16 relevant field experts and conducted four rounds in total, as shown in Figure 1. The experts were asked whether the thematic elements and the corresponding items of the measurement scale of CSL were valid. We facilitated the process to seek their views in each round. At the end of each round, we prepared an anonymous summary of their opinions and sent it back to get their approval.
Participants
The participants of the qualitative study were a panel of 16 experts on the subject matter. The panel included four executives from the Security and Exchange Commission of Pakistan (SECP), four academicians from the Institute of Business Administration (IBA) Karachi, Pakistan, four strategic managers from the Small and Medium Enterprise Development Authority (SMEDA) of Pakistan, and four veteran owners of family firms. All the experts were qualified to verify the thematic elements of CSL. They hold required qualifications and vast experience of establishing and running or regulating (in case of SECP of SMEDA) the companies. The authors first contacted the professors at IBA who recommended four SECP and SMEDA executives and four business owners.
Quantitative Phase
The method
Once we acquired a unanimous agreement of field experts on thematic elements of CSL, and content validity and adequacy were established, we developed a survey instrument to operationalize the construct. By following Hinkin et al.’s (1997) step-by-step guide on scale development, we developed the survey questionnaire and requested face validity from the field experts. We then collected the data in two phases. In the first phase, we collected data (N = 200) to perform a pilot test by using EFA. In the second phase, we collected data (N = 271) to perform CFA to test the significance of the scale and to build construct validity. Confirmatory factor analysis (CFA) was performed on a sample of N = 271 to test the significance of the scale. The details of each step are presented in the following sections.
Instrument and questionnaire development
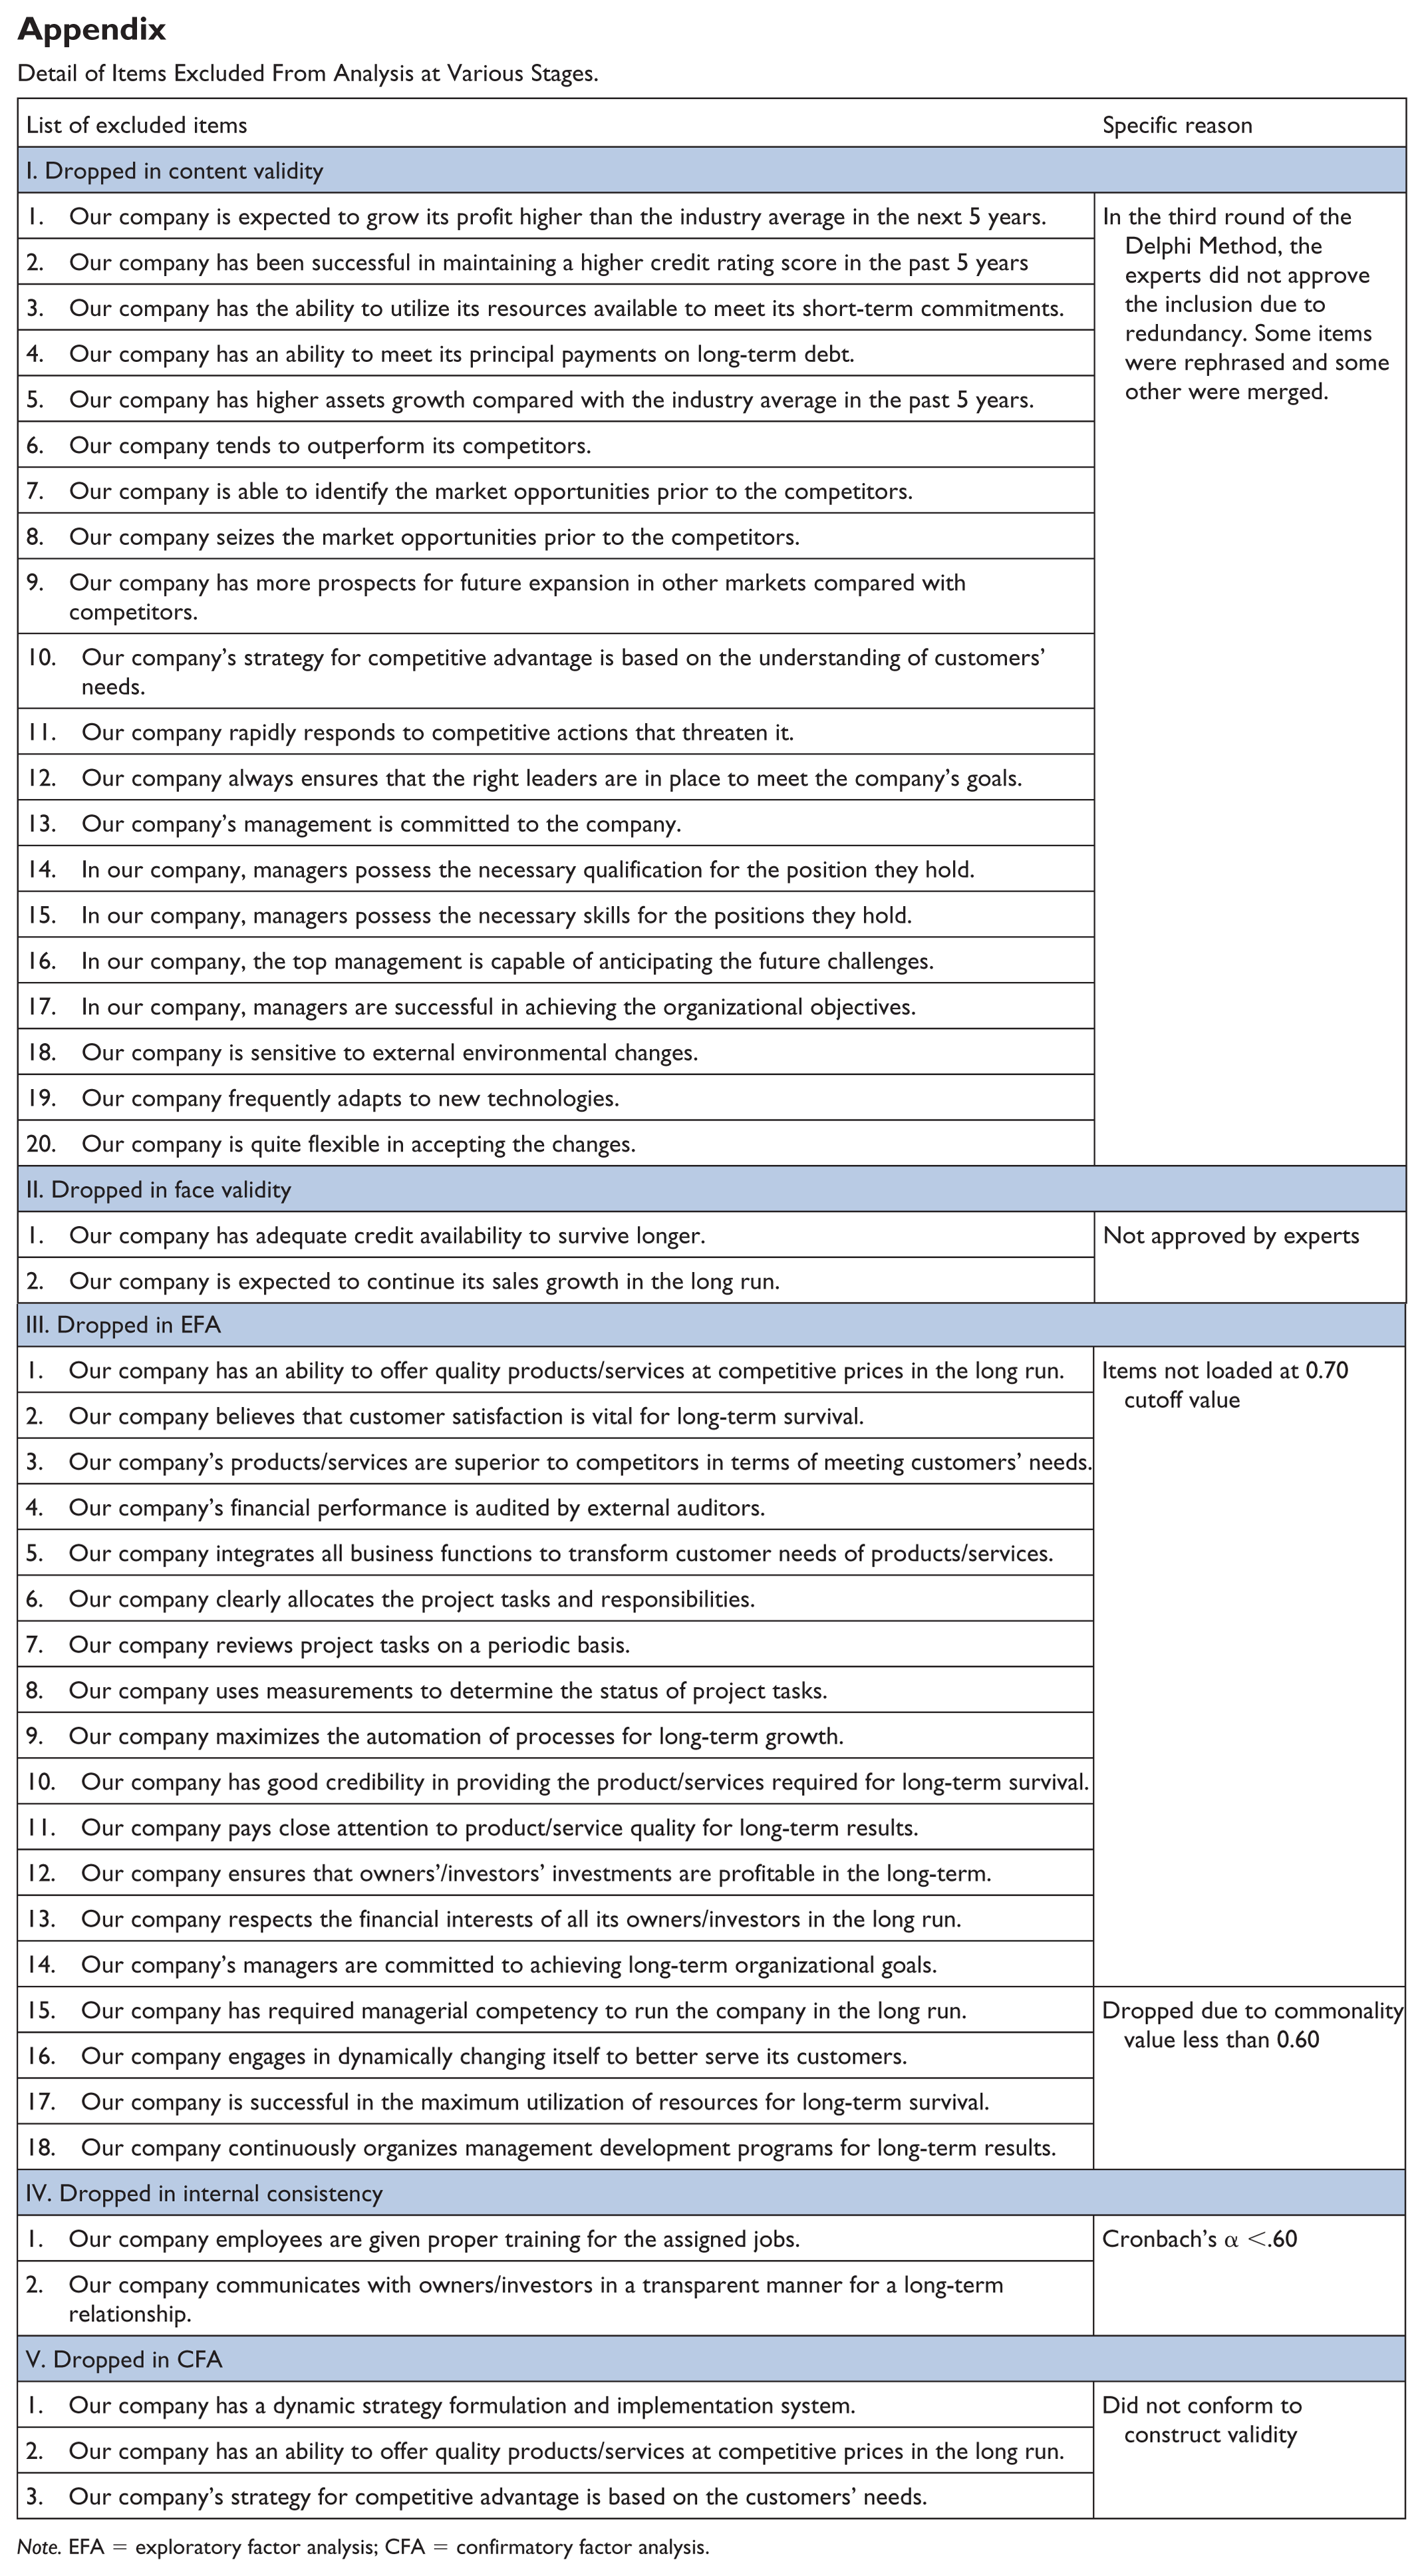
Based on thematic elements of the construct, we generated a pool of items from three sources: (a) adapted from the existing literature, (b) developed by the researchers based on latent traits of the construct, and (c) proposed by the panel of experts. Our initial pool included a total of 73 items, as shown in Figure 1. We presented the instrument to the panel of experts and several amendments were made based on their feedback, comments, and suggestions. As a result, we dropped 20 items from the initial pool and the rest were modified accordingly. We dropped another two items in the face validity that was conducted by business college professors of the Comsats University of Lahore. As a result, the pool reduced to 51 items for pilot data collection (see the appendix).
We took extensive care while formulating the items and ensured to use simple and shortest possible statements and language familiar to the respondents. Negatively worded, double-barreled, and ambiguous terms were avoided. A 5-point Likert-type scale was used in the measurement scale, where 1 represented strongly disagree and 5 represented strongly agree.
Pretest and pilot test
Prior to the pilot test, we performed a pretest of the instrument on a sample of 30 respondents to identify any potential problems in the instrument and data collection. A pilot test, however, was conducted to perform an exploratory factor analysis on a sample of 200 respondents. Further details on the pilot test are explained in the exploratory factor analysis section.
Population and sampling
We adopted a nonprobability sampling technique due to unavailability of a valid and reliable sampling frame or working population. A working population is an absolute list of elements from which sample may be drawn (Zikmund, Babin, Carr, & Griffin, 2012). The family-owned firms prevail across various firm types, such as publicly listed companies, large private firms, and SMEs. Though authentic lists for all types of firms are readily available from various institutions, however, neither these lists provide any information on family or nonfamily ownership, nor is a separate authentic list of family firms available. Moreover, due to the lack of family and nonfamily ownership information, it is not possible to develop a new list as working population. Thus, similar to Saunders’ (2011) recommendations, this study adopted judgmental nonprobability techniques. The judgmental or purposive sampling technique was considered the most suitable for this study because this enables the researcher to select appropriate cases that help in answering the research questions and meet the research objectives (Saunders, 2011). We selected the firms based on our judgment of the ownership structure, industry type, firm age, and firm size.
The target population for this study included family and nonfamily executives working at the top and middle level in the family-owned manufacturing and service companies of Pakistan. Mainly three factors motivated us to select family firms of Pakistan for data collection. These included (a) providing an evidence from one of the developing countries, as almost all the previous studies on CSL were conducted in developed countries from the West; (b) family firms are the dominant form of business in Pakistan (59%) like elsewhere in the region (Tahir, Saleem, & Aziz, 2014) and most of them die during first intergenerational transition (Afghan & Wiqar, 2007); and (c) availability of the data and access to some family firms for personal visits to collect the required data. We contacted all the selected companies, especially their CEOs, and requested them to complete at least five self-administered questionnaires from the managers of their firms. Pilot data were collected via online surveys. In this regard, a link was provided in the email to the CEOs. However, final data were collected by personally visiting the companies along with online surveys.
Findings and Discussions
Qualitative Phase
As discussed earlier, we conceived 31 thematic elements from the extant literature and field experts. These elements were sent to the panel members to provide expert opinion. Considering their comprehensive feedback, 31 elements were eventually converged into 11 overarching themes. The experts suggested merging and renaming similar elements into overarching major concepts as shown in Figure 2.

Convergence of thematic elements of CSL.
The process took four rounds in total to reach a unanimous agreement. At the end of each round, we produced an anonymous summary of the previous round and provided it to the panel members for their approval. Meanwhile, we produced a pool of 73 items and provided it to experts to attain content validity and content adequacy of measurement scale. Based on their response, 20 items were dropped, and many others were modified and adjusted (see the appendix). The panel was again provided with the summary of the previous round. The questionnaire was then developed and in the last round the panel was contacted for the face validity of the questionnaire. Subsequently, we attuned the survey questionnaire accordingly and sent it to the panel for approval prior to data collection.
Quantitative Phase
The quantitative phase consists of two studies with separate data sets. Data collection and screening process were performed twice. In the first study, data were collected for a pilot test to run EFA and in the second study, data were collected to run CFA and to test the convergent and discriminant validity of the scale.
Study 1: Exploratory factor analysis
Data collection and data screening
For the pilot test, we contacted 970 firms by email and requested them to fill the online survey. As a result, we received 386 responses of which, 246 were completed and were processed for data screening. We excluded responses with missing values, outliers, unengaged manner of response (providing the same answer for all questions), duplicate responses or respondent spending less than 5 min in completing the survey. An expected minimum time to read and fill the survey was estimated at 5 min, where average response time remained 11 min. Therefore, we dropped the responses completed in less than 5 min. This process excluded another 46 responses, leaving an effective sample size of 200 responses that corresponds to 20.6% response rate, which is considered acceptable for similar studies (Debicki, Kellermanns, Chrisman, Pearson, & Spencer, 2016).
Descriptive statistics
After screening, 200 responses were considered for further data analysis in Phase 1 of data collection. Most of the respondents were male (88%), nonfamily managers (67%) having a master’s degree (55%) and aged between 26 and 45 years (88%). Most of the respondents (78%) were senior managers with experience of more than 5 years. With respect to participating firms, most (66%) firms were aged between 5 and 20 years, whereas, 24% were older than 20 years. Among them, 50% of firms were owned and managed by the first generation while 39% of firms were in the second generation.
Results and discussions
With the aim of uncovering the underlying dimensions of CSL, we performed an exploratory factor analysis on 51 items using SPSS Version 24. The pilot data were analyzed for factor reduction, using the principal component analysis (PCA) method of extraction and Promax method of rotation. Hair, Anderson, and Tatham (1994) recommend the use of PCA using Promax with Kaiser Normalization for new scale development. We set the eigenvalue greater than 1.0 as it is a good indication of measurement item validity. Based on experts’ opinion, we set a relatively higher cutoff value for factor loading (0.7) to obtain clear factors reduction and to attain a better convergent and discriminant validity. Similarly, we set the cutoff value of commonality score of each item at 0.60 to obtain a clear factor structure and a psychometrically robust measurement scale. After fulfilling the abovementioned criteria, we applied further scrutiny and excluded the items from the analysis that did not fulfill the following criteria: first, if less than three items were loaded on any factor; second, if any item was cross loaded on more than one factor with very close loading; third, if an item showed individual KMO value of less than 0.50; and fourth, if individual item reliability was lower than the minimum threshold of .6, which might create internal consistency issues of the measurement scale. Each factor was then checked for internal consistency with Cronbach’s alpha at .70 as suggested by Hair, Black, Babin, Anderson, and Tatham (2006).
Following the criteria mentioned above, in the first run of EFA, 13 items out of 51 did not load due to factor loading value less than 0.7. Excluding those 13 items, we performed the second run and, as a result, another two items did not load. We excluded three other items due to commonality value lower than 0.60 and two items due to individual item reliability lower than .60 (see the appendix for detail of items). In the third run, with 31 items in hand, we obtained a clear five-factor solution, with better factor loadings ranging between 0.75 and .946 (see Table 1). The eigenvalues for the five factors were obtained as 12.811, 3.217, 2.956, 2.313, and 1.578, respectively. The total variance explained by the five factors solution was 73.973, whereas percentage variance explained by individual factors remained as 41.324, 10.379, 9.537, 7.462, and 5.091, respectively. In addition, Kaiser–Meyer–Olkin (KMO) measure of sampling adequacy with a value of 0.929 and a significant value of Bartlett’s Test of Sphericity showed that the data set was appropriate for factor analysis. Subsequently, we named the resulting factors based on prior knowledge (balanced scorecard framework) and according to the nature of the highly loaded items. The factors were named as financial strength, customer orientation, internal capabilities, strategic perspective, and learning and growth, respectively.
Summary of Exploratory Factor Analysis of CSL (N = 200).

Note. Extraction method: Principal component analysis, rotation method: Promax with Kaiser Normalization. Cutoff value = 0.70, KMO = .929. CSL = corporate sustainable longevity; KMO = Kaiser–Meyer–Olkin.
The EFA uncovered five underlying dimensions of CSL, where each subscale contained more than three items with higher factor loadings and sound internal consistency measures ranging between .932 and .935 (considerably above the threshold value of .70) as shown in Table 1. The extracted five factors were then tested for goodness-of-fit measure, using a confirmatory factor analysis with a new data set.
Study 2: Confirmatory factor analysis
Data collection and data screening
For this study, we contacted a total of 1,230 firms via emails and personal visits that yielded 537 responses of which 112 incomplete responses were dropped, leaving 425 responses. We applied a similar data-screening process as we did in Study 1, which eliminated 154 responses. Finally, we obtained an effective sample size of 271 with a response rate of 22%. We believe that the response rate was improved a little due to the personal visits of 40 firms out of 1,230.
Data normality test
Following data screening, we performed data normality test through skewness and kurtosis test as well as through Shapiro–Wilk test, as shown in Table 2. A normal distribution of the data requires values of skewness and kurtosis between −2 and +2 (Gravetter & Wallnau, 2014). Similarly, in the Shapiro–Wilk test, the value for each variable should be insignificant, that is, significance or p value > .05 for a normally distributed data. The results of this study showed that skewness and Kurtosis values for most of the variables were out of the recommended range. Likewise, the results of the Shapiro–Wilk test further strengthen the findings by showing significant values for all the variables. Thus, the results of these tests showed that the data in this study were not normally distributed.
Data Normality Test.

Note. Vis = strategic perspective; Fin = financial strength; Cus = customer orientation; Int = internal capabilities; Lrn = Learning and growth.
Descriptive statistics
Of the 271 respondents, 78% were male of whom 70% were nonfamily managers who were mainly aged older than 36 years (51%) and the majority (60%) held a master’s degree. Of all firms, 41% were managed by the second generation, whereas, 36% of firms were in the first generation. Only 23% firms managed to survive till the third generation and beyond.
Results and discussions
To verify and cross-validate the five-factor solution of CSL that emerged as a result of EFA, we performed a confirmatory factor analysis on the data collected in the second phase (N = 271). We carried out CFA using a covariance-based structural equation modeling (CB-SEM) tool, Amos, for testing the measurement model fit. The use of CB-SEM is generally preferred for normally distributed data. However, Jannoo, Yap, Auchoybur, and Lazim (2014) in an empirical research provided an evidence that CB-SEM can be used for a nonnormally distributed data if the sample size is 50 or above. We utilized model fit indices such as relative chi-square (χ2/df ), goodness of fit index (GFI), adjusted goodness-of-fit index (AGFI), comparative fit indices (CFIs), root mean square residual (RMR), normed fit index (NFI), incremental fit index (IFI), and the root mean square error of approximation (RMSEA). Tabachnick and Fidell (2007) and Kline (2005) recommended the value of (χ2/df ) in ranges of 1 to 2 or 1 to 3 as an indicator of a good fit between model and the sample data. The recommended values for GFI, AGFI, NFI, and IFI should be greater than 0.90, whereas CFI value should be greater than 0.95. The recommended values of RMSEA and RMR are less than 0.08 for a good model fit (Hu & Bentler, 1999). The reliability of the scale for each factor was measured through Cronbach’s alpha with a recommended threshold value of α ≥ .07 (Hair et al., 2006).
The initial model showed a relatively poor fit with values lower than the recommended level for all the model fit indices apart from relative chi-square (χ2/df = 0.833 with a p value = .00) and RMSEA (0.056). However, the p value for a measurement model should be insignificant above the .05 threshold. The initial model showed a GFI = 0.868, AGFI = 0.846, NFI = 0.868, IFI = 0.935, CFI = 0.935, and RMR = 0.110. The poor fit suggested exclusion of the items that caused the poor model fit. We examined the values of standardized residual covariance for individual items and excluded three items with significantly higher standardized residual covariance than the threshold value of 0.40. We dropped the items one after the other in an iterative run of CFA until it yielded the values of model fit indices within the acceptable limits (see the appendix for deleted items).
The final model (see Table 3) had a relative chi-square (χ2/df = 1.057) with p value = .224, indicating a lower discrepancy between the matrices, where recommended value for χ2/df is greater than 1 and less than 2 and p value should be greater than .05. The results for GFI = 0.917, AGFI = 0.901, NFI = 0.938, IFI = 0.996, and CFI = 0.996 were all above the recommended value of 0.90, indicating a better model fit that shows the ability of scale for generalization to the population or, in other words, parsimony of the instrument. The value of RMSEA (0.15) indicated that the model fit was not by chance. Similarly, the result for RMR (0.32) showed insignificant outliers in the data.
Validity and Reliability of the Measurement Scale (N = 271).

Note. χ2/df = 1.057, GFI = 0.917, AGFI = 0.901, NFI = 0.938, IFI = 0.996, CFI = 0.996, and RMSEA = 0.15, RMR = 0.32. AVE = average variance extracted; CR = composite reliability; GFI = goodness-of-fit index; AGFI = adjusted goodness-of-fit index; NFI = normed fit index; IFI = incremental fit index; CFI = comparative fit indices; RMSEA = root mean square error of approximation; RMR = root mean square residual.
Though the results of EFA and CFA established the basic construct validity and reliability of the CLS scale, we provide additional evidence of scale validity through convergent and discriminant validity tests. We ensured the convergent validity by setting a relatively higher cutoff value of 0.70 for factor loadings. Whereas, the discriminant validity was performed to check the degree to which each factor was empirically different from others. The discriminant validity was determined by comparing the square root of the average variance extracted (AVE) with squared correlation coefficients between each pair of the factors. A greater AVE value of the factors, compared with their relevant squared correlation coefficients, provide evidence of the discriminant validity of the construct.
Convergent and discriminant validity
Relatively higher standardized factor loadings (values ranging from 0.70 to 0.92, at significance p < .5; see Figure 3) with an internal consistency (Cronbach’s alpha ranging from .89 to .94) provided sufficient evidence that the specified indicators truly represent the relevant constructs (see Table 3). The assessment of higher loadings, in comparison with insignificant weights of indicators to their respective latent variables, yielded a first-order reflective measurement model, as shown in Figure 3, namely, the confirmatory measurement model for CSL. To establish the convergent validity, the average variance extracted (AVE) for each factor should be greater than 0.5 and composite reliability (CR) should be above the minimum criteria (CR > .70). Moreover, the CR values should be greater than AVE values. As shown in Table 3, the results of this study indicated that all the three recommended criteria were met to establish the convergent validity of the CSL scale.

The confirmatory measurement model for CSL.
Furthermore, to examine the discriminate validity of the constructs, AVE value of each construct was compared against the squared correlation coefficients between the constructs. The bold values in parentheses in Table 4 represent the AVE of the constructs, whereas, other values show squared correlations coefficients between the constructs. It is apparent from Table 4 that AVE values were larger than the squared correlations coefficients between the constructs. Moreover, covariance among unobserved variables is reasonably lower than the threshold of 0.80 (see Figure 3). Thus, according to Hair et al. (2006), discriminant validity of the CSL measurement scale could be claimed. The following section provides an assessment of second-order construct.
Discriminant Validity.

Note. The bold values in parentheses represent the AVE of the constructs, while others show squared correlations coefficients between the constructs. AVE = average variance extracted.
Assessing second order construct
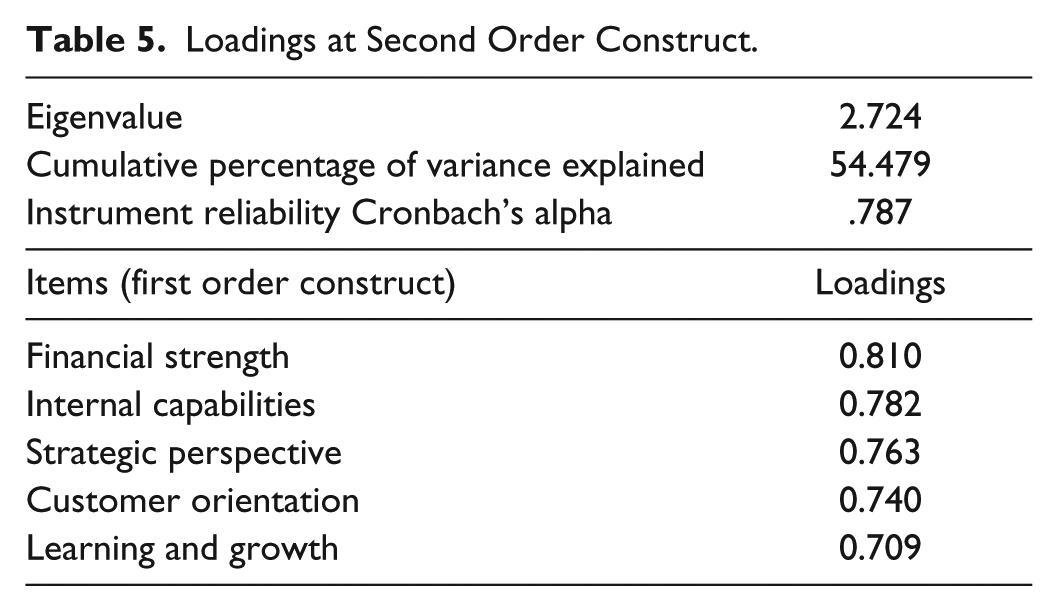
Once construct validity of measurement was established at first order, we assessed the reliability and validity of the model at second-order construct. The analysis showed that the second-order model was reflective as well—thus generating a reflective-reflective second-order model. The loadings of the first-order latent construct on a second-order construct (CSL) are provided in Table 5. The results have shown that all the first-order constructs were fairly loaded (> 0.70 threshold value) to their respective second-order constructs with acceptable reliability (> .60), the cumulative percentage of variance explained (54.479), and Eigenvalue (2.724). Moreover, all the loadings were significant (> 2.57) at a 99% confidence interval.
Loadings at Second Order Construct.
Final Validation Result
To conclude, we validated the CSL construct qualitatively through field experts’ panel and quantitatively through EFA, CFA, and convergent and discriminant validity tests. Consequently, CSL finally emerged as a five-dimensional construct with 28 validated items in total. The five dimensions included strategic perspective with five items, customer orientation with six items, financial strength with seven items, learning and growth perspective with four items, and internal capabilities with six items (see Table 3). Hence, the measurement model of CSL successfully fulfilled construct validity criteria as well as reliability requirements.
Conclusion and Implications
In this study, we endeavored to refine the conceptual framework of CSL and consequently developed and validated its measurement scale. Based on an extensive literature review and subsequent agreement of experts, we induced new thematic elements that were missing in the existing conceptual framework of CSL mainly developed by Napolitano et al. (2015). The inclusion of new thematic elements is supported by the existing theory and literature. The novel themes included sustainable production (Golicic & Smith, 2013; Tseng et al., 2009), shared vision (Neff, 2015; Senge, 2006), stakeholder relationship (Berman et al., 1999; Watson, 2007), human capital (Backman et al., 2016; Oliveira & Roth, 2012), knowledge capital (Agarwal, Echambadi, Franco, & Sarkar, 2004; Darroch, 2005), and interdepartmental integration (Chen et al., 2010; Gondal & Shahbaz, 2012).
With respect to scale development and validation, we conducted a mixed-method sequential exploratory research. We established the initial construct validity of the scale through a panel of 16 field experts who ensured content adequacy, content validity, and face validity in multiple rounds. As a result, the originally conceived 31 thematic elements were converted into 11 overarching themes, based on which a survey questionnaire was designed to collect the data for pretest and pilot test. Consequently, exploratory (EFA) and confirmatory (CFA) analyses were conducted to validate the scale. CSL emerged as a five-dimensional construct as a result of EFA. The dimensions included strategic perspective, customer orientation, financial strength, learning and growth perspective, and internal capabilities. While the CSL concept is rooted in Resource-Based View (RBS) theory, the resulting five-factor solution seems to be in harmony with the Balanced Scorecard Framework (Kaplan & Norton, 1996, 2000). The Balanced Scorecard is a renowned strategic management tool and is used to enhance firm performance that eventually leads to sustainable longevity. Consequently, we performed construct validity of the CSL scale through CFA on a separate data set. We ensured further reliability and validity of the scale through convergent and discriminant validity tests as well as model fit indices (RMSEA = 0.15, GFI = 0.917, AGFI = 0.901, NFI = 0.938, IFI = 0.996, and CFI = 0.996). The satisfactory results of model fit indices, discriminant and convergent validities, and Cronbach’s alpha (ranging from .89 to .90) provided evidence of a psychometrically valid and reliable measurement scale of CSL.
Thus, this study contributes to the body of knowledge by extending the existing conceptual framework of CSL and by operationalizing the construct for the first time. In a broader sense, the results suggest that managers should devise organizational strategies in five areas identified in this study to achieve the ability to sustain firm longevity. Overall, the results of this study enable managers to predict the ability of the firm to sustain its longevity. Each dimension of CSL has important implications for the managers. The strategic perspective accentuates that firms with shared vision (Neff, 2015), and the ability to execute the organizational strategies successfully, are likely to sustain longevity. It encapsulates the role of leadership in devising the right strategies based on careful market analysis (Stearns et al., 1995). The second dimension covers the broader spectrum of customer orientation. It is obvious that a firm cannot exist without customers. Thus, customer satisfaction, loyalty, perception, relationship, and customer-focused strategies are core variables that play a vital role in a firm’s very existence and its ability to sustain the longevity. Similarly, a financially strong firm, with consistent profitability and return on capital, effective cash flow management, and strict internal and external financial controls enable it to not only grow faster and outperform the competitors but also guarantees sustainable longevity. The fourth dimension, learning and growth, is primarily concerned with organizational ability to learn and adapt to the rapidly changing globalized environment. For this purpose, a proactive research and development unit with the ability to anticipate the forthcoming consumer needs and respond in a timely manner provide a competitive advantage to the firm that ultimately leads to sustainable longevity. The internal capabilities dimension deals with organizational resources and capabilities. From physical to financial and from technological to human resources, all are valuable assets of the firm serving as key success factors that the firm can transform into core competencies to achieve competitive advantage. Efficient resource utilization, managerial competencies, superior quality, and project management and sustainable production are considered the core organizational capabilities. Whereas, firm technology, culture, interdepartmental integration, human capital, and firm experience curve are considered the core resources of the organization to build upon the competencies. Relatively stronger internal capabilities enable the firm to achieve competitive advantage over its competitors and at the same time enhance performance and its prospects for sustainable longevity.
This novel piece of work on CSL opens new avenues for future research. The future research can focus on testing the CSL scale in various firm types and geographical contexts. Moreover, the researchers can explore the relationships of a wide range of variables with CSL as antecedents or consequences. As we focused only on the internal aspects of the firm that contribute to firm longevity, future research might explore the external aspects to conceptualize a holistic view of CSL. Subsequently, the holistic concept of CSL can be operationalized by following the methodological framework employed in this study. It is important to note that this study has certain limitations. As managers of the firm do not have direct control over the external environmental factors as they do over the internal, this study focused mainly on the internal aspects of the firm that enable it in achieving CSL. Moreover, this study was conducted in privately held firms in a specific geographic perspective. Therefore, its application to other types of firms, especially the publicly listed firms and firms operating in geographic regions with different characteristics, may require adaptation. However, these gaps invite the attention of scholars to extend the prospects of CSL and cross-validate the scale across the geographic regions and in different types of industry.
Footnotes
Appendix
Detail of Items Excluded From Analysis at Various Stages.
| List of excluded items | Specific reason |
|---|---|
| I. Dropped in content validity | |
| 1. Our company is expected to grow its profit higher than the industry average in the next 5 years. | In the third round of the Delphi Method, the experts did not approve the inclusion due to redundancy. Some items were rephrased and some other were merged. |
| 2. Our company has been successful in maintaining a higher credit rating score in the past 5 years | |
| 3. Our company has the ability to utilize its resources available to meet its short-term commitments. | |
| 4. Our company has an ability to meet its principal payments on long-term debt. | |
| 5. Our company has higher assets growth compared with the industry average in the past 5 years. | |
| 6. Our company tends to outperform its competitors. | |
| 7. Our company is able to identify the market opportunities prior to the competitors. | |
| 8. Our company seizes the market opportunities prior to the competitors. | |
| 9. Our company has more prospects for future expansion in other markets compared with competitors. | |
| 10. Our company’s strategy for competitive advantage is based on the understanding of customers’ needs. | |
| 11. Our company rapidly responds to competitive actions that threaten it. | |
| 12. Our company always ensures that the right leaders are in place to meet the company’s goals. | |
| 13. Our company’s management is committed to the company. | |
| 14. In our company, managers possess the necessary qualification for the position they hold. | |
| 15. In our company, managers possess the necessary skills for the positions they hold. | |
| 16. In our company, the top management is capable of anticipating the future challenges. | |
| 17. In our company, managers are successful in achieving the organizational objectives. | |
| 18. Our company is sensitive to external environmental changes. | |
| 19. Our company frequently adapts to new technologies. | |
| 20. Our company is quite flexible in accepting the changes. | |
| II. Dropped in face validity | |
| 1. Our company has adequate credit availability to survive longer. | Not approved by experts |
| 2. Our company is expected to continue its sales growth in the long run. | |
| III. Dropped in EFA | |
| 1. Our company has an ability to offer quality products/services at competitive prices in the long run. | Items not loaded at 0.70 cutoff value |
| 2. Our company believes that customer satisfaction is vital for long-term survival. | |
| 3. Our company’s products/services are superior to competitors in terms of meeting customers’ needs. | |
| 4. Our company’s financial performance is audited by external auditors. | |
| 5. Our company integrates all business functions to transform customer needs of products/services. | |
| 6. Our company clearly allocates the project tasks and responsibilities. | |
| 7. Our company reviews project tasks on a periodic basis. | |
| 8. Our company uses measurements to determine the status of project tasks. | |
| 9. Our company maximizes the automation of processes for long-term growth. | |
| 10. Our company has good credibility in providing the product/services required for long-term survival. | |
| 11. Our company pays close attention to product/service quality for long-term results. | |
| 12. Our company ensures that owners’/investors’ investments are profitable in the long-term. | |
| 13. Our company respects the financial interests of all its owners/investors in the long run. | |
| 14. Our company’s managers are committed to achieving long-term organizational goals. | |
| 15. Our company has required managerial competency to run the company in the long run. | Dropped due to commonality value less than 0.60 |
| 16. Our company engages in dynamically changing itself to better serve its customers. | |
| 17. Our company is successful in the maximum utilization of resources for long-term survival. | |
| 18. Our company continuously organizes management development programs for long-term results. | |
| IV. Dropped in internal consistency | |
| 1. Our company employees are given proper training for the assigned jobs. | Cronbach’s α <.60 |
| 2. Our company communicates with owners/investors in a transparent manner for a long-term relationship. | |
| V. Dropped in CFA | |
| 1. Our company has a dynamic strategy formulation and implementation system. | Did not conform to construct validity |
| 2. Our company has an ability to offer quality products/services at competitive prices in the long run. | |
| 3. Our company’s strategy for competitive advantage is based on the customers’ needs. | |
Note. EFA = exploratory factor analysis; CFA = confirmatory factor analysis.
Declaration of Conflicting Interests
The author(s) declared no potential conflicts of interest with respect to the research, authorship, and/or publication of this article.
Funding
The author(s) received no financial support for the research, authorship, and/or publication of this article.