
Abstract
Despite the recognized value that Business Intelligence (BI) systems bring to organizations, our understanding of the system quality and its impact on service-oriented architecture is limited. This study seeks to examine the impact of system quality on service-oriented BI architecture. Following the theory in the Information System success model, this study assesses the factors that can create impact to the individual and the organization. A total of 60 sample data were collected and analyzed using the partial least squares method. Majority of the respondents are the IT practitioners who hold managerial positions in their respective companies. The results suggest there are two sets of system quality factors. This study contributes to the literature of BI architecture. The managerial findings will be useful for BI stakeholders in the planning, reviewing, and implementing of SOA-based BI architecture.
Keywords
Introduction
In recent years, businesses are moving toward their effort in implementing data-driven and analytics-driven Business Intelligence (BI) systems to gain insightful decisions. Refer to the Gartner report in 2015, BI platforms’ global market increased by 9% in year 2013, and over the next 5 years, it is predicted to perpetually expand at a compound annual growth rate (CAGR) of 8.7%.
A regular BI system is an integrated suite that provides a wide range of functionalities. It provides a toolset for dashboards, online analytical processing (OLAP) tools, production reporting, financial reporting, multidimensional analytics, data-mining tools, ad hoc querying and reporting tools, predictive analytics tools, and advanced visualization capabilities (Larson, 2012; Sabherwal & Becerra-Fernandez, 2010; Sharda, Delen, Turban, Aronson, & Liang, 2014; Turban, Sharda, & Delen, 2011). To make advantageous organizational business decisions, BI is a significant field of study in research and practice. A few BI success frameworks have been proposed by academic researchers from the managerial perspective (Arnott & Pervan, 2008; Dinter & Florian, 2009; Hou, 2015a, 2015b; W. Wang, Liu, Feng, & Wang, 2014; Wang & Wang, 2008; Yeoh & Koronios, 2010). However, limited studies have assessed its system quality factors from the technical perspective particularly by the service-oriented concept. And none of the previous studies concentrate on the impact of SOA-based BI architecture system quality factors. Therefore, this study seeks to narrow the gap between practice and academic research by investigating the impact of the system quality factors on SOA-based BI architecture.
This study uses confirmatory factor analysis (CFA) to dispread and demystify a researcher’s insight. A 44-item Likert-scale survey instrument is developed to assess BI architecture on two constructs (organizational operational construct and organizational performance construct) to assess the impact of individual indicators on their respective constructs, to examine the factorial validity, and ultimately to test the proposed hypotheses. For the purpose of performing CFA, the data are analyzed with partial least squares–structural equation modeling (PLS-SEM) as the model analysis technique.
In the following section, the underlying literature of our research is exhibited. The conceptualized research model is then proposed. The subsequent section of the paper includes the research design, methodology, and results. Finally, the results are deliberated, as well as the contributions to research and practice, while further possible future studies are outlined.
Literature Review
BI architecture
Generally, a widely adopted modern enterprise-level BI architecture is a distributed multitier architecture that consists of a data warehouse as the common back-end layer (Davenport & Harris, 2017).
Service-oriented architecture (SOA)
SOA is described as a group of established services that can be combined, reused, and has the ability to communicate with each other over networks on demand (Erl, 2005). Also, individual services are accessible without knowing the underlying system platform.
System quality factors
To date, based on the analysis in Table 1, it is found that there is plenty of academic research into the factors that influence BI architecture on the SOA concept. Pertaining to the conscientious examination of the academic and practitioner literature related to the factors that are influencing SOA, BI, and software architectural design, a composite matrix is developed as shown in Table 1. Meier (2009) and O’Brien, Merson, and Bass (2007) proposed some factors in SOA and enterprise system architecture design, respectively. In particular, O’Brien et al. (2007) deliberated about the quality attributes for SOA rather than the quality attributes for BI on the service-oriented concept. In the later study, Meier (2009) demonstrated a straightforward way to organize the space particularly in SOA by grouping the SOA quality attributes in four classifications in an SOA framework, namely “system,” “user qualities,” “design-time,” and “runtime.” However, these classifications are not appropriate for SOA-based BI. Table 1 depicts the quality attributes as proposed by O’Brien and Meier. However, all the quality attributes were not corresponded to SOA-based BI. On the other hand, Dinter and Florian (2009) identified four design factors such as “process orientation,” “excellence in SOA-based BI,” “excellence in embedded BI,” and “excellence in data management,” which are merely concentrated on the managerial context of SOA-based BI rather than the system quality factors for SOA-based BI architecture. Yoon and Jeong (2018) explored merely the factors essential to a successful SOA implementation but not the BI architecture context. Using Delphi method, Müller, Linders, and Pires (2010) targeted the identification of opportunities and limitations of SOA in BI implementations but not focusing on the system quality factors of SOA-based BI architecture. In short, the previous studies on SOA (Dinter & Florian, 2009; Meier, 2009; Müller et al., 2010; O’Brien et al., 2007; Yoon & Jeong, 2018) did not focus on the impact of system quality factors on SOA-based BI architecture, and this study tries to address the gap between practitioner literature and academic research.
The Definitions and Analysis of the Factors in Model Construct of This Study.
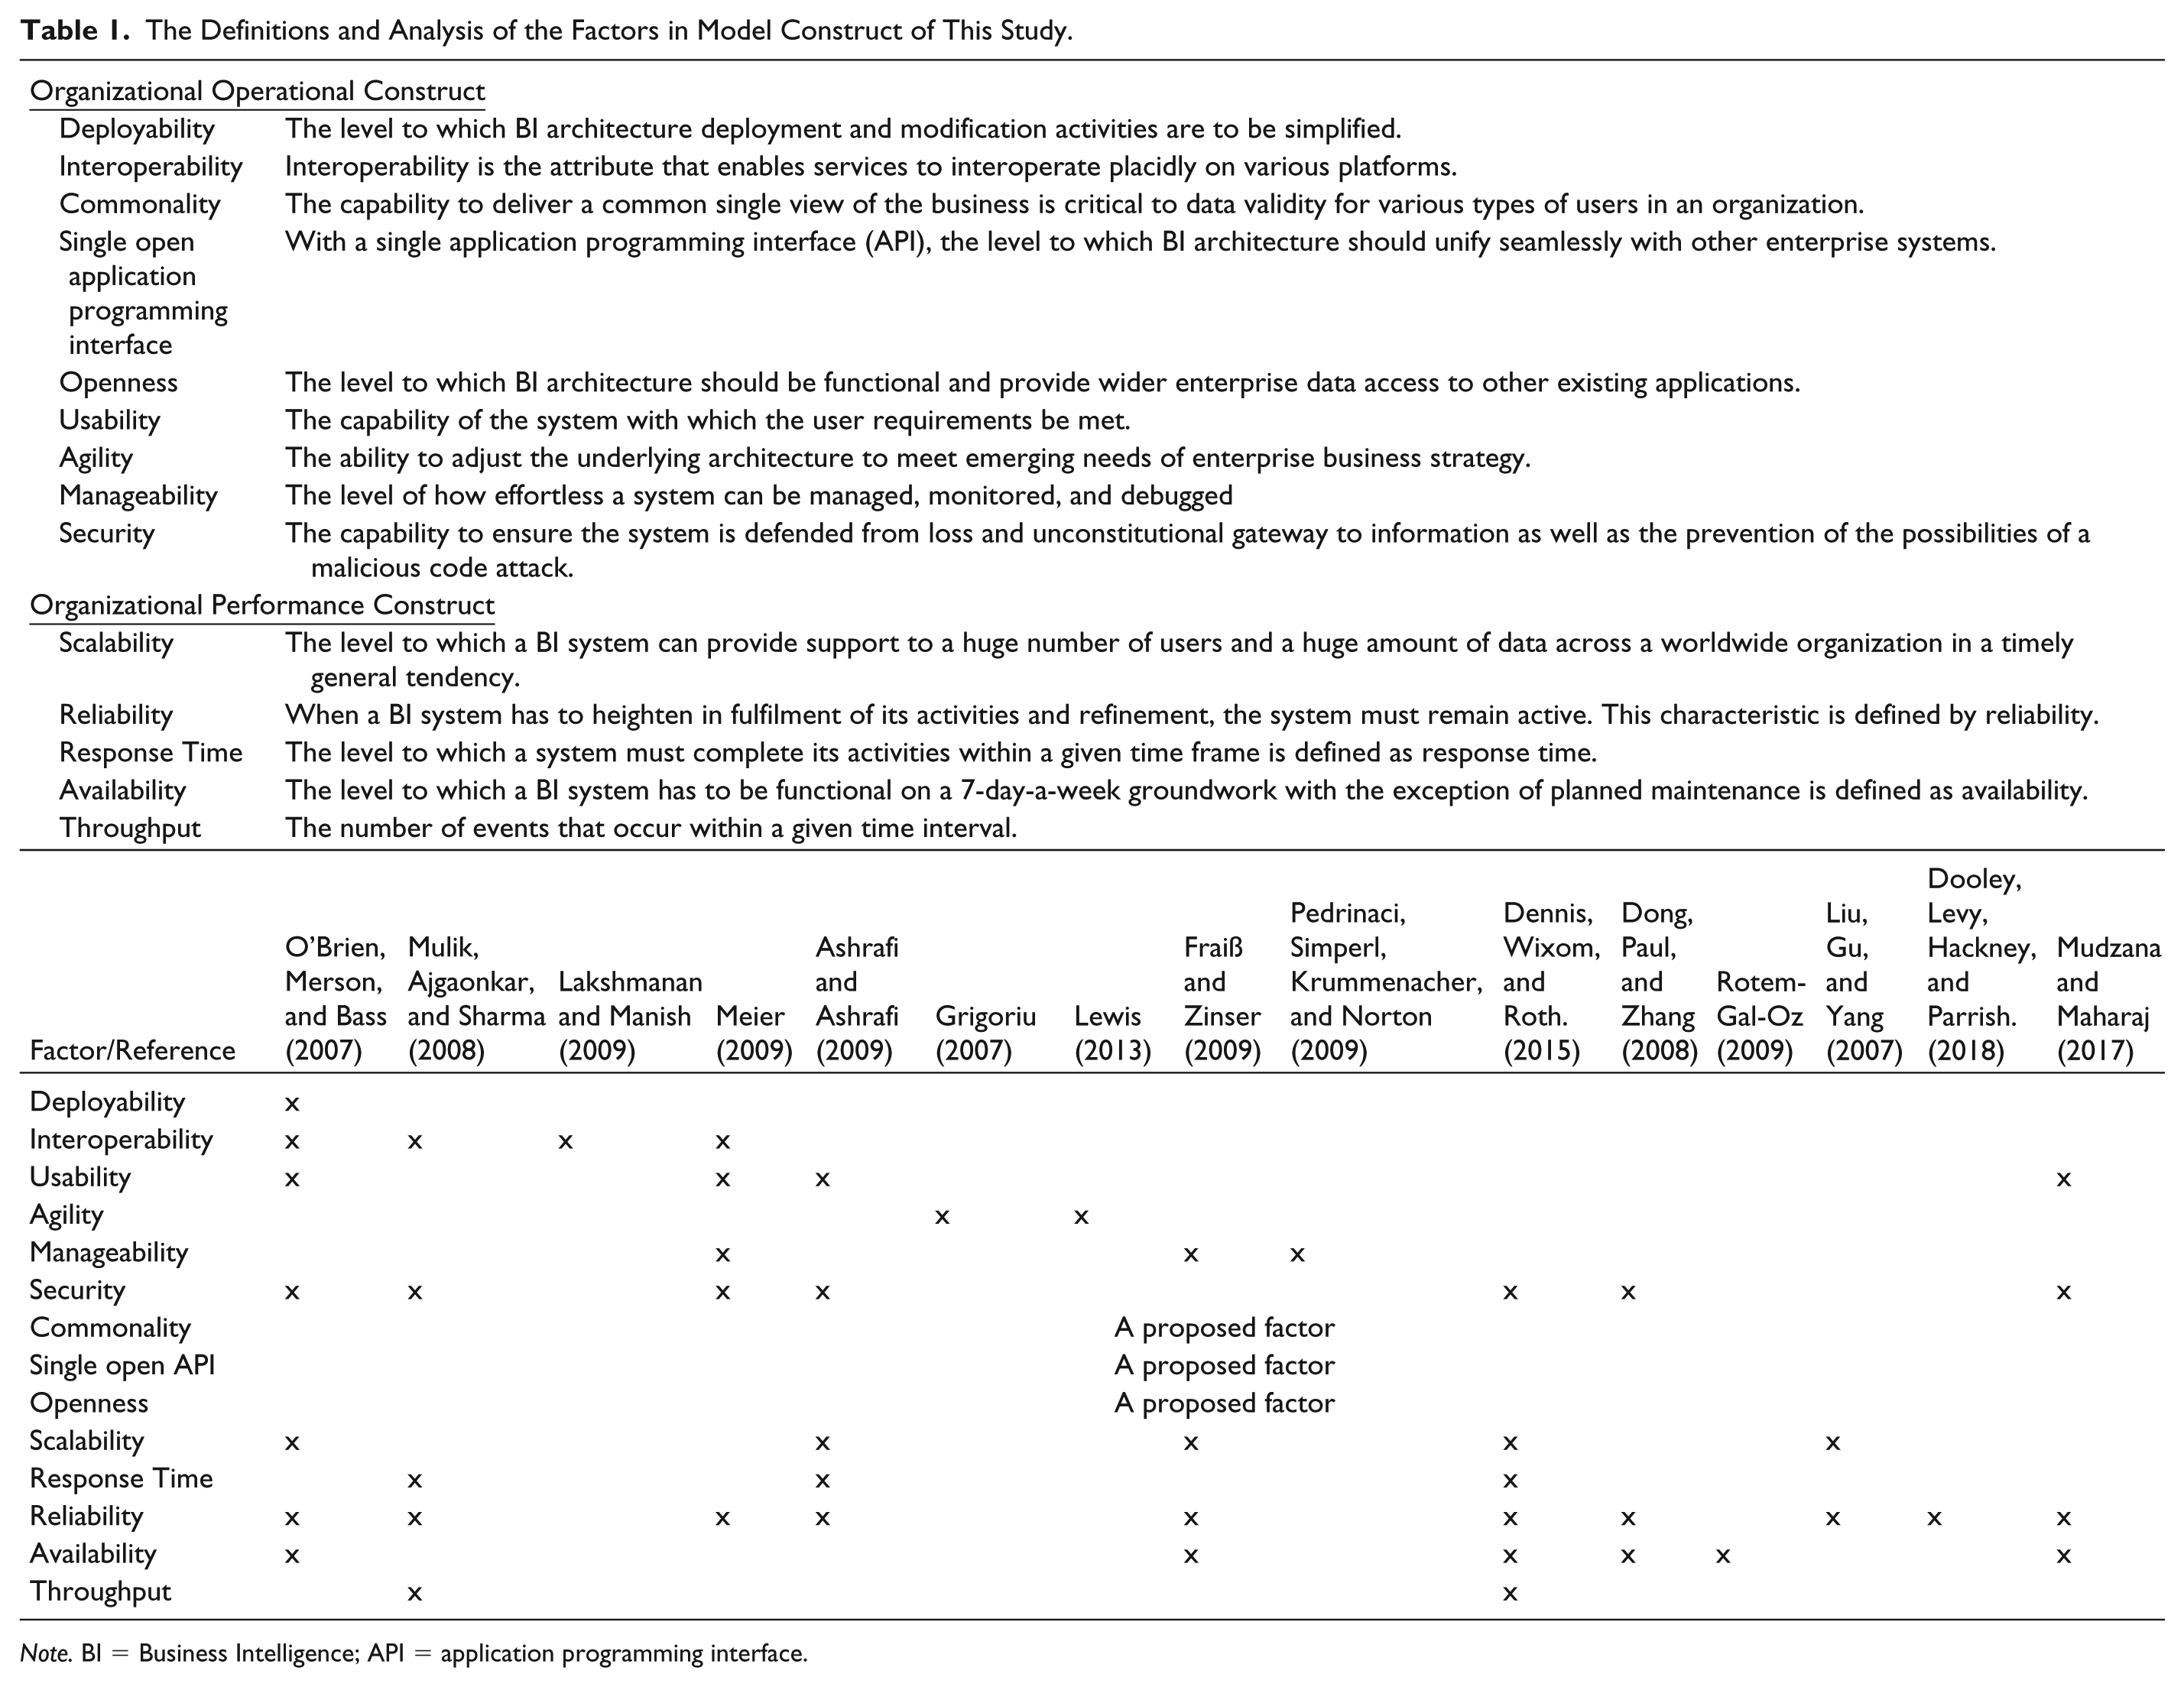
Note. BI = Business Intelligence; API = application programming interface.
Theoretical perspective and hypothesis formation
With regard to an extensive literature review, it can be concluded that most of the factors for SOA-based BI architecture belong to the rubric of operational requirements and performance requirements. Henceforth, this study would not consider political requirements. A more extensive model that influences the quality of SOA-based BI architecture is proposed as delivered in Table 2 (Chan, Sim, & Yeoh, 2011; Chan, Yeoh, Choo, & Lau, 2012). The factors within corresponding constructs are discussed in the following.
Sources of Items.

Organizational operational construct
The functioning setting with which a BI system must operate over a duration is defined as operational requirements (Ashrafi & Ashrafi, 2009; Bennett, McRobb, & Farmer, 2006; Dennis, Wixom, & Roth, 2015). Security, agility, manageability, usability, and interoperability are typical factors that are found in both software architecture and service-oriented architecture. In this study, several new factors that could influence the productivity of a BI system such as openness, commonality, and single open API as the supplementary to the trivial system quality factors in software architecture and service-oriented architecture contexts are proposed.
Interoperability is the attribute that enables services to interoperate placidly on various platforms. O’Brien et al. (2007) emphasized that “the architecture should be designed and weighted to avoid any performance drawbacks since interoperability may cause performance overhead.” Usability defines the efficiency of use with the minimum potential human errors. As indicated by O’Brien et al. (2007), the essence of SOA in the study of computer-distributed systems present an enormous constraint on usability particularly referring the processing from users’ requests to remote service providers. Agility defines the ability to adjust the underlying architecture to meet emerging needs of enterprise business strategy. Agility could be achieved via architecture process restructuring by keeping the architectural elements visible and, thus, can be explicitly managed. Manageability is the extent of how effortless a system can be managed, monitored, and debugged (Meier, 2009). Run-time quality of a system is defined as manageability. A few significant issues related to manageability was identified by Meier (2009). These key issues include incomplete information on troubleshooting tools, runtime configurability, monitoring, tracking, and analytical tools. O’Brien et al. (2007) further claimed that security is a major challenge for SOA and Web Services. Dong, Paul, and Zhang (2008) emphasized that a service-oriented system should support fault detection, authentication capabilities, or even automation of trust negotiation. Security is accomplished with three bottom line spaces, namely, confidentiality, integrity, and authentication. And all these spaces could be handled by security protocol called Secure Socket Layer (SSL). On the other hand, the distributed components in SOA could further improve the scalability and manageability in an SOA-based BI.
Organizational performance construct
As mentioned by Bennett et al. (2006), Dennis et al. (2015), and Ashrafi and Ashrafi (2009), response time of a pair of the output and input volume within a given duration of a system is defined as performance requirements. In this study, performance construct consists of five factors. They are response time, throughput, availability, reliability, and scalability.
The level to which system must complete its activities within a given time frame is defined as response time. Response time plays an important role as pointed out by O’Brien et al. (2007) since performance has negative outcome in the design and evaluation of SOA prior to a system implementation in most cases. Throughput indicates the number of events that occur within a given time interval (Meier, 2009). Throughput defines rate of completed incoming transactions per second and is one of the measures in performance that serves as a mark for the responsiveness of a system. Throughput was categorized as one of the evaluation measures in the process of SOA-based BI (Abelló & Romero, 2012). The scope to which a BI system has to be functional on a 7-day-a-week basis with the exception of planned support is defined as availability. O’Brien et al. (2007) suggested that availability is about the realization of SOA between a provider and a user. Furthermore, Meier (2009) emphasized that the failure of a physical tier, that is, application server or database server, may devote to the disrepair of the entire system. By generating the percentage of the total outage duration over a presumed duration, the degree of time that a system is operating could be defined by availability. Availability as defined by Liu et al. (2007) is the readiness for use of a web service in SOA. The attack of malicious code or computer virus, the failure of system and infrastructure, and system load could prevail over availability (Meier, 2009). An SOA-based system needs to be operated smoothly especially with the implementation of distributed transactions via services in distinguished languages and platforms (O’Brien et al., 2007). When a BI system has to heighten in fulfilment of its activities and refinement, the system must remain active. This characteristic is defined by reliability. Meier (2009) specified reliability as the proficiency of a system to remain functional over a precise duration. Scalability is defined by the matter to which a BI system in providing support to a huge number of users and a huge amount of data across a worldwide organization in a timely fashion. In addition, O’Brien et al. (2007) emphasized that rising number of users or volume could be a main problem in SOA if Web services technology exclude any scalability characteristics. Scalability is a high-priority challenge mostly because a system is expected to be functional—though when there are alterations either to the load or to the demand (Meier, 2009).
To understand the impact of the proposed factors to system quality and, thus, individuals as well as to the organizations, a matrix of variables is depicted in Table 2. To ensure the previous suggested factors would lead to information system (IS) success, Delone and McLean’s (1992) IS success model is chosen as the overarching guiding principle.
Delone and McLean’s (1992) IS success model
The Delone and McLean (1992) IS success model is known as one of the most widely cited IS success models and served as a robust indicator of IS success. Depending on their research context, DeLone and McLean (1992) recommended researchers should select appropriate measures from the success model. Therefore, in this study, five independent constructs were developed on the basis of DeLone and McLean’s (1992) IS Success Model. Organizational operational construct, organizational performance construct, system quality, individual performance, and organizational performance are used to assess SOA-based BI architecture success. These constructs are posited to be correlated measures of the same phenomenon in multiconstruct, namely, SOA-based BI success. The measurement model includes 44 subitems that measure the five constructs in this study.
System quality
A successful SOA-based BI architecture is generally characterized by ease-of-use, functionality, data quality, speedy information retrieval (DeLone & McLean, 2003; Sedera & Gable, 2004; Xu & Hwang, 2008). The success of a BI system is more than likely to be assessed by how simple and conducive it is for both IS professional and end users to generate information to support decision making. Thus, along these lines, this study chose “easy to use,” “speedy information retrieval,” and “reliable data” to measure system quality. The following hypotheses are proposed:
Individual performance
Several IS researchers (Chung, Skibniewski, & Kwak, 2009; DeLone & McLean, 2003; Sedera & Gable, 2004; Xu & Hwang, 2008) have proved that measures could be used to measure individual performance in an organization. Consequently, this study chose “decision effectively,” “individual productivity,” and “job performance” to measure individual performance because with more, useful, and insightful information, employees in an organization should be able to make better decisions, and this will lead to improvement of individual productivity. The chosen variables are beneficial to the individual study because, by helping individual employees in making effective decisions in their daily work, the employee’s productivity could be increased, and ultimately, their job performance could be improved. The following hypothesis is proposed:
Organizational performance
SOA-based BI architecture can deliver greater acuity and focus on analytics and the insights in a daily changing competitive dynamics business environment. The proper use of an SOA-based BI architecture can help an organization to achieve competitive advantages such as cost savings, time savings, expanded markets, incremental additional sales reduced search costs, improved business processes, increased competitive position, organizational cost staff requirement, cost reduction, overall productivity, improved outcomes or outputs, increased e-government capacity, improved business process change, increased revenue (Chung et al., 2009; DeLone & McLean, 2003; Sedera & Gable, 2004; Xu & Hwang, 2008). As such, this study research chose “cost reduction,” “overall productivity,” and “business processes” to measure organizational performance. The chosen variables are beneficial to organization study in terms of cost reduction, which further leads to the increment in overall productivity and improved business processes in organizations.
In short, BI architecture system quality factors help foster cooperative relationships based on organizational operational and organizational performance construct, which are critical to better system quality, particularly among the IT practitioners. Figure 1 exhibits these relationships among organizational operational construct, organizational performance construct, system quality, individual performance, and organizational performance. Four positive relations are hypothesized among the two constructs. Related to these research questions and a review of literature, the following hypothesis are developed to examine the relationships among the constructs:
Based on the previous stated hypotheses, Figure 1 depicts our proposed research framework.

Research framework.
Method
Sampling and Data Collection
The data were collected primarily by means of a web-based survey. A list of 1,912 companies was selected randomly from the Malaysian Employer Federation (MEF) mailing list of the organization. MEF is the central organization of private sector employers in Malaysia, which was established in year 1959 to promote and safeguard the rights and interests of employers in Malaysia. Then, invitation emails with a cover letter and the hyperlink to the survey website were delivered to the companies. The head of IT departments, IT or IS managers were the targeted candidates to interpret the successes of their BI architecture. The questionnaires were distributed to IT practitioners (i.e., IT managers/IS managers/IT executives/IT Project managers) in those companies, who appeared to be most relevant in this study. They can provide an objective view in identifying the factors influencing the system quality of SOA-based BI architecture. Reminder emails were sent again after 1 week. For those unresponsive companies, questionnaires were then mailed to the potential respondents along a cover letter, a copy of questionnaire, and a pre-paid returned envelope. As a result, a total of 61 responses were received, and one of them was found not usable. The sample size of 60 was deemed sufficient based on the recommendation for the PLS method according to the recommendation of Chin and Newsted (1999).
Measurement Instrument
The survey instrument was developed based on a thorough review of both academic and practitioner literature. Forty-four items were used to capture the independent variables (i.e., organizational operational construct and organizational performance construct) under investigation in this study. Responses to the items were made on a 6-point Likert scale ranging from 0 = not applicable, 1 = strongly disagree to 5 = strongly agree.
Results
Respondent Demographic Profiles
Table 3 shows the demographic profiles of the respondents. The respondents are generally well educated (21.66% are at certificate/diploma level, 66.67% are bachelor degree holders, 11.67% are postgraduate degree holders). More than half (61.66%) of the respondents’ companies have completed BI implementation between the last 2 to 5 years. The majority of the respondent consists of IT practitioners who are holding IT managerial positions in their organizations. Thus, they were able to provide the favorable answers related to organizational performance. The results show that most of the respondents surveyed have been using BI for a reasonable period of time. They are well educated and knowledgeable in BI field, and therefore, they were able to provide well-judged answers related to the individual performance.
Characteristics of the Study Sample (N = 60).

Note. BI = Business Intelligence; IT = information technology.
Factor Loadings and Reliability (First Estimation) With Original 44-Items.

Note. CR = consistency reliability; AVE = average variance extracted.
Data Analysis
The data were analyzed using the PLS-SEM method (Ringle, Wende, & Will, 2005) for research model validation and hypotheses testing. The three main reasons why PLS-SEM was applied to the structural model estimation are as follows::
PLS has the ability to handle both formative and reflective factors (Chin, 1998),
PLS enforces minimal restrictions on sample size, and
PLS is an appropriate approach for an exploratory approach since it is favorable in the initial development assessment phase of theory building (Julien & Ramangalahy, 2003).
Measurement Model Assessment
Measurement model assessment is supported by the assessment of internal consistency by discriminant validity, composite reliability, convergent validity by average variance extracted (AVE), and indicator reliability by outer loadings. It must have denoting outer loadings to keep an item in the measurement model. Higher outer loadings demonstrate the commonality among the measuring indicators. Indicator reliability relates to the outer loadings of the indicators in measuring the constructs. An accepted criteria for outer loadings of the indicators is expected to be 0.70 or higher. According to Hair, Ringle, and Sarstedt (2013), indicators with values between 0.40 and 0.70 are occasionally retained due to their bestowal to content validity. Indicators with outer loadings below 0.40 are not to be applied, and thus these indicators are cut out from scale (Hair, Ringle, & Sarstedt, 2011). Figure 2 depicts the measurement models with the outer loadings above the threshold value of 0.4.

PLS-SEM results.
The indicators with low loadings (<0.5) were removed to improve AVE values of the scales. Second reestimation was performed by removing items with outer loading values below 0.50. Table 5 depicts results of the second reestimation. Table 6 depicts the summary of the reestimation and AVE after data cleansing.
The Outer Loadings of All of the Reflective Constructs After Second Reestimation.

Note. CR = consistency reliability; AVE = average variance extracted.
Summary of the Reestimation and AVE After Data Cleansing.

Note. AVE = average variance extracted; DI = individual performance; GI = organizational performance; LF = operational construct; PF = performance construct; SQ = system quality.
The estimation of the reliability based on intercorrelations of the observed item variables is measured by internal consistency reliability (CR). CR is used to confirm how well a construct is measured by its delegated indicators.
According to Hair et al. (2011), the acceptable values of composite reliability were at least 0.6 at the early phase of research. Even though composite reliability should be 0.7 or higher, it is acceptable at the early phase of research (Hair, Ringle, Ringle, & Mena, 2012). However, for an exploratory research, Bagozzi and Yi (1988) state that 0.6 or higher is acceptable. Table 5 depicts the degree to which the construct indicators indicate the latent construct—the CR values between 0.775465 and 0.949688, which go over the limit of the recommended value of 0.7 (Hair et al., 2012).
The AVE value of 0.50 or higher is desired to assure that the construct elucidates more than half of the variance of its indicators (Hair et al., 2013). Table 4 depicts the results of the first reestimation. The Cronbach’s alpha and composite reliability values are well above the threshold of 0.6 and 0.7, respectively except AVE for “organizational operational construct” (0.370096) and “performance factor” (0.280231) scales.
The indicators with low loadings (<0.5) were removed to improve AVE values of the scales. Second reestimation was performed by removing items with outer loading values below 0.50. Eight items with outer loadings below 0.50 were deleted during the second round of item deletion. Two items (L03, L09) from “organizational operational construct,” and six items (E01, E04, E07, E09, E10, E11) from “performance factor” were deleted. Table 5 depicts results of the second reestimation. The results of the study revealed that the values of Cronbach alpha and composite reliability to test the reliability and validity of the constructs are well above the threshold of 0.6, respectively, as depicted in Table 5, and thus, construct reliability is achieved.
The values of AVE are used to test whether the convergent validity of the constructs are well above the threshold of 0.5 except AVE for “organizational operational construct” (0.428948) and “performance factor” (0.367344) scales as depicted in Table 5, and thus, convergent validity is achieved.
The next assessment is to evaluate the discriminant validity for reflective models. Discriminant validity is the magnitude to which the measures do not reflect other variables, and it is indicated by low correlations between the measure of concern and the measures of other constructs. The results of the Fornell and Larcker (1981) criterion show that the square root of AVE for the constructs is larger than other inter-constructs’ correlation value. Table 7 shows that all items on the square roots of AVE are greater than the items in interrelated rows and columns. Consequently, the results show that all constructs in the model comply with the discriminant validity criterion. As a conclusion, discriminant validity is attained in this study.
Discriminant Validity.

Note. The bold faced values indicate the square root of AVE for the constructs. Diagonal elements are the square root of the AVE of the reflective scales while the off diagonals are the squared correlations between constructs. DI = individual performance; GI = organizational performance; LF = operational construct; PF = performance construct; SQ = system quality; AVE = average variance extracted.
p < .05.
Structural Model Assessment
The causal relationships among the constructs is measured by the structural model via the estimation of the path coefficients. The value of R2 is used to determine the predictive power of a model. Collectively, the R2 and path coefficients (loadings and significance) indicate how well the data support the hypothesized model (Chin, 1998).
Figure 2 shows the structural model with R2 value, t-values, and path coefficients. The T-statistics in Table 8 are used as a guide of whether to accept or reject our research hypothesis. Overall, the hypotheses testing results revealed significant influence of the organizational operational construct (LF) and performance construct (PF) on the system quality (SQ) of SOA-based BI architecture. The results also revealed that there is a significant influence of system quality (SQ) on individual performance (DI) and organizational performance (GI). Performance factor is found to have strong impact on system quality followed by organizational operational construct. A closer examination revealed that performance factor was the key predictor of system quality, which possesses strong individual performance and organizational performance.
Summary of the Structural Model.

Note. LF (organizational operational construct) →SQ (system quality). PF (organizational performance construct) →SQ (system quality). SQ (system quality) →DI (individual performance). SQ (system quality) →GI (organizational performance).
p < .05 (>1.96). ***p < .01 (>2.58).
Table 8 summarizes the results of hypotheses testing by presenting the path coefficient and t-statistics for each causal effect. Table 8 depicts that all the paths with t-value higher than minimum cut-off value, that is, 1.645 are at significance level = 1 percent (Hair et al., 2011), and the results imply that all the hypothesized path relationships among the constructs are found statistically significant, and its standardized path coefficient is higher than 0.1. The organizational operational construct (b = 0.1195, p\0.05) was positively related to system quality (LF→SQ), performance factor (b = 0.4564, p\0.05) was positively related to system quality (PF→SQ), system quality (b = 0.8238, p\0.05) was positively related to individual performance (SQ→DI), and system quality (b = 0.7748, p\0.05) was positively related to organizational performance (SQ→GI), explaining 27.5% of the variance, thus supporting H1, H2, H3, and H4 of this study. By inspecting through each row in Table 8, the inner model suggests that PF has the strongest effect on system quality (0.422), followed by the organizational operational construct (0.113), while system quality has the strongest effect on individual performance (0.824), than organizational performance (0.775).
The R2 values of 0.67, 0.33, or 0.19 for endogenous latent variables in the inner path model were described as substantial, moderate, or weak by Chin (1998). The results of structural path assessment are presented in Figure 2 where the R² of the endogenous latent variable (SQ) is 0.275, which is moderate than the cut-off value, and hence, the model lies at the satisfactory level. Figure 2 shows that the R2 value for the endogenous latent variables’ individual performance (DI) was 0.679 and the organizational performance (GI) was 0.600, which is considered as substantial.
Another important criterion to assess the structural model is the estimation of the path co-efficient. The estimated values for path relationships in the structural model should be evaluated in terms of sign and magnitude. In assessing the path co-efficient, the beta value of all structural paths is compared, the higher the path co-efficient has a more significant effect on endogenous latent variable. Figure 2 and Table 6 show that PF (performance factor) has the highest coefficient value of 0.4564. That means the performance factor shares high value of variance and have strong effect on system quality. The second major construct affecting system quality is LF (organizational operational construct) with a path co-efficient of 0.1195.
PLS-SEM was applied to perform CFA due to its flexibility of simultaneous assessment for both the measurement model and structural model (Halawi & McCarthy, 2008). However, there is no requirement of exploratory factor analysis (EFA) before applying CFA as there are no commonly recognized decision rules and further discussion about the merited use of the two approaches (Crowley & Fan, 1997; Hurley, Scandura, Brannick, & Vandenberg, 1997). One of the objectives of using an EFA is to drop or to reduce the number of items having low factor loading and redundant items from a defined pool of items in the questionnaire, and this process has been done in this study. The items with low loadings (<0.5) were dropped in order to improve the AVE values of the scales as shown in Tables 4 and 5.
Discussion
This study examines the impact of a firm’s operational and organizational performance construct on SOA-based BI architecture. The results depict that all the paths retrieved t-values higher than the minimum cut-off value, that is, 1.645 at significance level = 1% (Hair et al., 2011). The organizational operational construct (b = 0.1195, p\0.05) was positively related to system quality (LF→SQ), organizational performance construct (b = 0.4564, p\0.05) was positively related to system quality (PF→SQ), system quality (b = 0.8238, p\0.05) was positively related to individual performance (SQ→DI), and system quality (b = 0.7748, p\0.05) was positively related to organizational performance (SQ→GI), thus supporting H1, H2, H3, and H4 of this study.
The overall findings revealed that the organizational operational construct and organizational performance construct have a positive and significant influence on SOA-based BI architecture. The analysis results of this study revealed that organizational operational construct and organizational performance construct have a positive impact on BI system quality in terms individual performance (effective decision making, individual productivity, and job performance) and organizational performance (cost reduction, overall productivity, and business processes). Thus, BI architect, BI software vendor, and IT practitioners should pay more attention to the organizational operational construct (deployability, commonality, openness, and single open API) and organizational performance construct (response time, throughput, availability, and scalability), respectively, during the design and implementation of SOA-based BI architecture. Thus, H1 is supported.
The possible interpretation for these results could be due to the capability to deliver a common single view of the business, which is critical to data validity for various types of users in an organization especially for those organizations with many data assets, applications, and types of user. Common user interface that uses simple web gestures should be available for accessing a broad range of BI content. The same piece of result should be available across the board for different types of users and across a wide range of technologies from traditional desktop environment to handheld mobile devices. The availability of the metadata layer can help drive global deployments with multilingual support. The deployment of the BI architecture has to be a simple activity via a single tool, for example, browser and without the need to download extra plug-ins and applets. Application programming interface (API) allows to integrate BI into other applications and systems, and vice versa. A single API covering all BI capabilities is especially important without compromising application functionality or time to market. A single interface to deliver all the BI capabilities is essential. Massive functionalities should be continually fully accessible through the use of Web services via single open APIs. Thus, H2 is supported whereby the organizational performance construct is found to be significant that it influenced the quality of SOA-based BI architecture.
The organizational operational construct consists of factors such as response time, throughput, availability, and scalability. Response time, throughput, availability, and scalability are found to have a positive and significant relationship with system quality. The results were found consistent with previous studies (Dong et al., 2008; Meier, 2009; O’Brien et al., 2007; Rotem-Gal-Oz, 2009). Sukardja (2005) addressed the scalability and availability system quality factor requirements in a BI deployment. Due to the sheer volume of data, enterprise scale BI architecture in large organizations might facing the problem of slow response times. The response time in supporting for many operational and strategic queries simultaneously in a mixed workload environment can cause a performance issue. Enterprise-scale BI architecture is used to handle the massive volumes of incoming user requests; it is critical that the architecture be able to handle it in an optimal performance with aid of load balancing. In the load balancing mechanism, the incoming requests are routed to any specific server in the configuration by the dispatcher referring to the request’s likeliness level. The use of OLAP sources can reduce response times dramatically since the data are already calculated and aggregated for powerful analysis and reporting. Caching more queries automatically in a longer, internal, cube cache-clearing method can reduce response times for subsequent report queries from the same user or subsequent users. During the configuration of an enterprise-scale BI system, the optimal routing of requests should be automated for routing to the appropriate server to achieve higher throughput. The optimal routing of requests is the job of the dispatcher, and the dispatcher is a multithreaded application that runs on web application server or servlet container. As the demands of BI grow in scope and sophistication across an organization, the architecture must remain responsive. BI users could encompass internal or even external users via extranet in an organization. To meet the needs of these users, a BI architecture must be highly scalable. Therefore, the architecture must ensure high availability with minimal down time. H3 is supported whereby the results revealed that system quality has a positive impact on the individual’s performance in terms of effective decision making processes, improved individual productivity, and better job performance.
The results are found consistent with the previous findings by Sedera and Gable’s (2004) and Xu and Hwang’s (2008) studies. The results in H4 revealed that system quality has a positive impact on the organization’s performance in terms of cost reduction, increment of organizational overall productivity, and business processes enhancement. Previous studies (Chung et al., 2009; Sedera & Gable, 2004; Xu & Hwang, 2008) also provided consistent results that system quality has positive organizational performance.
The other insight from this study is that the organizational performance construct was found to be the strongest predictor having the strongest effect on system quality (0.422), followed by organizational operational construct (0.113). Hence, the organizational performance construct was found to be the more dominating factor than the organizational operational construct in improving the system quality of SOA-based BI architecture. One of the possible interpretations for this result would be that the performance is always the issue especially in a mixed workload environment. The capability to support simultaneously operation queries and strategic queries in an optimal response time is critical. The BI architecture has to support scalability to meet the ever-increasing needs of the business challenges.
Conclusion
Theoretical Implications
This study contributes to research in several ways. First, there was a lack of study in the area of SOA-based BI architecture system quality. Thus, the findings of this study not only contribute to the literature of BI architecture quality study but also offer a new perspective of appreciating BI architecture quality from the aspect of Delone and Mclean’s IS success model. Besides, this study can serve as the foundation in developing a list of operational knowledge assets that provides a mutual understanding of the quality constructs of SOA-based BI architecture in addition to their impacts on the individual and organizational perspective. Second, this study methodologically provides a systematic step-by-step approach in the determination of the impacts of independent variables’ (organizational operational constructs and organizational performance constructs) influence to the independent variables (system quality) that is being evaded by researchers and practitioners. With the application of PLS, this study also offers a vital contribution to the methodology development in existing knowledge and literature.
Practical Implications
The study contributes to practice too. First, the results provide a snapshot list of factors that have a significant influence on BI architecture quality and as a motivator to guide organizations to further improve their BI architecture quality. In addition, the identified constructs for SOA-based BI architecture quality provides a clearer understanding for the decision makers to concentrate on the important factors that influence the SOA-based BI architecture quality in organization. This study also significantly contributes to practice and management by highlighting the constructs that need mitigation during the design and implementation of BI architecture. Second, the findings lay the foundation in helping BI software vendors, BI architects, or any IT practitioners to design and implement a better BI architecture particularly in the context of the service-oriented concept. Third, organizations need to pay special attention on improving the system performance from the response time, throughput, availability, reliability, and scalability aspects.
Limitations
In terms of limitations, the sample population of this study is limited to the IT practitioners in Malaysia. Future research could include respondents from other countries. The second limitation is that this study did not consider the effects of mediating or moderating variables on the relationship between independent and dependent variables. Future studies may include and address variables such as knowledge sharing (mediating) or technological uncertainty (moderating) in addition to the current model.
Footnotes
Declaration of Conflicting Interests
The author(s) declared no potential conflicts of interest with respect to the research, authorship, and/or publication of this article.
Funding
The author(s) received no financial support for the research, authorship, and/or publication of this article.