
Abstract
Social media offers scholars new and innovative ways of understanding public opinion, including citizens’ prospective votes in elections and referenda. We classify social media users’ preferences over the two U.S. presidential candidates in the 2016 election using Twitter data and explore the topics of conversation among proClinton and proTrump supporters. We take advantage of hashtags that signaled users’ vote preferences to train our machine learning model which employs a novel classifier—a Topic-Based Naive Bayes model—that we demonstrate improves on existing classifiers. Our findings demonstrate that we are able to classify users with a high degree of accuracy and precision. We further explore the similarities and divergences among what proClinton and proTrump users discussed on Twitter.
For decades scholars have turned to surveys to understand public opinion, particularly in the context of citizens’ vote choice. Surveys have real advantages; they offer insight on a host of political attitudes and beliefs, they allow one to explore how and why respondents hold certain views, and they have been shown to often be valid predictors of election outcomes. At the same time, surveys are not without limitations: for example, the designs are typically static in nature, respondents may offer poorly informed or misinformed responses, or the issues being probed may not correspond to those citizens truly care about. Even the costs of implementation can be prohibitive in many electoral contexts. Researchers in recent years have recognized the utility of assessing public opinion in new and previously unavailable ways, especially through modern information technologies such as social media. Posts on social media sites are by their very nature contemporaneous and dynamic, and they reflect an interested and engaged public’s view across a diversity of topics that citizens care about. 1 Social media can open channels for political expression, engagement, and participation (Tucker, Theocharis, Roberts, & Barberá, 2017).
Of course, analyzing public opinion through the lens of social media presents its own unique set of challenges. First, scholars have noted that posts on sites such as Facebook, Twitter, and Snapchat are typically unrepresentative of the views of the population as a whole (Barberá & Rivero, 2014; Beauchamp, 2016; Burnap, Gibson, Sloan, Southern, & Williams, 2016) particularly in comparison with surveys where random sampling is a strength. At the same time, if researchers are especially interested in the expressed views of an engaged and active audience, posts on sites social media have a particular value. And, it is on social media where scholars can well study the intensity of opinion, as citizens post on issues and ideas that interest them, expressed in their own way. A second challenge relates to the very nature of social media—its infrastructure and affordances. Sites such as Facebook, for example, allow for long posts and subposts for discussion. Information conveyed on Facebook can be useful in a myriad of ways: even revealing users’ ideology (Bond & Messing, 2015). At the same time, many Facebook users protect the privacy of their posts. Posts on Twitter, on the other hand, are (most often) public, 2 although character restrictions on the length of tweets mean that posts will not only be short but also frequently adopt unconventional language including abbreviations and hashtags that can complicate interpretation. 3 Third, social media conversations are text-based and are typically absent a readily identifiable signal of vote choice or preference, and thus more challenging to interpret.
Here, we take advantage of hashtags that signal vote choice to mitigate some of these concerns, training a classifier based on the content of tweets from users who signified their candidate preference via the consistent use of certain hashtags. Because hashtags serve as a convenient means for users to catalog a post as germane to a given topic and because users invoke hashtags often, researchers can rely on hashtags to probe conversations and topics of interest. Moreover, certain hashtags can even convey user preferences or political attitudes over a given issue or candidate. For example, in the lead up to the 2016 election, a user invoking the hashtag #VoteTrump signals their preference for a candidate. 4 Similarly, #AlwaysHillary indicates support for Hillary Clinton.
The aims of our study are several. We turn to a new data source, our own collection of approximately 29.5 million publicly available tweets related to the 2016 U.S. presidential election, to assess support for the presidential candidates on the Twitter platform. We train a machine learning classifier on the tweets of those users who adopted hashtags that signaled their support for a particular candidate, and then we apply our classifier to understand the viewers of a much larger audience. We validate our classifier with a study for a subset of Twitter users, evaluating the “vote” label of our classifier against Crowdflower workers’ assessment of which candidate a given Twitter user preferred. Of course, our goal is not to predict the election outcome, as we recognize that social media users are not representative of the U.S. voting population, but instead to understand public support for the respective candidates on Twitter. 5 Our second and closely related task is to explore the topics of discussion among social media users supporting Donald Trump and among those supporting Hillary Clinton. We look to see what types of topics were invoked, and whether we see similar or divergent issues and themes from these two communities. Thus, we offer a novel means of understanding public conservations during an important election. Taken together, our aim is to understand the vote preferences of Twitter users and the topic discussions among supporters of the two candidates. Our analysis offers new perspectives on public opinion—candidate support and topics of conversation—in the 2016 election.
To address our twofold research question, we introduce to the social science literature a novel method: a Topic-Based Naive Bayes (TBNB) classifier that integrates Latent Dirichlet Allocation (LDA) topic models within a Naive Bayes classifier framework (Fang, Ounis, Habel, MacDonald, & Limsopatham, 2015). We show that the TBNB classifier outperforms others, and it also provides leverage in understanding topics of conversation on Twitter. The application of our TBNB proceeds in several steps. We begin by locating Twitter users who adopted certain hashtags consistently over time—hashtags that signaled support for either Donald Trump or Hillary Clinton. These users’ tweets represent our ground truth data. From these users’ tweets, we remove the respective hashtags to train a classifier on the remaining text of the tweet. Once removed, we employ a set of machine learning classifiers, including our TBNB, to determine whether we can with accuracy and precision classify the vote signal, the hashtag. We compare the performance of several classifiers against one another using standard evaluation metrics, finding TBNB to outperform the others in our training data. Given our high degree of success, we then apply our trained TBNB classifier to our “unseen data” to understand candidate support across a much wider and indeed massive audience—drawing on commonalities in the content of tweets among our labeled hashtag users in our training data and among users in our unseen data to assess overall levels of candidate support on Twitter. We evaluate the classification of our unseen data, the out-of-sample performance, with a Crowdflower study of a subset of Twitter users. We then move to understanding the topics of discussion surrounding the 2016 election within the two communities: those supporting Donald Trump and those supporting Hillary Clinton. Did Clinton supporters and Trump supporters discuss the same issues? Or did they diverge in their conversations? In answering these questions, we shed light on the relevant topics associated with candidate support. As a final virtue, our methodology is flexible and can be translated well to other electoral contexts—local, state, and other federal elections within the United States and indeed democratic elections and referenda in all parts of the world.
Context
Our work builds on a rich literature on the utility of Twitter in elections, including the ways in which citizens communicate on the platform and the degree to which tweets can be used to understand vote choice and even electoral outcomes (see, for example, Burnap et al., 2016; Jungherr, 2016; McKelvey, DiGrazia, & Rojas, 2014). In one notable example of the latter, when utilizing state-level polling data in conjunction with Twitter data, Beauchamp (2016) demonstrates that Twitter textual features can be deployed effectively to understand the dynamics of public opinion and vote choice during the 2012 election cycle. In an overview of the literature on social media and elections, Jungherr (2016) notes that politicians do look to Twitter as a means of gauging citizens’ interest and public opinion.
The 2016 U.S. presidential election represents a particularly unique and important context for our study. Both the public and scholars alike recognize the novelty of the first female major party candidate with a rich political history running against a celebrity without prior elected experience and with a reputation for “telling it like it is.” Indeed, it was clear throughout the summer and fall of 2016 that the two candidates presented markedly different visions for their administrations. Not surprising, then, and as we will show, the conversations on social media platforms by the communities of support were numerous and diverse in nature. Tweets covered topics including missing emails, media bias, the Federal Bureau of Investigation (FBI) and Comey, racism, border walls, and more. And as we will show, the nature of discussions and the appearance of topics within a community evolved over time, with new events and revelations triggering new dialogue online.
Twitter User Classification
Our work is focused on understanding users preferences for the candidates and, importantly, the topics of conversation within proClinton or proTrump communities. Our approach both parallels and builds on that of Fang et al. (2015) who utilized a TBNB classifier to assess support for independence in Scotland during the 2014 referendum. To give the historical background for that election, on September 18, 2014, voters in Scotland were given the opportunity to decide their country’s future—whether they wished for Scotland to be independent from the United Kingdom or to remain together with England, Wales, and Northern Ireland. The referendum ballot raised the question matter-of-factly: “Should Scotland be an independent country?” with voters given two straightforward response options, “Yes” or “No.”
The goals of the previous study were similarly both to understand social media user’s preferences for Yes or No, and second, to explore the topics of conversation during the 2014 Independence Referendum among pro and anti-Independence communities. To obtain the ground truth data, the foundation from which their machine learning classifier was built, Fang et al. (2015) relied upon users who employed the following hashtags in consistent ways over time—hashtags that were interpreted by the researchers as definitive signals of vote choice:
#YesBecause, #YesScotland, #YesScot, #VoteYes
#NoBecause, #BetterTogther, #VoteNo, #NoThanks
To be clear, Fang et al. (2015) labeled a social media user as a “Yes” supporter in the 2014 IndyRef if he or she exclusively used one or more of the hashtags in the above “Yes” set during the 2 months leading up to the September referendum. Similarly, if a user used only those hashtags in the “No” set during the same 2-month period, he or she was labeled as a “No” voter. The project excluded those users who at any point during the 2 months leading up to the referendum offered any single tweet that included hashtags in both sets Yes and No. 6 Users who blended hashtags or who did not incorporate them were left unlabeled.
The use of the hashtags above served as the ground truth in the model—the marker assumed to be a valid indicator of a Twitter user’s preference for independence. With this ground truth in hand, Fang et al. (2015) implemented a TBNB classification task on the text of the tweets, after excluding from the tweets the relevant hashtags markers above. The classifier applied LDA to extract discussed topics on the 2014 referendum from tweets, and then it leveraged Navies Bayes to construct word probabilities conditional on both classes—“Yes” and “No” communities. 7 The authors demonstrated that they could, with high levels of success, identify social media users’ community of support (pro Independence or not) using this approach.
Moreover, the successful application of TBNB to the users in the ground truth dataset suggested that one can train a classifier to assess “Yes” and “No” support a much wider and indeed massive audience. For example, the patterns of language use for a tweeter who advocated for independence—but often included hashtags of the opposition so as to extend the reach of the tweet or even to troll the opposition—can be used to recognize such a user as a Yes supporter.
Similarly, we identify a set of hashtags signaling vote preference during the 2016 U.S. presidential election, and we then apply the TBNB classifier to assess support on both training data and unseen data, and we finally use topic modeling to extract topics of discussion by proTrump or proClinton communities. We begin with locating users who incorporated hashtags into their tweets in a consistent fashion over the period leading up to the November election, which form ground truth labels with the hashtags in Table 1. As one can see from the list below, our chosen hashtags signal support in clear ways—and moreover, the hashtags were widely adopted by users during the election to ensure a large training dataset.
Hashtags to Label Users.

Again to be clear, to be included in the ground truth dataset, users across the 3-month period of analysis leading up to the November 8 election could blend hashtags within either the proClinton and proTrump sets above, but they could not ever blend hashtags across these sets. 8 Following Fang et al. (2015), after labeling users as proClinton or proTrump, we take advantage of the fact that users tweet additional textual content beyond hashtags. Our twofold assumption is that there is meaningful textual information conveyed in tweets (beyond hashtags) that can be used to assess support for a given candidate and understand the topics of conversation by respective candidate communities, and that the TBNB classifier can learn such patterns and word usages. We thus strip the tweets of the hashtags that allowed us to label users as proClinton or proTrump (Table 1) to classify users into proClinton and proTrump communities using the textual features of their tweets. Our results show that we are able to do so with a high degree of success. We then apply this classifier to the larger, unseen data, to determine overall support for Clinton and Trump on the Twitter platform.
Methodology
Figure 1 shows the components of our research design. We first collect both our training and our unseen social media data. 9 Next, using the hashtag labeling method, we described above in section “Twitter User Classification,” we train our candidate community classifier to determine whether a given Twitter user supported Hillary Clinton or Donald Trump, as described in subsection “Community Classification.” Note that our classification task is at the user level, not at the tweet level. In subsection “Crowdflower User Study of Twitter Users’ Candidate Preferences,” we describe the methodology for validating the application of our classifier on the unseen data through a Crowdflower user study comparing our machine learning classification to Crowdflower worker’s evaluation for a subset of 100 Twitter users. Finally, the methodology for extracting the discussed topics in tweets from the proClinton and proTrump communities is discussed in subsection “Topic Modeling of the Unseen Data.”
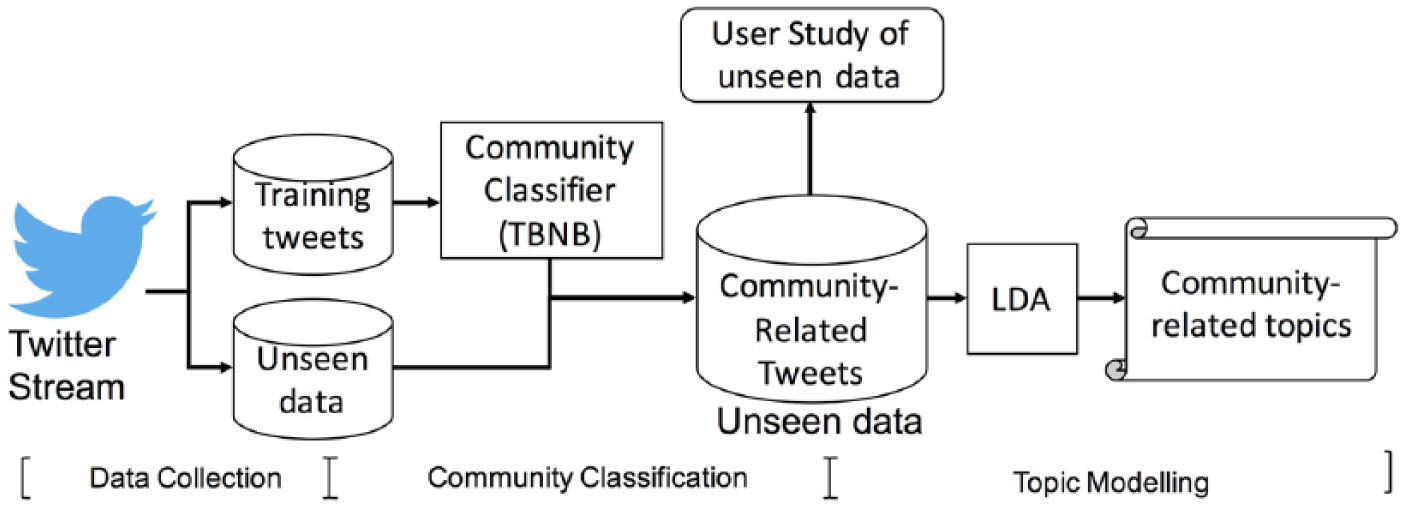
Components of the analysis.
Data Collection
We begin by collecting a Twitter dataset with a sample of tweets posted in the United States within a 3-month period leading up to the election, from August 1 to November 8, 2016—election day. This Twitter dataset is crawled using the Twitter Streaming API 10 by setting a bounding box to cover only the area of the United States. 11 We collect roughly 1.5 million tweets per day. 12 From this data collection of tweets and respective users, we divide our data into training and unseen data. We note that it is possible that tweets posted from Twitter bot accounts are included in both our training and unseen data.
Training data
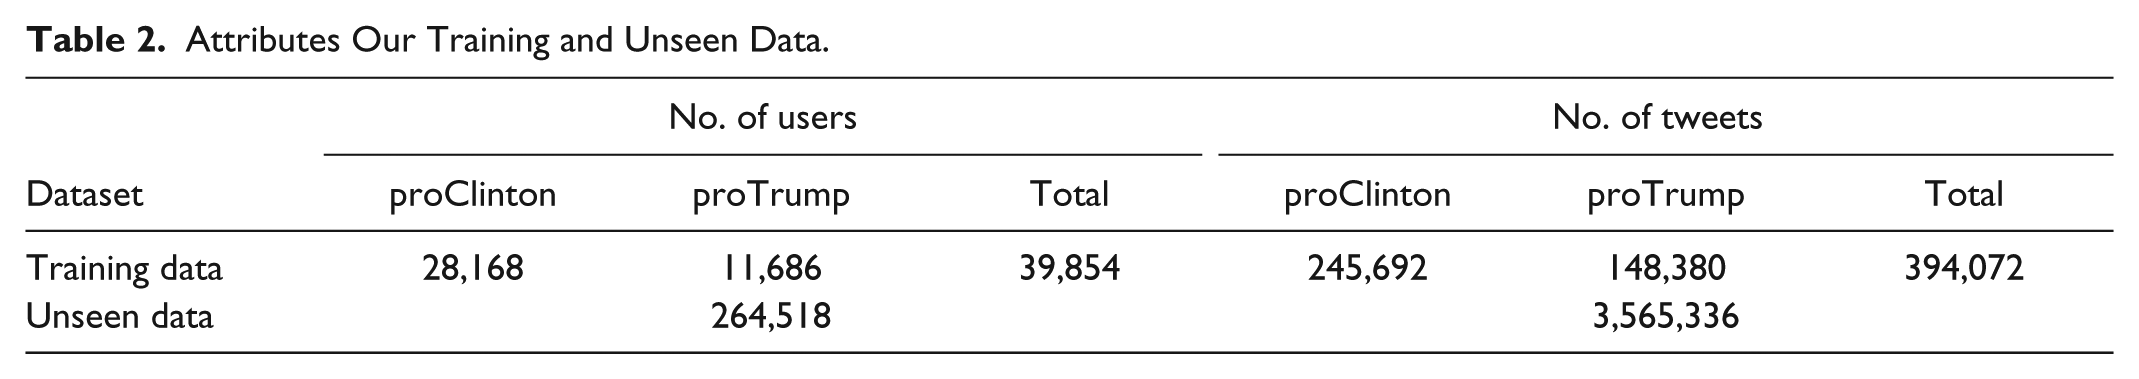
We use the hashtag labeling method described in section “Twitter User Classification” to obtain our training data (i.e., the ground truth data) for the proClinton and proTrump community classification. From the proClinton and proTrump hashtags, we obtain a training dataset containing 39,854 users who produce 394,072 tweets, as shown in Table 2. Again, the Twitter users in the training data used either the proClinton or proTrump hashtags listed in Table 1 and thus can be readily labeled as members of these two communities. Note that retweets are not included to avoid labeling a user according to someone else’s original content. Our labeling method results in 28.1k users in the proClinton community who author 245.6k tweets, and 11.6k users in the proTrump community who tweet 148.3k times, as seen in Table 2. One can see that the proClinton community is larger than the proTrump one in our training data.
Attributes Our Training and Unseen Data.
Unseen data
For our unseen data, we collect tweets in the 3 months leading up to the 2016 elections—tweets containing either keywords or hashtags (or both) that we consider election-related. For example, we have tweets with words or hashtags such as “Trump” 13 or “Hillary” or “Clinton” or “debate” or “vote” or “election.” 14 We then collect all the tweets from all users who authored at least four tweets that used such hashtags. 15 In total, then, we have 264,518 users with 3,565,336 tweets in our unseen data, as shown in Table 2. To be clear, to be included in the unseen data, each tweet must include an election-related keyword or hashtag, and each user must have authored at least four such tweets. Our unseen data are of course much larger than our training data, given that our training data includes only users who used hashtags consistently and their respective tweets. The candidate preference of Twitter users in our unseen data is what we aim to determine.
Next, we explain how we use our training and unseen data. As different datasets are used in the following sections, we list the usage of the datasets in their respective sections in Table 3. The training data is used for training a set of classifiers as described in subsection “Community Classification,” and the performance of the classifiers are reported in subsection “Results of classification for the training data,” where we show the TBNB outperforms the others on the training data. The subsection “Community Classification” also describes the community classification for our unseen data. We describe the design of our Crowdflower user study that speaks to how well our TBNB classifier performs on labeling the candidate preferences of users in our unseen data in subsection “Crowdflower User Study of Twitter Users’ Candidate Preferences,” thereby assessing the out-of-sample performance of the classifier. We describe how we conduct the topic models for the unseen data by proClinton and proTrump communities in subsection “Topic Modeling of the Unseen Data.” Results related to the unseen data are reported in subsection “Vote preferences of unseen Twitter users” showing overall levels of support for the two candidates on Twitter; subsection “Results of the Crowdflower user study on the unseen data classification” reports the results from the Crowdflower study; and subsection “Topics Extracted From the Unseen Data, proTrump and proClinton Communities” displays the topics of discussion among proClinton and proTrump communities.
The Use of the Training and Unseen Data by Section.

We pause here to note that recent attention has been drawn to the role of fake news and Twitter bot accounts in influencing public opinion, particularly fake news and bots originating from Russia during the 2016 election (Allcott & Gentzkow, 2017; Guess, Nyhan, & Reifler, 2018; Howard, Woolley, & Calo, 2018; Soroush, Roy, & Aral, 2018; Timberg, 2016). To ascertain the presence of Russian bots in our analysis, we turn to a list of 2,752 Russian bot accounts that were identified by the U.S. House Select Committee on Intelligence. 16 We then examine how many tweets from these accounts are present in our training and unseen datasets. We found none of these Russian bot accounts is present in our training data, and a mere 25 tweets from 16 Russian bots are present in our unseen data. Thus, we argue the influence of these identified bot accounts on our analysis is minimal. Our use of a bounding box for our data collection that restricted tweets to accounts within the United States in part explains why we find so few tweets from these Russian bot accounts in our data.
Community Classification
Our first, fundamental goal is classification—that is, we wish to understand whether a given Twitter user supported Hillary Clinton (and ergo is part of the proClinton community in our framework) or whether a user supported Donald Trump (and thus is part of the proTrump community). One could argue that applying classification algorithms to understand the vote preferences of Twitter users is unnecessary, that one could instead look directly at the use of hashtags, URLs (Adamic & Glance, 2005), or employ network models (M. A. Porter, Mucha, Newman, & Warmbrand, 2005). However, most tweets do not contain hashtags or URLs, and Twitter users might not have enough followers/followees to construct effective network models. We argue that classification algorithms improve our understanding of the vote preferences of a large number of Twitter users.
In computational social science, several classification algorithms are often used, among them Decision Tree, Naive Bayes, Support Vector Machine, Neural Networks implemented as C4.5 (Tree), Multinomial Naive Bayes (NB), Linear Support Vector Classification (SVM), and Multilayer Perceptron (MLP) in scikit-learn. 17 Among these, NB, SVM, and MLP have often been used in text classification (see, for example, Fang et al., 2015; Harrag, Hamdi-Cherif, & El-Qawasmeh, 2010; Joachims, 1998; Khorsheed & Al-Thubaity, 2013; McCallum, Nigam, et al., 1998). In addition to these classifiers, we also apply the TBNB classifier explained earlier in section “Twitter User Classification.” 18 For comparison, we deploy a random classifier (RDN), which generates classification results (i.e., proTrump or proClinton) by considering the distribution of classes in the training data. Using multiple classifiers in our analysis allows us to compare and contrast their performance in categorizing users in our training data into proTrump or proClinton communities, including assessing the utility of our TBNB approach against the others.
We applied steps typical in the preprocessing of text data (Grimmer & Stewart, 2013) prior to classification. Steps included removing commonly used words that do not help improve the classification (i.e., English stop-words). We also stemmed the text to root words using a Porter Stemmer (M. F. Porter, 1997).
We use the top-ranked 19 5,000 words in the training dataset as features—the attributes that we rely upon to train the classifiers for use on the unseen data. Each user is translated into TF-IDF vectors for the input of the classifiers. Because we found from our training data that the proTrump community was smaller with 11.6k users than the proClinton community of 28.2k users in Table 2, we apply oversampling to the proTrump community to avoid class imbalance that may bias the learned classification models. To evaluate the performance of our classifiers for each community, we use three standard metrics in information retrieval: Precision, Recall, F1, and Accuracy (Rijsbergen, 1979). Precision is the fraction of Twitter users correctly labeled among all the predicted positive (either proClinton or proTrump) Twitter users, whereas Accuracy is the fraction of correctly classified Twitter users among all Twitter users. Recall is the fraction of Twitter users correctly labeled among all real positive Twitter users. F1 represents the harmonic average of Precision and Recall.
Crowdflower User Study of Twitter Users’ Candidate Preferences
We describe here our Crowdflower user study to evaluate the performance of our TBNB classifier on the unseen data. As we noted in subsection “Data Collection,” our hashtag labeling method provides the ground truth data for the proClinton/proTrump classifier. We can (and do, in Table 4) evaluate the performance of our classifiers in terms of how effectively they place users into proClinton and proTrump communities in our training data. However, in the absence of ground truth/the hashtag labeling method, we cannot evaluate our classifier’s performance on the unseen data. Therefore, we evaluate the out-of-sample performance of our classifiers by comparing it with judgments made by workers on the Crowdflower 20 platform. Here, we ask Crowdflower workers to determine whether a given Twitter user in our unseen data supported Hillary Clinton or Donald Trump (or neither) by looking at the content of the user’s tweets, for a random sample of 100 Twitter users in our unseen data. 21 Thus, we compare the vote classification performance of our classifier to judgments from Crowdflower workers. The interface of this user study is shown in Figure 2.
The Classification Results.

Note. We bold the highest values for reference. RDN = random classifier; NB = Naive Bayesian classifier; SVM = Support Vector Classification classifier; MLP = Multilayer Perceptron classifier; TBNB = Topic-Based Naive Bayesian classifier.
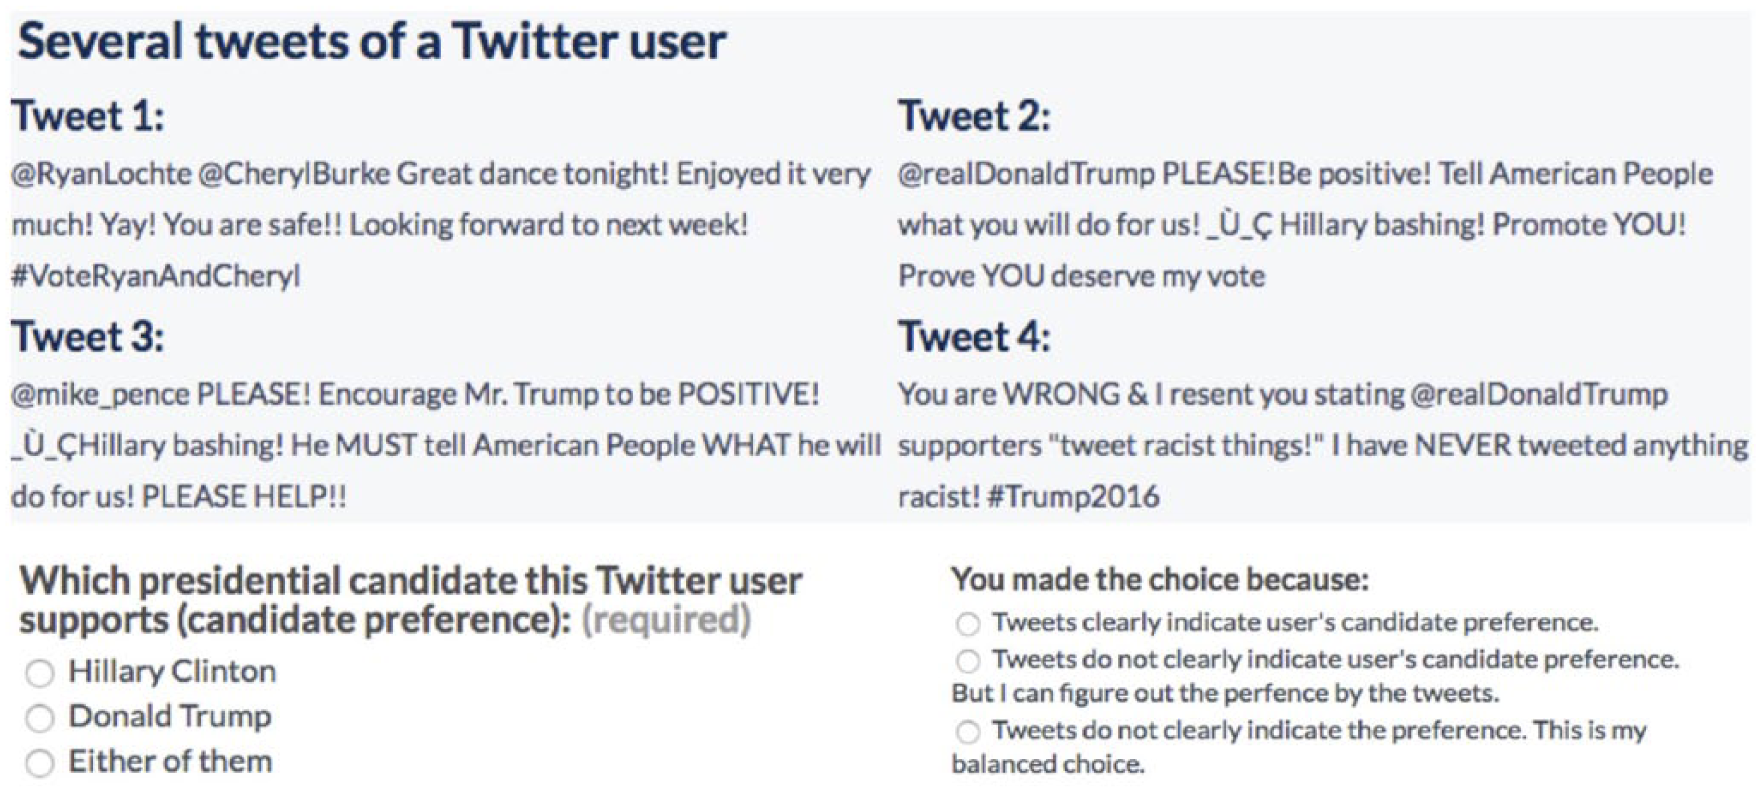
The user interface of the Crowdflower user study.
To begin, we randomly select 100 Twitter users from the unseen Twitter dataset described in subsection “Data Collection.” For each of the 100 selected Twitter users, we present crowdsourced workers with at most eight of their respective tweets selected randomly, as seen in the top of Figure 2. 22 After reading up to eight tweets, a Crowdflower worker is asked to select whether the given Twitter user supports Hillary Clinton or Donald Trump—or if candidate support cannot be determined, as seen in the lower left of Figure 2. To understand how the workers reach their decision, we also ask them to explain their reasoning through three provided choices: (a) “Tweets clearly indicate user’s candidate preference,” (b) “Tweets do not clearly indicate user’s candidate preference. But I can figure out the preference by the tweets,” (c) “Tweets do not clearly indicate the preference. This is my balanced choice.” 23 We obtain three independent judgments of whether each of our 100 Twitter users was proClinton or proTrump, or neither. 24 We report the results of this user study in section 4.
Topic Modeling of the Unseen Data
Our final step is the application of topic modeling to extract topics among the tweets within the proClinton and proTrump communities from the unseen data. Here, a topic is a distribution over words in a topic model, often represented by the Top n (e.g., n = 10) words according to its distribution. For each candidate community, we sample 200k tweets to be used for topic modeling. In this study, we use time-sensitive topic modeling approaches (Fang, MacDonald, Ounis, Habel, & Yang, 2017), as they have been shown to be effective for Twitter data and can speak to the dynamics of when topics are invoked over time. The number of topics selected, known as K, has implications for the coherence of the topics that are extracted (Fang, MacDonald, Ounis and Habel, 2016a): a small K will produce few topics that are difficult to interpret, given that they include many different themes and ideas; whereas, a large K will produce more finite topics but ones that may not differentiate themselves well from one another. To select K, we first set K from 10 to 100, with step 10 to obtain topic models with a good quality. To evaluate the coherence and quality of the resulting topics, we use Twitter coherence metrics developed by Fang, MacDonald, Ounis, and Habel (2016b). 25 We use the average coherence and coherence@n (c@n) to select the appropriate K number to yield more coherent, interpretable topics.
Results & Analysis
We offer two sets of results, first related to classification for both our training data and unseen data in subsection “Performance of the Community Classification,” and next related to the topic modeling by proClinton and proTrump communities in subsection “Topics Extracted From the Unseen Data, proTrump and proClinton Communities.” We first report how successful we are in categorizing Twitter users in our training data as proClinton or proTrump. We show a remarkable degree of success in this task, particularly with our TBNB classifier. By subsequently applying the classifier on the unseen data, we are able to classify a much larger group of Twitter users into the two communities: proClinton and proTrump. Thus, we are able to speak to overall support on the Twitter platform, the “Twitter voteshare” for the two candidates in the 3 months leading up to the election date. Finally, we show the topics of discussion among the proClinton and proTrump communities.
Performance of the Community Classification
In this section, we first show the performance of the classifiers on the training data. We apply our TBNB classifier on unseen data to assess Twitter users’ candidate preferences. We then report the results of our Crowdflower user study, which indicates how well the classifier performed on the unseen data, assessing its out-of-sample performance.
Results of classification for the training data
Table 4 speaks to the results of our classification task by several classification algorithms we employ, including our TBNB. 26 As we described in subsection “Community Classification,” the table compares the performance of the classifier in determining whether a user is proClinton or proTrump based on the textual content of tweets in our training data assessed against the vote preference as revealed by the consistent use of hashtags in Table 1.
From Table 4, we can see that, with the exception of the random classifier (RDN), all of the classifiers exhibit a strong performance on the F1, Precision, Recall, and Accuracy metrics. Clearly, Twitter users in the proClinton and proTrump communities differentiated themselves well from one another, that the language of their tweets was sufficiently distinct so as to be able to classify users correctly as proClinton and proTrump in ways consistent with their adoption of hashtags displayed in Table 1. One can also see from the table that the TBNB classifier achieves the highest accuracy among all the classifiers, 0.851. That is, in 85.1% of instances, the TBNB is able to classify the candidate preference of the Twitter user in our ground truth data accurately—using the textual information in their tweets—devoid of the hashtags in Table 1. To be clear, this result demonstrates that for those in our training data, the text of their tweets provides information that can readily identify Twitter users as proTrump and proClinton, matching the label applied based on the social media user’s use of hashtags.
As we have argued in section “Twitter User Classification,” an added value of the TBNB classifier is also the generation of the topics used in the classification algorithm, which we show in Table 5. The table displays the topics generated from the training data by applying the standard LDA on the training data in TBNB classifier. The listed topics are represented by their Top 10 most frequent words. For a given Twitter user, the TBNB classifier first identifies which topics pertain to the user, and then the classifier assigns the community affiliation, either proClinton or proTrump, to a Twitter user based on his or her word usages within the related topics. In Table 5, Topics 1, 4, and 9 are proClinton topics, whereas Topics 3, 5, and 10 are proTrump. The remaining topics in Table 5 do not have clear polarity. This is not to say, however, that Twitter users from the two community communicate similarly about these topics. As the TBNB classifier can distinguish the word probability conditioned on both topics and communities, it can capture the different word usage of the two communities within a topic to classify a Twitter user’s community.
Topics Generated From the Training Data.

Vote preferences of unseen Twitter users
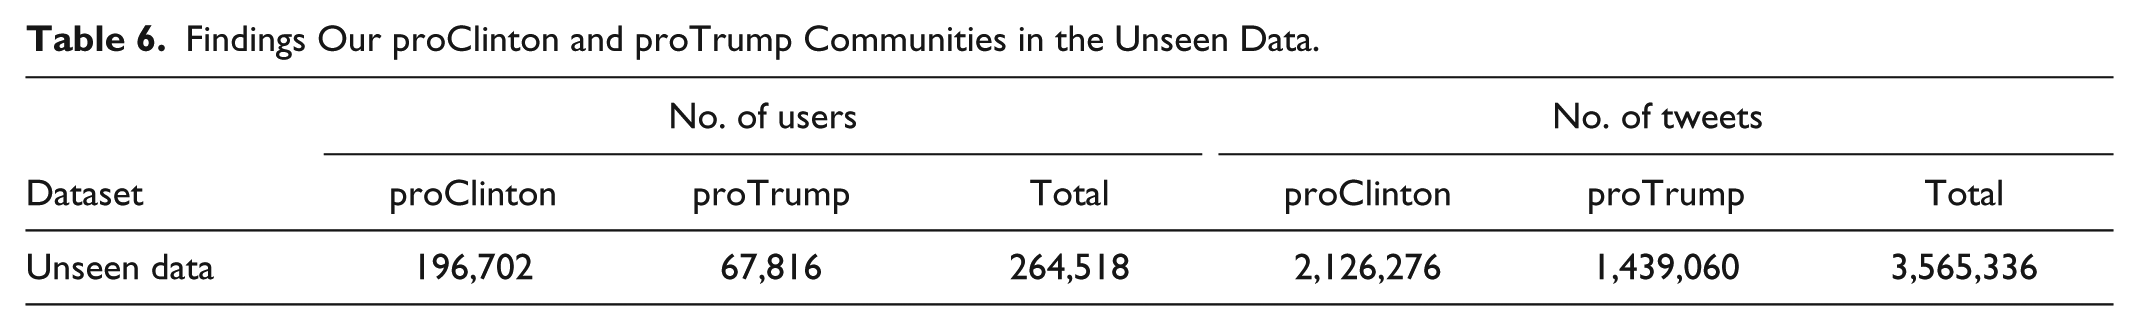
In applying the trained TBNB classifier on our unseen data, we find that our unseen tweeters differentiate into 196,702 proClinton users authoring 2,126,276 tweets (10.81 on average), and 67,816 proTrump users with 1,439,060 tweets (21.98 tweets on average), as shown in Table 6. The proClinton community across the Twitter platform is much more sizable than the proTrump one in terms of the number of users and the number of election-related tweets, but Trump supporters tweet more often on average.
Findings Our proClinton and proTrump Communities in the Unseen Data.
Because each tweet is associated with a time point, we can also examine the dynamics of support, first overall and then by the community. In Figure 3, we show the number of tweets that were posted by proClinton and proTrump communities over time. Not only were proClinton tweets more plentiful as we showed above in Table 6, but they were more prolific over the entire period of analysis. During the three televised debates, marked by spikes in the data, we see particular activity among the proClinton community.
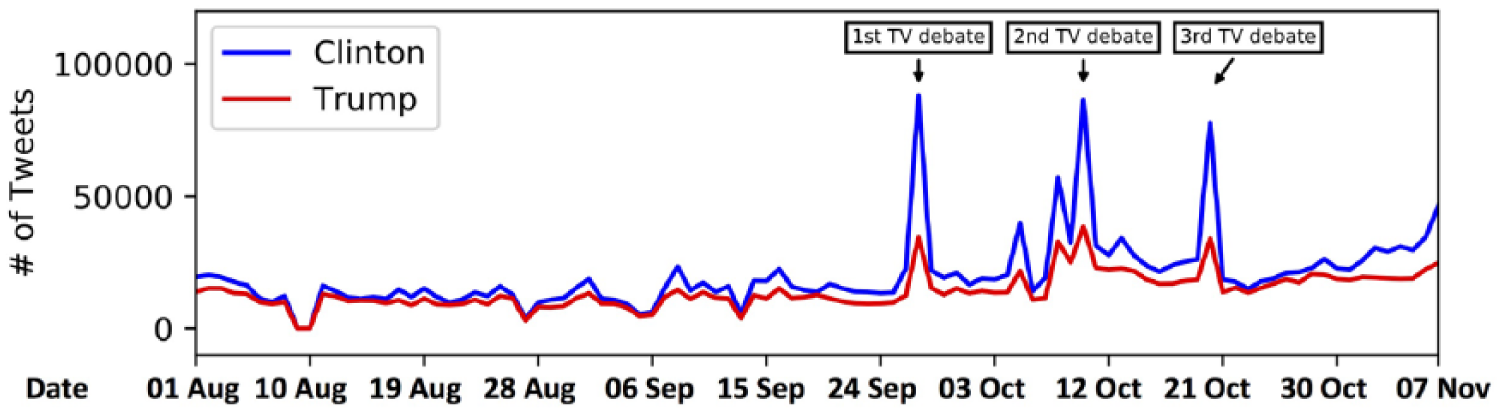
The number of tweets from proClinton and proTrump communities over time.
Results of the Crowdflower user study on the unseen data classification
Table 7 presents the results of our crowdsourced user study examining the performance of our classifier on the unseen data versus the evaluation of crowdsourced workers. Among the 100 randomly selected Twitter users in our unseen data, 76 users are labeled as either proClinton or proTrump according to the online workers. Among these 76 Twitter users, crowdsourced workers were unanimous for 51 (67%)—all three workers agreed that the Twitter user was proClinton, or all three agreed the user was proTrump. Concerning their explanations for how they determined whether a Twitter user was proClinton or proTrump, for 31 users, the workers marked that the “Tweets clearly indicate user’s candidate preference”; for 42 Twitter users, the workers answered that the “Tweets do not clearly indicate user’s candidate preference. But I can figure out the preference by the tweets”; and for three Twitter users, the workers selected that the “Tweets do not clearly indicate the preference. This is my balanced choice.”
The Performance of Classifiers Compared With Human Judgments.

Note. RDN = random classifier; NB = Naive Bayesian classifier; SVM = Support Vector Machine classifier; MLP = Multilayer Perceptron classifier; TBNB = Topic-Based Naive Bayesian classifier.
Table 7 displays the Cohen’s kappa and accuracy scores of the classifiers compared with the human judgments among the 76 users with either proClinton or proTrump labels. All classifiers (with the exception of the random classifier) achieve reasonable accuracy scores. This finding suggests that our hashtag labeling method is effective in training a valid and reliable classifier. Among the classifiers, we still see that the TBNB classifier has higher kappa and accuracy scores than the others, consistent with what we saw with the training data. Our user study demonstrates that our hashtag labeling method and our TBNB classifier perform very well overall—that we can distinguish two communities of support, proClinton and proTrump.
The remaining 24 users of the 100 randomly selected do not have a clear community affiliation according to the crowdsourced workers. Note that these 24 users can be classified as either proClinton or proTrump by our classifier. Thus, it could be that our classifier is in error, which is entirely plausible, as Twitter users may discuss the election—and indeed the use of words in tweets is the criterion to be in our unseen data set—while lacking a vote preference. A second explanation could be that the crowdsourced workers saw an insufficient sample of tweets, and in these (up to eight tweets), the vote preferences of the Twitter users were not revealed. Examining additional content may have proven helpful. A third and related explanation is that our classifier can correctly identify a given user as proClinton or proTrump community, but that the textual information the classifier relies on to make this determination is not immediately discernible to Crowdflower workers. The classifier uses the top-ranked 5,000 words in the training dataset, far more than any Crowdflower worker sees among eight tweets. To illustrate by example, #dealmein is found among Topic 9 in Table 5 as an identifier of the proClinton community. The hashtag emerged as a result of a tweet by Hillary Clinton using the phrase “Deal Me In.” Whereas an online worker may not have recognized the association with the hashtag and the proClinton community, the classifier was able to learn it.
Topics Extracted From the Unseen Data, proTrump and proClinton Communities
To understand the topics of discussion among the proTrump and proClinton communities, we first apply topic models on the tweets of those users who were identified as being part of the proClinton or proTrump communities. As mentioned in section “Methodology,” we set K with different values. We here report on the coherence of the generated topic models and select the topic models with the best K; in this case, K of 70 for proClinton and K of 60 for proTrump, in order ultimately to present and analyze the extracted topics. 27
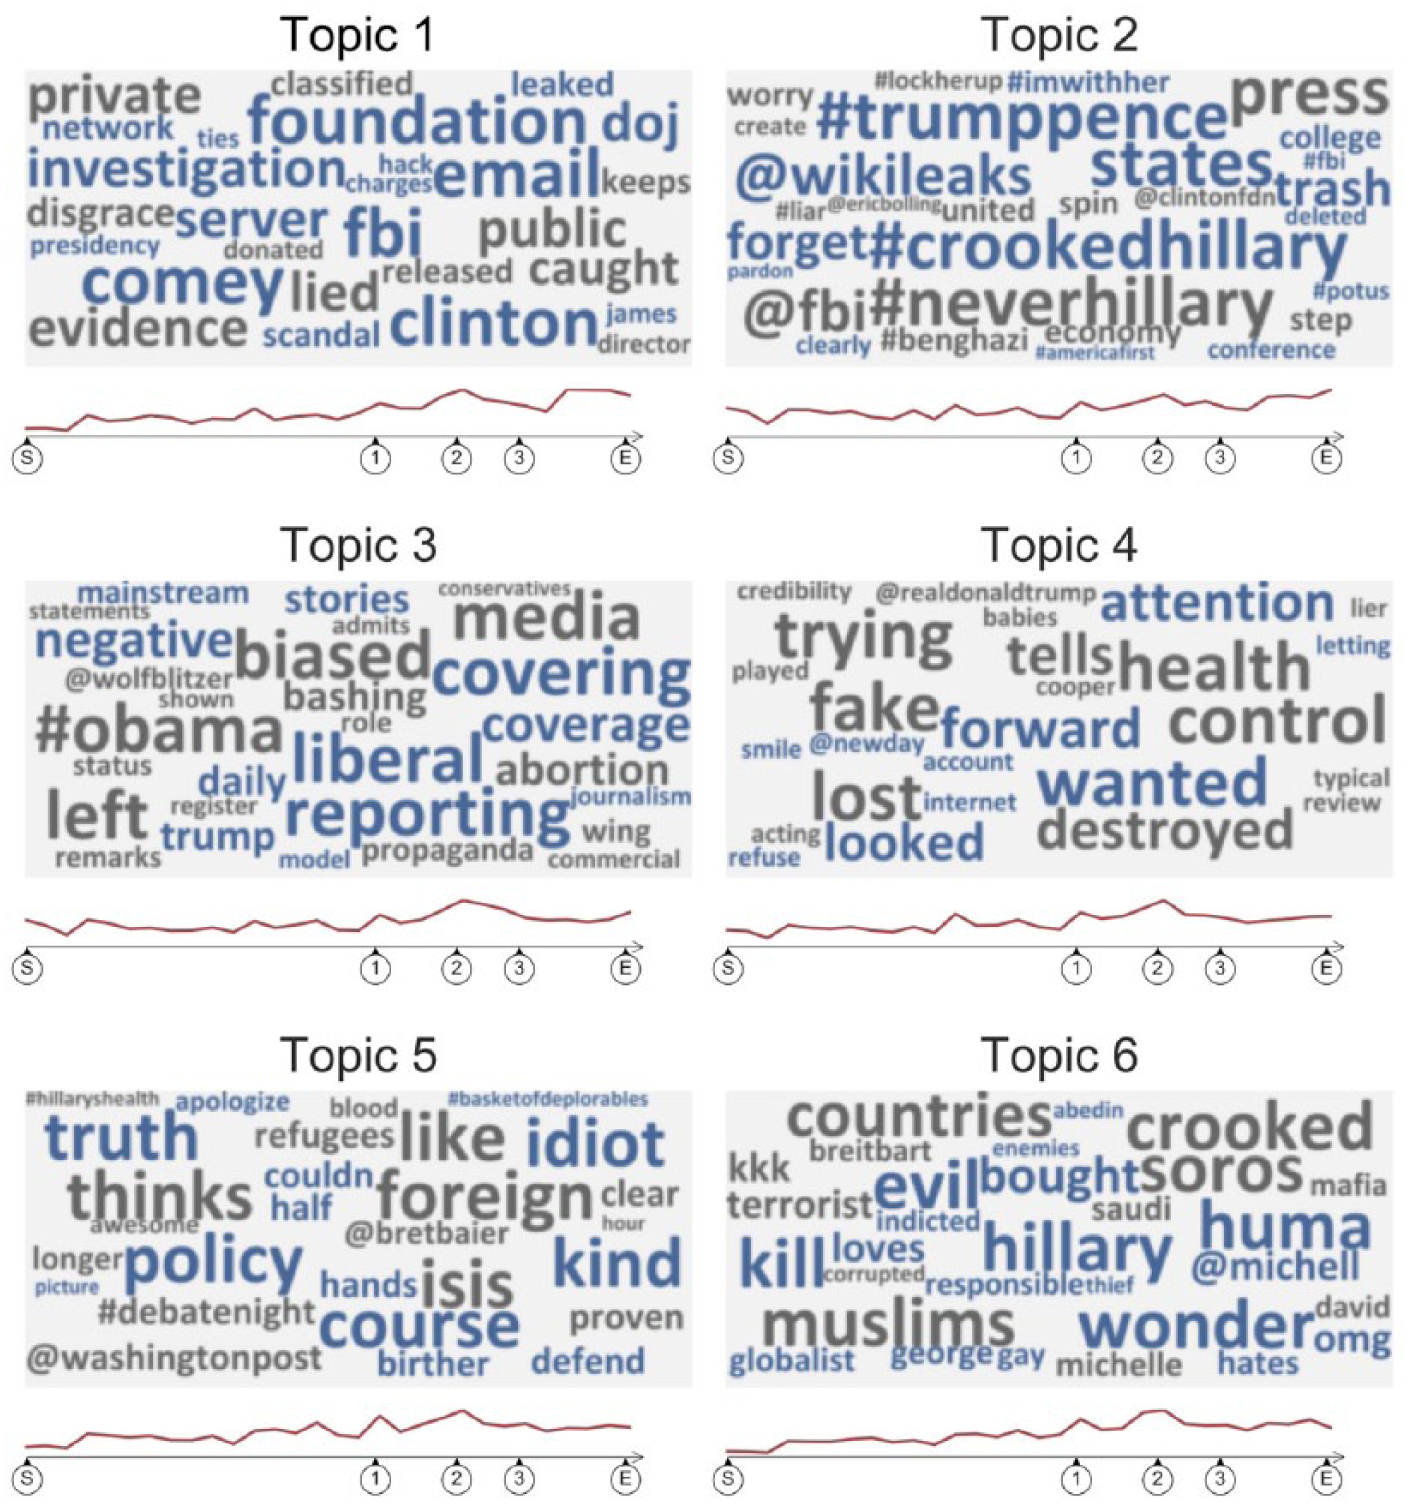
Rather than present all 130 topics across the two communities, for the purpose of visualization and interpretation, we focus on the Top 12 topics from each community. 28 Figures 4 and 5 display the 12 most coherent topics among the proClinton community, and Figures 6 and 7 display topics from proTrump community. To also aid visualization, we display repeated topic words in only one instance—in the respective topic with the highest coherence. 29

Topics extracted from proClinton community (Topics 1-6).

Topics extracted from proClinton community (Topics 7-12).
Topics extracted from proTrump community (Topics 1-6).

Topics extracted from proTrump community (Topics 7-12).
Discussion of the topics by community
Our figures represent the 12 most coherent topics from the topic models of the two communities, as evaluated using the aforementioned topic coherence metrics. For example, Topic 2 in the proClinton community is the second most interpretable/coherent topic within a topic model consisting of K (here, 70) topics for the proClinton community. We represent each topic by a word cloud using its Top n words, here approximately 20 words for each topic. The size of these words indicates how often it is used in the topic discussion. The blue or black color, however, is added only to ease interpretation. We also include the trend for each topic just below the word cloud to highlight at which moments in time that particular topic was discussed. The red line represents the volume of the related tweets over our period of analysis, where the x-axis is the timeline and “S” signals the start date (August 1), numbers “1,” “2,” and “3” denote each debate, and “E” represents election day. A spike in a trend suggests that a topic is highly discussed at that particular point in time.
We first present the topics in the proClinton community in Figures 4 and 5, and then we turn to Figures 6 and 7 for the proTrump community. First, it should be noted that the topics are, to a degree, subject to interpretation. Second, it also bears noting that where we see the similarity in topics among the two communities, that we can conclude that both proClinton and proTrump communities discussed a given issue or event. However, the language used and the ways these issues and topics were discussed was distinct among Clinton and Trump supporters. Finally, as a general comment, it should be noted that there is a relevant dearth of policy-related topics for each community, perhaps with the exception of matters related to immigration such as the border wall. Instead, we see the dominance of themes such as the Clinton email scandal, corruption, concerns over racism and prejudice, gender bias, Russia, mass media and media bias, and voter fraud, to name a few.
Beginning with Figure 4, we see a mix of topics associated more closely with the Trump campaign and those more closely associated with the Clinton campaign. In Topic 1, we find a strong linkage between Trump and racism, with words such as racism, racist, KKK, bigot, scary included. That such a topic would emerge as the single most coherent among the 70 topics in the proClinton community speaks to the nature of the debate on Twitter. Topics 2 and 3 both have linkages to Russia, with Topic 3 particularly relevant to the email scandal including words such as truth, Putin, Foundation, private, and emails. Topic 4 continues this theme with references to the FBI, Comey, lies/liar. The trends demonstrate that Topics 1 through 4 all gain momentum as election day approaches. Topic 5 appears more positive than the previous ones, with words such as hope, nice, choice, children. Topic 6 is particularly relevant to the #vpdebate, including Pence but also covering the need to release tax returns.
Turning to the next most coherent topics, Topics 7 through 12 in Figure 5, we again see a mix of topics with some pertaining more directly to Trump, and others related more to Clinton. For example, words such as sexual assault, rape, dangerous, Billy Bush appear in Topics 7 and 8 related to the allegations against Trump and the Access Hollywood tape. Concerns over unfair trade, middle class, and China appear in Topic 9. Topic 10 through 11 have a mix of more positive words associated with the Clinton campaign such as job, hiring, and #ClintonKaine, whereas Topic 12 again returns to tackling on Trump campaign pledges with build wall.
Turning to the Top 12 most coherent topics of discussion among the proTrump community, we find considerable attention paid to Trump’s opponent. Words such as foundation, email, Clinton, Comey all appear in Topic 1, with considerable discussion from the second debate onward, and then another peak just before election day when Comey announced that the emails were being examined once more. Topic 2 sees a number of mentions of #CrookedHillary and #NeverHillary along with apparent trolling of the opposition with #ImWithHer used. Topic 3 points to perceived media bias, coverage/covering, left, propaganda, Obama, and Topic 5 invokes truth. Topic 5 and particularly Topic 6 speak to concerns over foreign, ISIS, Soros, and muslims.
Finally, Topics 7 through 12 in the proTrump community also provide an important lens to understand Trump support on Twitter. Topic 7 invokes the border wall and illegal while also bringing in #wikileaks and the #ClintonFoundation. Topic 8 turns attention to voter fraud, machine, ballots. Topic 9 is an example of a topic that appeared early on in our period of analysis but was relatively quiet thereafter, touching on several themes including immigration and the candidate names and general words such as election, America. Topic 10 has particular relevance to the debates and debate moderation (e.g., Chris Wallace, debate). Topic 11 links largely to the Obama administration and concerns over a Supreme Court appointment (e.g., Biden, record, Supreme Court) and includes apparent trolling of the former president through @barackobama . Topic 12 represents another mix of terms such as Democrat, friend, and Deplorables.
Among the 12 most coherent topics in each community, there are also some notable absences. Apart from concern about illegal immigration and the border wall, there are no clear topics pertaining to policy decisions or policy-related terms such as taxes/taxes, education, spending, defense, or even Obamacare—even during the presidential debates when these matters were well discussed. There are also few terms relevant to polls or battleground states in these topics, nor to campaign rallies and key events apart from the debates. Nor were these topics especially prescient of the ones that have dominated the first part of the Trump presidency, including the Mueller investigation and fake news, and policy efforts including a repeal of Obamacare followed by success with tax reform legislation.
Discussion
This article has implemented a novel classification method, TBNB, to understand overall levels of support for the 2016 U.S. presidential election candidates and the topics of discussion on social media. Our method relied on users who used hashtags expressing support for the two candidates in consistent ways over time as our ground truth data. We then trained a set of classifiers and applied them to our unseen data to understand the overall levels of support for Trump and Clinton on social media. Finally, we employed topic models to understand the topics of discussion by communities of support. Taken together, our study has provided a novel view of the dynamics of support and discussion—shedding new light on the dynamics of public opinion during the 2016 election. As we have pointed out, a virtue of the method described here is that it is flexible and can be easily extended to other electoral contexts. For example, earlier work employed the methodology for understanding support or opposition to the 2014 Scottish Independence Referendum on social media. Providing one can identify a set of hashtags that are frequently used on Twitter and readily speak to support or opposition for a given candidate, political party, referendum—than one can train a classifier and then explore the levels and dynamics of such support and opposition for a large community of social media users.
Footnotes
Appendix A
The Words That Are Removed From proTrump Figures (Figures 6-7).

| Topic index | Removed words |
|---|---|
| 4 | Lie, cover, destroy |
| 5 | Report |
| 7 | Email, love |
| 9 | Illegal |
| 10 | Debate, @realdonaltrump, go |
| 11 | @realdonaltrump, muslim, give, think |
| 12 | Poll, border, machine, Russian |
Appendix B
Acknowledgements
We thank participants at the SMaPP Global meeting especially for their helpful comments, particularly Josh Tucker, Jonathan Nagler, and Dean Eckles, and the audience at AlPSA for their feedback, especially Thomas Shaw. We also thank the editor, Pablo Barberá, and the two anonymous reviewers for their feedback.
Authors’ Note
Previous versions of this paper were presented at New York University’s Social Media and Political Participation (SMaPP) Global Project meeting in November 2017 and at the Alabama Political Science Association’s (AlPSA) annual meeting in March 2018.
Declaration of Conflicting Interests
The author(s) declared no potential conflicts of interest with respect to the research, authorship, and/or publication of this article.
Funding
The author(s) disclosed receipt of the following financial support for the research, authorship, and/or publication of this article: Anjie Fang thanks the LKAS PhD Scholarship at the University of Glasgow for funding support.