
Abstract
This study analyzed user behaviors on Epinions and generated the following findings. The frequency of the trusting, writing, and rating behaviors of Epinions users demonstrated a power law distribution. Only a small group of users were active on Epinions then. The majority of users obtained trust from only a small group of users, whereas only a small group of Epinions users were trusted by a sizable group. Therefore, most Epinions users were information receivers, whereas only a small group of users were information providers. The intervals of writing, trusting, and rating behaviors on Epinions followed power law distributions, conforming to the results of previous human dynamics studies. The interval of reciprocation also exhibited a power law distribution. The small proportion of reciprocation among Epinions users reflected a distinction between an online trust-relationship network and a real-world social network. Trusting, writing, and rating behaviors on Epinions exhibited patterns similar to power law declines and their frequency fluctuated in later periods. Finally, this study proposed a model on the basis of diminishing user activity over time. By describing the probability of participating in a behavior on Day t and conducting simulation calculations, this study found that this model fit the power law distribution characteristics of user behavior intervals and could thereby serve as an adequate human dynamics model.
Introduction
Human behavior is interactive and temporal in nature, resulting in various dimensions of social evolution. One of the characteristics of interactivity is reciprocity, which can be used to maintain interpersonal relationships. In addition, human dynamics studies have observed similar temporal patterns in human behaviors.
The research about human behavior needs data. Online data have offered new possibilities for studying human dynamics. Because the Internet serves as a platform for various human activities, online communities have provided new avenues for researchers to record and analyze human behaviors. And these online data can be used to analyze the human online behavior. Scholars can investigate the social structure and behavioral characteristics of online communities.
This study adopted Internet data mining to collect user behavior data, analyzed the characteristics of human behavior in online communities (including reciprocation and temporal patterns), and generated a simulation model for the temporal characteristics of human behavior.
Related References
The basic behavior in online society is the behavior of connection. The connection in this article mainly refers to trust. 1
As to connection, Cha, Mislove, and Gummadi (2009) studied the connection of users on the Flickr website. They divided the behavior of connection into two types: one is to create the connection and the other one is to accept the connection. It is found that the indegree and the outdegree both agree with Π (k) ~ k.
Mislove, Koppula, Gummadi, Druschel, and Bhattacharjee (2008) and Leskovec, Backstrom, Kumar, and Tomkins (2008) also studied user’s connection behavior in Flickr, del.icio.us, and Yahoo! Answers site. The nodes are divided into two types: one is with a large degree and the other one is old. It is found that the degree k in f Flickr and del.icio.us agree with the linear priority, that is, Π (k) ~ k. That is, the new connection is proportional to the value of the user. The connection in Yahoo! Answers shows that the sublinear priority (k) ~ k0.9. Leskovec assumes that the older the user is, the more experience in the site, the more new connections will be generated. The empirical results show that the probability of connection will have a peak when the user is just registering, and then it decreases. Finally, as the age of the user grows, the connection probability of the new edge remains basically unchanged.
The previous studies also investigated the characteristics of online communities and behaviors, such as the percentage of reciprocation among users in online communities. For example, some scholars studied LiveJournal (Zakharov, 2007), Flickr (Cha et al., 2009), and Yahoo! 360 (Kumar, Novak & Tomkins, 2010). And they found that these online communities exhibited high percentages of user reciprocation. Among them, 79.26% of LiveJournal user interactions, 68% of Flickr user interactions, and 84% of Yahoo! 360 user interactions were bilateral. The two factors contributing to the high reciprocation levels were (a) the reciprocal relationships among users in these online communities were developed on the basis of friendship, reflecting social etiquette; if User B added User A as a friend, then User A may have felt obligated to add User B in return; and (2) users in these online communities may have already been friends in the real world. 2 In other words, an online social network shares the undirected nature of a real-world social network. 3
In addition, some new findings in human dynamics give statistical temporal characteristics of user behavior in online social networks. User behaviors in online social networks show power law distribution.
Formerly, scholars generally considered the intervals of human activities as conforming to the Poisson distribution, suggesting that the intervals between the occurrences of human behaviors are equal and that the probability of particularly large or small intervals is low. However, recent studies have indicated the temporal characteristics of human behaviors generally cannot be modeled by Poisson distribution. Moreover, events may occur frequently over a short period and then stop occurring for a long period. The time intervals of human behaviors demonstrate characteristics of the power law distribution, rather than the exponential distribution suggested by the conventional Poisson procedure.
Some scholar provided evidences the human online behavior exhibited characteristics of power law. Ghoshal and Holme (2006) studied the time duration distribution of message reply behaviors and interpersonal relationships among Pussokram users, indicating that message reply time complied with a power law distribution and the time duration distribution of interpersonal relationships showed exponential attenuation. In addition, the same data were used to analyze temporal information on user interactions. Ghoshal and Holme (2006) proposed three measures to portray the individual characteristics of the users of online communities (i.e., attractiveness, activity, and participation rate) and found that the probability density functions of these measures demonstrated broad power law–like distributions. A recent study analyzed user communication patterns and temporal characteristics in online social communities and found that several scaling laws were able to describe online behaviors (Rybski, Buldyrev, Havlin, Liljeros & Makse, 2009).
Scholars have proposed various models to explain these phenomena, including a priority list model for decision making, a human dynamics model showing the impact of memory, and an adaptive interest-based human dynamics model, which are described as follows.
Barabási (2005) proposed a priority queuing system to model the processes in the human behavior model, which suggests that people generally determine the priority of events according to their importance and emergency level. They tend to assign the highest priority to important and emergent events and proceed to less important and emergent tasks 4 if they have time. Thus, the least important and emergent tasks are left undone because new important and emergent events occur. Such priority-based decision making causes fat-tailed behaviors, indicating that a large amount of important tasks are completed promptly, whereas tasks are procrastinated for a long period. However, human behavior is not always a task which must been executed.
Vazquez (2007) thought human activity patterns are inherently stochastic, and proposed a human dynamics model illustrating the impact of memory, indicating that human activities conform to power law distributions because people generally possess subjective perceptions of the frequency of past activities and thus increase or decrease the frequency of current behavior according to these perceptions. This human dynamics model explained why the correspondence intervals of Darwin and Einstein exhibited a power exponent of >1, whereas email response time demonstrated a power exponent of <1. The modeling results can be attributed to the growing publicity of Darwin and Einstein, which increased their frequency of correspondence responses over time. The decreasing frequency of email responses can be attributed to occupation with other activities, reduced interest caused by reading other newly arrived emails, or speculation that no emails will be received shortly.
However, some human activities, such as Internet browsing, movie watching, and gaming, should not be described as tasks.
People participate in these activities not because they are emergent or important, but they simply determine their time expended on and frequency of these activities according to personal interests. Thus, Han, Zhou, and Wang (2007) proposed a human dynamics model on the basis of adaptive interest, suggesting that if a person often participates in an activity, he or she will most likely reduce its frequency in later periods, whereas if a person does not engage in a activity for a long period, he or she may increase its frequency in the future. For instance, if a person has not consumed a type of food for a long period, he or she will display substantial interest within a short span of time, increasing the frequency at which he or she eats this food. However, if a person frequently eats a type of food, his or her interest will be diverted to other food for a period for reasons such as reduced interest. Han et al. (2007) indicated that human activities are characterized by this counter-modulatory mechanism, which leads to a power law interval distribution.
Therefore, priority queuing model emphasizes importance; impact of memory model emphasizes the impact of memory; adaptive interest-based human dynamics model emphasizes interest. Above three models just only explain parts of human behavior but not every behavior. In some online society, the behavior dynamics need new models.
In the following sections, we give some statistical results of user behaviors on Epinions.com, and propose a model on the basis of the diminishing activity levels of users over time.
Data
We collect data from Epinion.com to research the online society structure and behavior.
Founded in May 1999, Epinions was a product review website owned by eBay. It provided a free and open online product-reviewing platform for consumers, enabling them to share the positive and negative aspects of consumer products, earn commissions by assisting other website users to make smart purchasing decisions (the website rewarded its users according to their reviewing contributions), and use their expertise to earn recognition and trust. Epinions emphasized the importance of reviewers by showing the main pages of users and their lists of reviews, ratings for reviews, lists of trusted users (other users that a user trusts), and trusting users (other users that trust their reviews). For example, a prolific Epinions reviewer who wrote useful reviews would be trusted by many users, a fact which would be reflected in the lists of trusted and trusting users provided by the website.
Figure 1 illustrates the main page of Reviewer A, showing their registration date, location, total number of published review articles, member visits, total visits (including nonmember visits), user title, and self-introduction. User titles on Epinions included category lead, top reviewer, and advisor. Users that often published high-quality product reviews could be recognized as category leads or top reviewers, whereas those who rated other reviews objectively could be classified as advisors.

Main page of Reviewer A.
Figure 2 shows “the web of trust” of Reviewer A, listing the users they trust, a self-introduction, their location, and the dates when Reviewer A added users to their web of trust.

Web of trusted by Reviewer A.
Figure 3 lists the users who trust Reviewer A, including their user names, self-introductions, locations, and dates when they added Reviewer A to their webs of trust.

List of users trust Reviewer A.
Figure 4 provides a list of reviews by Reviewer A, including publication times, review titles, product names, product categories, product ratings, and ratings received from other users.

List of reviews by Reviewer A.
Figure 5 illustrates a list of user ratings for a review published by Reviewer A, showing user names, titles, user ratings, and rating dates. Epinions stipulated that category leads must ensure that each of their reviews was rated by at least one other category lead or advisor under the reviewed product category.

List of ratings for a review published by Reviewer A.
Data and Statistical Analysis of User Behavior
By adopting a snowball sampling method5,6 to collect data form epinion.com, this study sampled a total 91,338 users, 7 downloading and analyzing 86 G of data including main pages and lists of trusted users, trusting users, product reviews, and user ratings for each of the reviews. The sample included all active Epinions users then, who could be considered as the majority of users on Epinions.
The user behaviors observed on Epinions included publishing product reviews (writing behaviors), trusting other users (trusting behaviors), and rating reviews written by other users (rating behaviors). 8 In this chapter, we analyzed these user behaviors from various perspectives, hoping to provide a detailed illustration of their characteristics.
In this section, some statistical results such as distribution of the number of user behaviors, temporal characteristics of user behaviors, and user activity level analysis are presented.
Distribution of the Number of User Behaviors
On Epinions, link means trust. Therefore, a high outdegree indicated that a user (node) tended to trust others at a relatively high rate, and a high indegree indicated their ability to earn the trust of others.
First, we get the statistical results of behavior of trust. A statistical analysis of the 91,338 users indicated that each user trusted an average of 6.65 users, 18,277 users (20% of the total sample) did not trust any other users, and 77,912 users (85%) did not reach the average number of trusted users (6.65 users), which could be attributed to multiple causes. For instance, these phenomena may be attributable to the perceptions of Epinions users toward trusting people, resulting in the following possible consequences: only a small group of the Epinions users tended to trust other users, or only a small group of them were willing to use this trust function on the website. In addition, they may have lost interest and stopped using the website shortly after registration. The analysis showed that each user was trusted by an average of 6.31 users, 34,308 users (38% of the total sample) did not gain the trust of any other users, and 80,878 users (89%) did not reach the average number of trusting users (6.31). Most Epinions users obtained trust from only a small group of people, whereas only a small group of users were trusted by a sizable group.
Figure 6 illustrates the distribution of trusted and trusting users among the total sample population; the points are equally distributed along both sides of the diagonal line and the Pearson correlation coefficient between the numbers of trusted users and trusting users was .61. In other words, higher numbers of trusted users led to higher numbers of trusting users.

Distribution of trusted and trusting users among the total sample population.
Second, this study analyzed the distribution of the frequencies of writing behaviors (publishing product reviews) and rating behaviors (rating the product reviews posted by other users; Figure 7 (see Appendix Table 1). The frequency of the writing behaviors of each user exhibited a power law distribution. The adopted least squares method generated a power exponent of 1.485 and the employed maximum likelihood estimation approach generated a power exponent of 1.57. This study found that each user published an average of 12.72 product reviews, 28,671 users (31% of the total sample population) did not publish any product reviews, 74,074 users (81%) did not reach the average publishing number (12.72), and the user contributing to the highest number of product reviews published 5,278 reviews. The results of this analysis showed that the majority of Epinions users received information from the website, whereas only a small group of users provided information on the website.

Distribution of the number of published product reviews.
Because the website did not provide a list of ratings by each user for product reviews posted by other users, this study only collected data on the total number of ratings for the product reviews posted by the 91,338 sampled users, compiling a total of 79,118 product review ratings. Although the data were incomplete, this study identified the statistical characteristics of the frequency of rating behaviors, as illustrated by Figure 8 (see Appendix Table 1), which demonstrated that the distribution of the frequency of rating exhibited a power law distribution. The adopted least squares method generated a power exponent of 1.38 and the employed maximum likelihood estimation approach generated a power exponent of 1.58. In addition, the results of the analysis showed that each user rated an average of 214.41 reviews and 76,018 users (96.08% of the total sample population) did not reach the average number of review ratings (214.41). A total of 59,083 users (64.69% of the total sample population) did not provide any ratings, suggesting that, as illustrated in the cases of trusting and writing behaviors, only a small group of users actively participated in rating behaviors.

Distribution of the number of ratings.
Temporal Characteristics of User Behaviors
Temporal characteristics of user behaviors are shown in this section. As mentioned previously, the interval of an activity is generally expected to conform to the Poisson distribution. In other words, scholars have considered the intervals of behaviors to be equally spaced and have assumed that the probability of particularly large or small intervals is low. However, as discussed previously, recent studies have indicated that most of the statistics on the temporal characteristics of human behaviors may occur frequently in a short span of time and then stop occurring for a long period. The intervals of human behaviors demonstrate the characteristics of a power law distribution, rather than the exponential distribution suggested by the conventional Poisson procedure.
Interval characteristics of writing, trusting, and rating behaviors
The analyses of the temporal characteristics of the writing (publishing product reviews), trusting (trusting reviews by other users), and rating (providing ratings for product reviews) behaviors on Epinions are, respectively, shown in Figures 9 to 11 (see Appendix Table 1).

Time interval distribution of trusting behaviors.
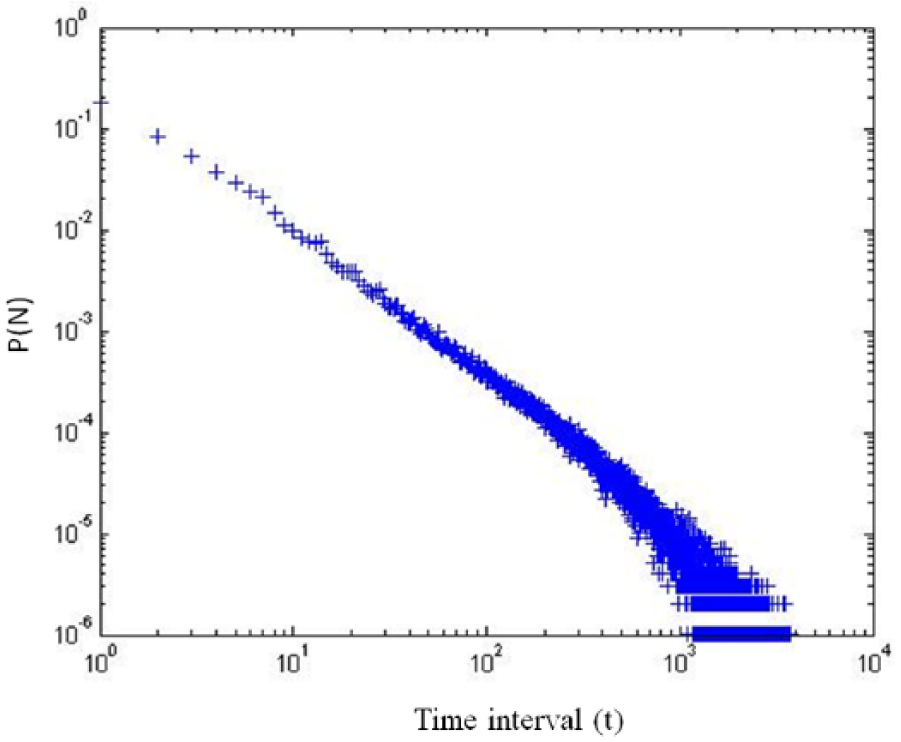
Time interval distribution of writing behaviors.

Time interval distribution of rating behaviors.
For trusting behaviors, the minimum interval was 0 (days), maximum interval was 374 (days), and average interval was 28.13 (days). In addition, the results of the adopted maximum likelihood estimation approach and least squares method showed power exponents of 1.39 and 1.50, respectively.
For writing behaviors, the minimum interval was 0 (days), maximum interval was 3,745 (days), and average interval was 26.49 (days). In addition, the results of the adopted maximum likelihood estimation approach and least squares method showed power exponents of 1.45 and 1.79, respectively.
For rating behaviors, the minimum interval was 0 (days), maximum interval was 3,472 (days), and average interval was 1.39 (days). In addition, the results of the adopted maximum likelihood estimation approach and least squares method showed power exponents of 1.77 and 1.83, respectively.
Compared with the intervals of the trusting and writing behaviors, the average interval of the rating behaviors was short because the users generally rated multiple product reviews on the same day. Therefore, there was a .92 probability that the rating interval was 0 (days). Moreover, trusting and writing behaviors exhibited lower frequencies per day than rating behaviors did.
Rating is a response to product reviews. Reading reviews requires less time than writing does, whereas trusting requires a longer period of time to judge user behavior. For instance, before trusting a reviewer, a user may observe the quality of their product reviews, the number of their trusting users, or the ratings for their product reviews. Therefore, trusting involves comprehensive judgment and requires a longer span of time, resulting in the following descending order of time requirement: trusting, writing, and rating. The results of the average intervals for these behaviors supported this order of time requirement, suggesting that behaviors with higher difficulty levels led to larger time intervals.
Reciprocity and distribution of reciprocation intervals
On Epinions, User A can add User B to their list of trusted users without the consent of User B, who may subsequently add User A as a polite gesture. This study defined users who have been mutually added to their webs of trust as those with a reciprocal relationship. 9 An analysis of the sampled users showed that 28.55% had a reciprocal relationship with at least one other user. Epinions demonstrated a relatively low reciprocation percentage compared with LiveJournal, Flickr, and Yahoo! 360, all of which exhibited reciprocation percentages higher than 70%. This might be a result of the trust-based nature of online relationships, which are different in nature from real-world friendships. In reality, most people have bilateral relationships with their friends and few people have unilateral friendships, in which Person A may regard Person B as a friend but Person B does not regard Person A as a friend. However, in online communities, unilateral trusting relationships have become a norm. For instance, numerous users may trust a highly esteemed user, but a highly esteemed user may not return this trust. According to the rules of Epinions, whether a user trusts another user directly affects the trusting user’s experience, effectiveness, and reputation. Therefore, Epinions users generally trusted other users for various reasons, not simply because they were being trusted. 10
This study defined the interval of two users creating a mutually trusting relationship as a reciprocation interval, which was expressed as the following log–log graph. Figure 12 (see Appendix Table 1) shows that the reciprocation intervals on Epinions exhibited a power law distribution. The results of the adopted least squares method and maximum likelihood estimation approach showed power exponents of 1.18 and 1.49, respectively. Moreover, Figure 12 suggests that, among users with reciprocal relationships, the reciprocation intervals were short, indicating that, when trusted by User A, User B would add the trusting user to their web of trust if they held the same trust. Otherwise, the probability of User B trusting User A was small.

Distribution of reciprocation intervals.
User Activity Level Analysis
To observe the changes in user activity level following their registration, this study selected 9,247 users who registered in 2001 as samples from the total sample population; examined their product reviews published from Day 1 to Day 3,164; and analyzed the number of published product reviews, trusting users, and ratings given to reviews by other users. By focusing on the numbers of published product reviews (writing behaviors), new trusting users (trusting behaviors), and ratings for the published reviews (rating behaviors) on a daily basis, this study measured the activity levels of Epinions users, as illustrated in Figures 13 to 15.
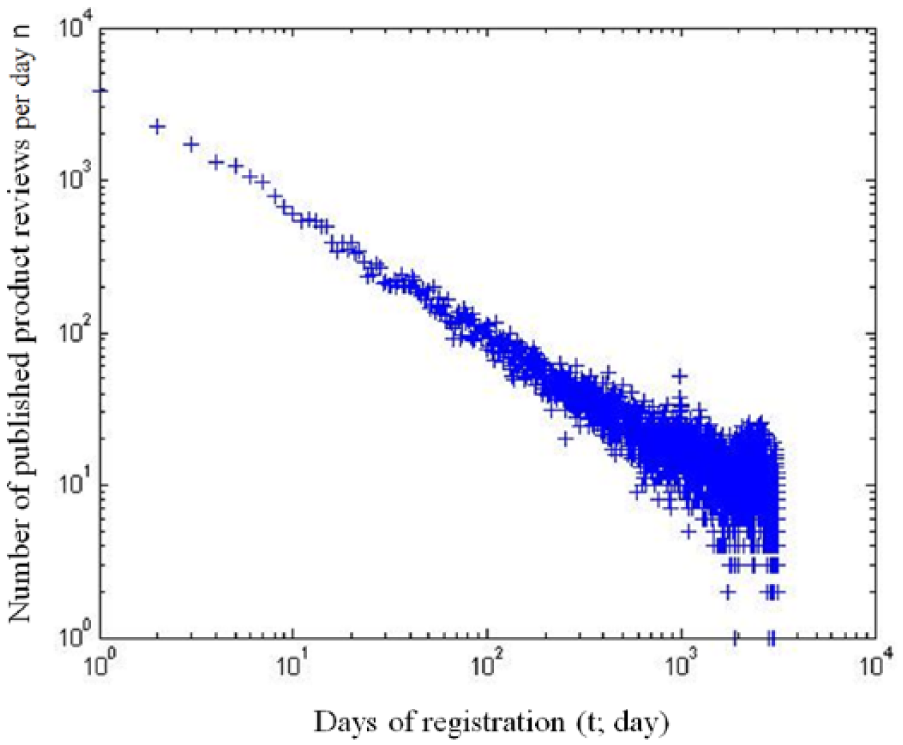
Number of product reviews published per day.

Number of trusting users per day.

Number of ratings per day for reviews by other users.
Overall, the daily frequency of these three behaviors gradually decreased as the number of days after registration (days of registration) increased. However, the activity levels later rebounded, particularly those of rating behaviors, which fluctuated substantially in later periods. This study did not fully ensure the accuracy of the results in Figure 15 because of insufficient data on the rating behaviors, but confirmed that although newly registered users tended to be more active 11 than other Epinions users in that they frequently published product reviews, added users to their webs of trust, and rated product reviews, their activity levels demonstrated patterns similar to a power law decline when the days of registration increased. Furthermore, their activity levels fluctuated in later periods.
Overall, the number of ratings per day for reviews by other users exhibited a power low distribution and right tail jumps, meaning that the number of rating behaviors slightly increased at a point in time long after registration, during which the users began to prefer rating reviews to publishing reviews. Thus, writing behaviors gradually approached zero rather than showed right tail jumps, suggesting that users transitioned from being information providers to information consumers over time, because the purpose of the Epinions website was mainly to offer information to long-term users.
User Behavior Model
In this section, a novel human dynamics model, on the basis of diminishing user activity over time, is proposed. This model can fit the power law distribution characteristics of user behavior intervals in Epinion society.
“User Activity Level Analysis” section shows the evolution characteristics of people’s behavior. That is, the interest or will of one user get smaller and smaller with time going on. That can be used to study the dynamic characteristics of a group.
Previous studies have proposed a priority queuing model, an impact of memory model, and an adaptive interest-based human dynamics model; however, they cannot be used to adequately explain user behaviors on Epinions. For Epinions users, publishing product reviews (writing behaviors), trusting other users (trusting behaviors), and rating product reviews (rating behaviors) were not tasks. In addition, impact of memory model and the adaptive interest-based human dynamics model were not observed in the behaviors of Epinions users, because the overall frequency of their behaviors decreased over time.
One explanation for the gradual decrease in user activity is diminishing interest in the website over time. Another is that newly registered users usually had the most shopping experiences to share and more opportunities to find users they trusted, leading to a reduced frequency of user behaviors over time and increasing time intervals between activities.
Therefore, this study assumed the following:
The probability of each user conducting a behavior

here,
This study suggested that starting from the initiation of these user behaviors, the frequency of engaging in such behaviors decreased over time. Thus, the intervals of such behaviors followed a power law distribution.
2. For each user, the probability of conducting a behavior was positively related to their activity level for such behavior.

According to the aforementioned hypotheses, this study proposed a user behavior model by analyzing Epinions users, assuming that the relationship between time and the probability of the users participating in a behavior followed Equation 1:

Where t denotes the time (day) since the initiation of the behavior,
The model is used to verify the distribution characteristics of time intervals of a group of people’s behaviors. The proof is shown by simulation.
After performing 3,000 calculations using data from 10,000 users, this study generated Figure 16, in which + indicates the simulation results for a = 1, b = 1, and c = 0.001; * suggests the simulation results for a = 1, b = 0.5, and c = 0.001; and o illustrates the simulation results for a = 0.5, b = 1, and c = 0.001.

Distribution of simulation time intervals.
When the Figure 16 is compared with Figures 9, 10, and 11, we find they similar. Figure 16 shows obvious power law distribution characteristics which are time interval distribution of trusting, writing, and rating behaviors as discussed in “Interval Characteristics of Writing, Trusting, and Rating Behaviors” section. These results implied that the proposed model was useful in identifying the power law distribution characteristics of time intervals for specific behaviors. This model is different from the aforementioned models, and therefore, it is a new model to explain the mechanism of human behavior dynamics.
Conclusion
The behavior in a society will affect the development of the society. In Epinions society, the behaviors, such as trust, write, and rate, reflect and affect the characteristics of the society, for example, which types of users are more easily trusted, or what roles are the most used in society, that is, information provider or consumer. The findings are summarized as follows. These findings provide new results about the online society, and will be helpful for scholars to research and compare different online systems.
The study analyzed user behaviors on Epinions and generated the following findings. Most Epinions users obtained trust from only a small group of users, whereas only a small group of users were trusted by a sizable group. For a specific user, a higher number of trusted users led to a higher number of trusting users. The frequency of writing behaviors for each user demonstrated a power law distribution. Most users on Epinions were information receivers, whereas only a small group of users were information providers. The frequency of the rating behaviors exhibited a power law distribution. Regardless of rating, trusting, and writing behaviors, a relatively small number of users were active on Epinions.
When examining the temporal characteristics of user behaviors on Epinions, this study found that writing, trusting, and rating behaviors demonstrated a power law distribution. In addition, higher difficulty levels of user behavior resulted in larger behavior intervals. The interval of reciprocation also supported a power law distribution. Moreover, this study showed a low proportion of reciprocation among Epinions users, suggesting that an online trust-relationship network is different from a real-world social network; compared with a real-world friendship, an online trust relationship is not necessarily bilateral.
The frequency of the three user behaviors on Epinions gradually decreased as the days of registration increased. The activity levels of Epinions users demonstrated a power law decline and fluctuated in later periods.
This study proposed a model on the basis of the diminishing activity levels of users over time. By describing the probability of participating in a behavior on Day t and using this information to conduct simulation calculations, this study found that, compared with the aforementioned models, this model could more appropriately fit the power law distribution characteristics of user behavior intervals and thereby serve as an adequate human dynamics model.
Footnotes
Appendix
A partial list of calculation results is illustrated below:
Declaration of Conflicting Interests
The author(s) declared no potential conflicts of interest with respect to the research, authorship, and/or publication of this article.
Funding
The author(s) disclosed receipt of the following financial support for the research, authorship, and/or publication of this article: This work was supported, in part, by the National Natural Science Foundation of China (Grant Nos. 70801066, 71071167, 71071168, 71371200), and by a grant from Sun Yat-sen University Basic Research Funding (Grant Nos. 1009028, 1109115,16wkjc13).